
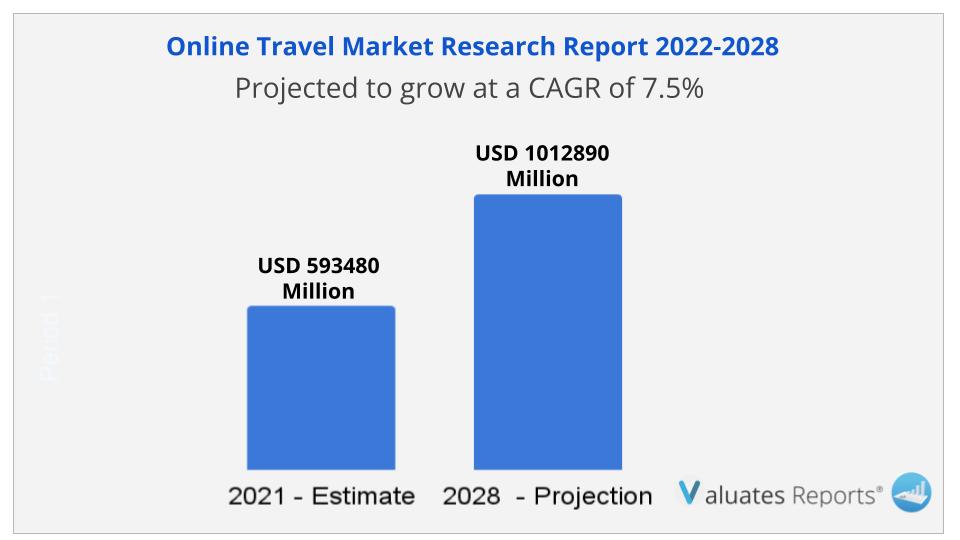
The global Online Travel market size is projected to reach US$ 1012890 million by 2028, from US$ 593480 million in 2021, at a CAGR of 7.5% during 2022-2028. Key drivers of the online travel market include the growing penetration of the internet, mobile phones, and social media exposure. The rising income levels of people and the advent of online travel booking websites, and portals will fuel the demand for the online travel market in the coming years.
The introduction of mobile applications will spurt the growth of the market during the review period.
Growing penetration of the internet and web-based platforms
Consumers have shifted towards the internet for comparing reviews, checking out destinations, and travel accommodations due to ease of use, convenience, and quick comparison. Moreover, social media sites, travel blogs, and forums are the places where people discuss and make their travel plans nowadays. This is prominent, especially among young professionals or people between the age group of 22 to 31 years. Hence tourism companies, tour operators, and travel eCommerce websites are using these platforms to attract potential customers. The virtual world will provide huge potential for the growth of the online travel market during the review period.
The advent of online booking facilities
Online traveling portals, websites help in saving time and money. Flight bookings and hotel reservations are done at the click of a button without the need to travel miles into a brick-and-mortar store. There are dedicated experts to give their insights about the entire trip. Moreover, the internet can aid in giving quick reviews about the services of online booking portals. Hence a variety of travel websites have entered the online space. This will surge the demand for the online travel market in the subsequent years.
Mobile apps
Mobile phone applications are user-friendly and provide an easy interface for travelers. It boosts consumer loyalty and ensures round-the-clock service. In addition to it, people are able to do online ticketing, hotel booking, search about local attractions, and food outlets. They can also explore new destinations, provide feedback, and share pictures of their experience. On the other hand, companies can increase their visibility and present their content to millions of users in one place. These factors will spur the growth of the online travel market during the forecasted period.
Based on type, Online travel agencies will drive the highest growth in the online travel market share due to a considerable shift towards online services for better planning and a pleasant trip experience.
Based on application, travel accommodation will provide lucrative opportunities for growth in the online travel market share owing to the rapid penetration of business services around the world.
Based on region, Asia-Pacific will grow the highest in the online travel market share owing to the huge potential in emerging economies.
This segment focuses on the key players operating in the industry. It underlines all the current and future activities by the prominent manufacturers. By understanding various initiatives being taken up by different players, readers will gain the ability to settle on correct business choices. The authors of the report have provided accurate revenue figures of the companies for the period 2017-2022. The clients are sure to gain the upper hand once they get hold of this report. Key players studied in the research report include:
|
Report Metric |
Details |
|
Report Name |
Online Travel Market |
|
Market size value in 2021 |
USD 593480 Million |
|
Revenue forecast in 2028 |
USD 1012890 Million |
|
Growth Rate |
7.5% |
|
Base year considered |
2021 |
|
Forecast Period |
2022-2028 |
|
By Type |
Online Travel Agencies, Direct Travel Suppliers |
|
By Application |
Transportation, Travel Accommodation, Vacation Packages |
|
Report Coverage |
Revenue & volume forecast, company share, competitive landscape, growth factors, and trends |
|
Segments Covered |
By Type, Application, and Region |
|
Geographic Regions Covered |
North America, Europe, Asia Pacific, Latin America, Middle East & Africa |
Ans. The global Online Travel market size is projected to reach US$ 1012890 million by 2028, from US$ 593480 million in 2021, at a CAGR of 7.5% during 2022-2028.
Ans. Some of the major companies are Expedia, TripAdvisor, Priceline, CheapOair.Com, Trivago, Make My Trip, AirGorilla, Alibaba, Yatra Online
Ans. Yes, the report includes a COVID-19 impact analysis. Also, it is further extended into every individual segment of the report.
1 Report Business Overview
1.1 Study Scope
1.2 Market Analysis by Type
1.2.1 Global Online Travel Market Size Growth Rate by Type, 2017 VS 2021 VS 2028
1.2.2 Online Travel Agencies
1.2.3 Direct Travel Suppliers
1.3 Market by Application
1.3.1 Global Online Travel Market Size Growth Rate by Application, 2017 VS 2021 VS 2028
1.3.2 Transportation
1.3.3 Travel Accommodation
1.3.4 Vacation Packages
1.4 Study Objectives
1.5 Years Considered
2 Global Growth Trends
2.1 Global Online Travel Market Perspective (2017-2028)
2.2 Online Travel Growth Trends by Region
2.2.1 Online Travel Market Size by Region: 2017 VS 2021 VS 2028
2.2.2 Online Travel Historic Market Size by Region (2017-2022)
2.2.3 Online Travel Forecasted Market Size by Region (2023-2028)
2.3 Online Travel Market Dynamics
2.3.1 Online Travel Industry Trends
2.3.2 Online Travel Market Drivers
2.3.3 Online Travel Market Challenges
2.3.4 Online Travel Market Restraints
3 Competition Landscape by Key Players
3.1 Global Top Online Travel Players by Revenue
3.1.1 Global Top Online Travel Players by Revenue (2017-2022)
3.1.2 Global Online Travel Revenue Market Share by Players (2017-2022)
3.2 Global Online Travel Market Share by Company Type (Tier 1, Tier 2, and Tier 3)
3.3 Players Covered: Ranking by Online Travel Revenue
3.4 Global Online Travel Market Concentration Ratio
3.4.1 Global Online Travel Market Concentration Ratio (CR5 and HHI)
3.4.2 Global Top 10 and Top 5 Companies by Online Travel Revenue in 2021
3.5 Online Travel Key Players Head office and Area Served
3.6 Key Players Online Travel Product Solution and Service
3.7 Date of Enter into Online Travel Market
3.8 Mergers & Acquisitions, Expansion Plans
4 Online Travel Breakdown Data by Type
4.1 Global Online Travel Historic Market Size by Type (2017-2022)
4.2 Global Online Travel Forecasted Market Size by Type (2023-2028)
5 Online Travel Breakdown Data by Application
5.1 Global Online Travel Historic Market Size by Application (2017-2022)
5.2 Global Online Travel Forecasted Market Size by Application (2023-2028)
6 North America
6.1 North America Online Travel Market Size (2017-2028)
6.2 North America Online Travel Market Size by Type
6.2.1 North America Online Travel Market Size by Type (2017-2022)
6.2.2 North America Online Travel Market Size by Type (2023-2028)
6.2.3 North America Online Travel Market Share by Type (2017-2028)
6.3 North America Online Travel Market Size by Application
6.3.1 North America Online Travel Market Size by Application (2017-2022)
6.3.2 North America Online Travel Market Size by Application (2023-2028)
6.3.3 North America Online Travel Market Share by Application (2017-2028)
6.4 North America Online Travel Market Size by Country
6.4.1 North America Online Travel Market Size by Country (2017-2022)
6.4.2 North America Online Travel Market Size by Country (2023-2028)
6.4.3 U.S.
6.4.4 Canada
7 Europe
7.1 Europe Online Travel Market Size (2017-2028)
7.2 Europe Online Travel Market Size by Type
7.2.1 Europe Online Travel Market Size by Type (2017-2022)
7.2.2 Europe Online Travel Market Size by Type (2023-2028)
7.2.3 Europe Online Travel Market Share by Type (2017-2028)
7.3 Europe Online Travel Market Size by Application
7.3.1 Europe Online Travel Market Size by Application (2017-2022)
7.3.2 Europe Online Travel Market Size by Application (2023-2028)
7.3.3 Europe Online Travel Market Share by Application (2017-2028)
7.4 Europe Online Travel Market Size by Country
7.4.1 Europe Online Travel Market Size by Country (2017-2022)
7.4.2 Europe Online Travel Market Size by Country (2023-2028)
7.4.3 Germany
7.4.4 France
7.4.5 U.K.
7.4.6 Italy
7.4.7 Russia
7.4.8 Nordic Countries
8 Asia-Pacific
8.1 Asia-Pacific Online Travel Market Size (2017-2028)
8.2 Asia-Pacific Online Travel Market Size by Type
8.2.1 Asia-Pacific Online Travel Market Size by Type (2017-2022)
8.2.2 Asia-Pacific Online Travel Market Size by Type (2023-2028)
8.2.3 Asia-Pacific Online Travel Market Share by Type (2017-2028)
8.3 Asia-Pacific Online Travel Market Size by Application
8.3.1 Asia-Pacific Online Travel Market Size by Application (2017-2022)
8.3.2 Asia-Pacific Online Travel Market Size by Application (2023-2028)
8.3.3 Asia-Pacific Online Travel Market Share by Application (2017-2028)
8.4 Asia-Pacific Online Travel Market Size by Region
8.4.1 Asia-Pacific Online Travel Market Size by Region (2017-2022)
8.4.2 Asia-Pacific Online Travel Market Size by Region (2023-2028)
8.4.3 China
8.4.4 Japan
8.4.5 South Korea
8.4.6 Southeast Asia
8.4.7 India
8.4.8 Australia
9 Latin America
9.1 Latin America Online Travel Market Size (2017-2028)
9.2 Latin America Online Travel Market Size by Type
9.2.1 Latin America Online Travel Market Size by Type (2017-2022)
9.2.2 Latin America Online Travel Market Size by Type (2023-2028)
9.2.3 Latin America Online Travel Market Share by Type (2017-2028)
9.3 Latin America Online Travel Market Size by Application
9.3.1 Latin America Online Travel Market Size by Application (2017-2022)
9.3.2 Latin America Online Travel Market Size by Application (2023-2028)
9.3.3 Latin America Online Travel Market Share by Application (2017-2028)
9.4 Latin America Online Travel Market Size by Country
9.4.1 Latin America Online Travel Market Size by Country (2017-2022)
9.4.2 Latin America Online Travel Market Size by Country (2023-2028)
9.4.3 Mexico
9.4.4 Brazil
10 Middle East & Africa
10.1 Middle East & Africa Online Travel Market Size (2017-2028)
10.2 Middle East & Africa Online Travel Market Size by Type
10.2.1 Middle East & Africa Online Travel Market Size by Type (2017-2022)
10.2.2 Middle East & Africa Online Travel Market Size by Type (2023-2028)
10.2.3 Middle East & Africa Online Travel Market Share by Type (2017-2028)
10.3 Middle East & Africa Online Travel Market Size by Application
10.3.1 Middle East & Africa Online Travel Market Size by Application (2017-2022)
10.3.2 Middle East & Africa Online Travel Market Size by Application (2023-2028)
10.3.3 Middle East & Africa Online Travel Market Share by Application (2017-2028)
10.4 Middle East & Africa Online Travel Market Size by Country
10.4.1 Middle East & Africa Online Travel Market Size by Country (2017-2022)
10.4.2 Middle East & Africa Online Travel Market Size by Country (2023-2028)
10.4.3 Turkey
10.4.4 Saudi Arabia
10.4.5 UAE
11 Key Players Profiles
11.1 Expedia
11.1.1 Expedia Company Details
11.1.2 Expedia Business Overview
11.1.3 Expedia Online Travel Introduction
11.1.4 Expedia Revenue in Online Travel Business (2017-2022)
11.1.5 Expedia Recent Developments
11.2 Priceline
11.2.1 Priceline Company Details
11.2.2 Priceline Business Overview
11.2.3 Priceline Online Travel Introduction
11.2.4 Priceline Revenue in Online Travel Business (2017-2022)
11.2.5 Priceline Recent Developments
11.3 TripAdvisor
11.3.1 TripAdvisor Company Details
11.3.2 TripAdvisor Business Overview
11.3.3 TripAdvisor Online Travel Introduction
11.3.4 TripAdvisor Revenue in Online Travel Business (2017-2022)
11.3.5 TripAdvisor Recent Developments
11.4 Ctrip.Com International
11.4.1 Ctrip.Com International Company Details
11.4.2 Ctrip.Com International Business Overview
11.4.3 Ctrip.Com International Online Travel Introduction
11.4.4 Ctrip.Com International Revenue in Online Travel Business (2017-2022)
11.4.5 Ctrip.Com International Recent Developments
11.5 Hostelworld
11.5.1 Hostelworld Company Details
11.5.2 Hostelworld Business Overview
11.5.3 Hostelworld Online Travel Introduction
11.5.4 Hostelworld Revenue in Online Travel Business (2017-2022)
11.5.5 Hostelworld Recent Developments
11.6 Hotel Urbano
11.6.1 Hotel Urbano Company Details
11.6.2 Hotel Urbano Business Overview
11.6.3 Hotel Urbano Online Travel Introduction
11.6.4 Hotel Urbano Revenue in Online Travel Business (2017-2022)
11.6.5 Hotel Urbano Recent Developments
11.7 Tourism
11.7.1 Tourism Company Details
11.7.2 Tourism Business Overview
11.7.3 Tourism Online Travel Introduction
11.7.4 Tourism Revenue in Online Travel Business (2017-2022)
11.7.5 Tourism Recent Developments
11.8 CheapOair.Com
11.8.1 CheapOair.Com Company Details
11.8.2 CheapOair.Com Business Overview
11.8.3 CheapOair.Com Online Travel Introduction
11.8.4 CheapOair.Com Revenue in Online Travel Business (2017-2022)
11.8.5 CheapOair.Com Recent Developments
11.9 Trivago
11.9.1 Trivago Company Details
11.9.2 Trivago Business Overview
11.9.3 Trivago Online Travel Introduction
11.9.4 Trivago Revenue in Online Travel Business (2017-2022)
11.9.5 Trivago Recent Developments
11.10 Thomas Cook
11.10.1 Thomas Cook Company Details
11.10.2 Thomas Cook Business Overview
11.10.3 Thomas Cook Online Travel Introduction
11.10.4 Thomas Cook Revenue in Online Travel Business (2017-2022)
11.10.5 Thomas Cook Recent Developments
11.11 MakeMyTrip
11.11.1 MakeMyTrip Company Details
11.11.2 MakeMyTrip Business Overview
11.11.3 MakeMyTrip Online Travel Introduction
11.11.4 MakeMyTrip Revenue in Online Travel Business (2017-2022)
11.11.5 MakeMyTrip Recent Developments
11.12 AirGorilla
11.12.1 AirGorilla Company Details
11.12.2 AirGorilla Business Overview
11.12.3 AirGorilla Online Travel Introduction
11.12.4 AirGorilla Revenue in Online Travel Business (2017-2022)
11.12.5 AirGorilla Recent Developments
11.13 Hays Travel
11.13.1 Hays Travel Company Details
11.13.2 Hays Travel Business Overview
11.13.3 Hays Travel Online Travel Introduction
11.13.4 Hays Travel Revenue in Online Travel Business (2017-2022)
11.13.5 Hays Travel Recent Developments
11.14 Airbnb
11.14.1 Airbnb Company Details
11.14.2 Airbnb Business Overview
11.14.3 Airbnb Online Travel Introduction
11.14.4 Airbnb Revenue in Online Travel Business (2017-2022)
11.14.5 Airbnb Recent Developments
11.15 Yatra Online
11.15.1 Yatra Online Company Details
11.15.2 Yatra Online Business Overview
11.15.3 Yatra Online Online Travel Introduction
11.15.4 Yatra Online Revenue in Online Travel Business (2017-2022)
11.15.5 Yatra Online Recent Developments
11.16 Alibaba
11.16.1 Alibaba Company Details
11.16.2 Alibaba Business Overview
11.16.3 Alibaba Online Travel Introduction
11.16.4 Alibaba Revenue in Online Travel Business (2017-2022)
11.16.5 Alibaba Recent Developments
11.17 Tuniu
11.17.1 Tuniu Company Details
11.17.2 Tuniu Business Overview
11.17.3 Tuniu Online Travel Introduction
11.17.4 Tuniu Revenue in Online Travel Business (2017-2022)
11.17.5 Tuniu Recent Developments
12 Analyst's Viewpoints/Conclusions
13 Appendix
13.1 Research Methodology
13.1.1 Methodology/Research Approach
13.1.2 Data Source
13.2 Author Details
13.3 Disclaimer
Table 1. Global Online Travel Market Size Growth Rate by Type (US$ Million), 2017 VS 2021 VS 2028
Table 2. Key Players of Online Travel Agencies
Table 3. Key Players of Direct Travel Suppliers
Table 4. Global Online Travel Market Size Growth Rate by Application (US$ Million), 2017 VS 2021 VS 2028
Table 5. Global Online Travel Market Size by Region (US$ Million): 2017 VS 2021 VS 2028
Table 6. Global Online Travel Market Size by Region (2017-2022) & (US$ Million)
Table 7. Global Online Travel Market Share by Region (2017-2022)
Table 8. Global Online Travel Forecasted Market Size by Region (2023-2028) & (US$ Million)
Table 9. Global Online Travel Market Share by Region (2023-2028)
Table 10. Online Travel Market Trends
Table 11. Online Travel Market Drivers
Table 12. Online Travel Market Challenges
Table 13. Online Travel Market Restraints
Table 14. Global Online Travel Revenue by Players (2017-2022) & (US$ Million)
Table 15. Global Online Travel Revenue Share by Players (2017-2022)
Table 16. Global Top Online Travel by Company Type (Tier 1, Tier 2, and Tier 3) & (based on the Revenue in Online Travel as of 2021)
Table 17. Ranking of Global Top Online Travel Companies by Revenue (US$ Million) in 2021
Table 18. Global 5 Largest Players Market Share by Online Travel Revenue (CR5 and HHI) & (2017-2022)
Table 19. Key Players Headquarters and Area Served
Table 20. Key Players Online Travel Product Solution and Service
Table 21. Date of Enter into Online Travel Market
Table 22. Mergers & Acquisitions, Expansion Plans
Table 23. Global Online Travel Market Size by Type (2017-2022) & (US$ Million)
Table 24. Global Online Travel Revenue Market Share by Type (2017-2022)
Table 25. Global Online Travel Forecasted Market Size by Type (2023-2028) & (US$ Million)
Table 26. Global Online Travel Revenue Market Share by Type (2023-2028)
Table 27. Global Online Travel Market Size by Application (2017-2022) & (US$ Million)
Table 28. Global Online Travel Revenue Share by Application (2017-2022)
Table 29. Global Online Travel Forecasted Market Size by Application (2023-2028) & (US$ Million)
Table 30. Global Online Travel Revenue Share by Application (2023-2028)
Table 31. North America Online Travel Market Size by Type (2017-2022) & (US$ Million)
Table 32. North America Online Travel Market Size by Type (2023-2028) & (US$ Million)
Table 33. North America Online Travel Market Size by Application (2017-2022) & (US$ Million)
Table 34. North America Online Travel Market Size by Application (2023-2028) & (US$ Million)
Table 35. North America Online Travel Market Size by Country (2017-2022) & (US$ Million)
Table 36. North America Online Travel Market Size by Country (2023-2028) & (US$ Million)
Table 37. Europe Online Travel Market Size by Type (2017-2022) & (US$ Million)
Table 38. Europe Online Travel Market Size by Type (2023-2028) & (US$ Million)
Table 39. Europe Online Travel Market Size by Application (2017-2022) & (US$ Million)
Table 40. Europe Online Travel Market Size by Application (2023-2028) & (US$ Million)
Table 41. Europe Online Travel Market Size by Country (2017-2022) & (US$ Million)
Table 42. Europe Online Travel Market Size by Country (2023-2028) & (US$ Million)
Table 43. Asia Pacific Online Travel Market Size by Type (2017-2022) & (US$ Million)
Table 44. Asia Pacific Online Travel Market Size by Type (2023-2028) & (US$ Million)
Table 45. Asia Pacific Online Travel Market Size by Application (2017-2022) & (US$ Million)
Table 46. Asia Pacific Online Travel Market Size by Application (2023-2028) & (US$ Million)
Table 47. Asia Pacific Online Travel Market Size by Region (2017-2022) & (US$ Million)
Table 48. Asia Pacific Online Travel Market Size by Region (2023-2028) & (US$ Million)
Table 49. Latin America Online Travel Market Size by Type (2017-2022) & (US$ Million)
Table 50. Latin America Online Travel Market Size by Type (2023-2028) & (US$ Million)
Table 51. Latin America Online Travel Market Size by Application (2017-2022) & (US$ Million)
Table 52. Latin America Online Travel Market Size by Application (2023-2028) & (US$ Million)
Table 53. Latin America Online Travel Market Size by Country (2017-2022) & (US$ Million)
Table 54. Latin America Online Travel Market Size by Country (2023-2028) & (US$ Million)
Table 55. Middle East and Africa Online Travel Market Size by Type (2017-2022) & (US$ Million)
Table 56. Middle East and Africa Online Travel Market Size by Type (2023-2028) & (US$ Million)
Table 57. Middle East and Africa Online Travel Market Size by Application (2017-2022) & (US$ Million)
Table 58. Middle East and Africa Online Travel Market Size by Application (2023-2028) & (US$ Million)
Table 59. Middle East and Africa Online Travel Market Size by Country (2017-2022) & (US$ Million)
Table 60. Middle East and Africa Online Travel Market Size by Country (2023-2028) & (US$ Million)
Table 61. Expedia Company Details
Table 62. Expedia Business Overview
Table 63. Expedia Online Travel Product
Table 64. Expedia Revenue in Online Travel Business (2017-2022) & (US$ Million)
Table 65. Expedia Recent Developments
Table 66. Priceline Company Details
Table 67. Priceline Business Overview
Table 68. Priceline Online Travel Product
Table 69. Priceline Revenue in Online Travel Business (2017-2022) & (US$ Million)
Table 70. Priceline Recent Developments
Table 71. TripAdvisor Company Details
Table 72. TripAdvisor Business Overview
Table 73. TripAdvisor Online Travel Product
Table 74. TripAdvisor Revenue in Online Travel Business (2017-2022) & (US$ Million)
Table 75. TripAdvisor Recent Developments
Table 76. Ctrip.Com International Company Details
Table 77. Ctrip.Com International Business Overview
Table 78. Ctrip.Com International Online Travel Product
Table 79. Ctrip.Com International Revenue in Online Travel Business (2017-2022) & (US$ Million)
Table 80. Ctrip.Com International Recent Developments
Table 81. Hostelworld Company Details
Table 82. Hostelworld Business Overview
Table 83. Hostelworld Online Travel Product
Table 84. Hostelworld Revenue in Online Travel Business (2017-2022) & (US$ Million)
Table 85. Hostelworld Recent Developments
Table 86. Hotel Urbano Company Details
Table 87. Hotel Urbano Business Overview
Table 88. Hotel Urbano Online Travel Product
Table 89. Hotel Urbano Revenue in Online Travel Business (2017-2022) & (US$ Million)
Table 90. Hotel Urbano Recent Developments
Table 91. Tourism Company Details
Table 92. Tourism Business Overview
Table 93. Tourism Online Travel Product
Table 94. Tourism Revenue in Online Travel Business (2017-2022) & (US$ Million)
Table 95. Tourism Recent Developments
Table 96. CheapOair.Com Company Details
Table 97. CheapOair.Com Business Overview
Table 98. CheapOair.Com Online Travel Product
Table 99. CheapOair.Com Revenue in Online Travel Business (2017-2022) & (US$ Million)
Table 100. CheapOair.Com Recent Developments
Table 101. Trivago Company Details
Table 102. Trivago Business Overview
Table 103. Trivago Online Travel Product
Table 104. Trivago Revenue in Online Travel Business (2017-2022) & (US$ Million)
Table 105. Trivago Recent Developments
Table 106. Thomas Cook Company Details
Table 107. Thomas Cook Business Overview
Table 108. Thomas Cook Online Travel Product
Table 109. Thomas Cook Revenue in Online Travel Business (2017-2022) & (US$ Million)
Table 110. Thomas Cook Recent Developments
Table 111. MakeMyTrip Company Details
Table 112. MakeMyTrip Business Overview
Table 113. MakeMyTrip Online Travel Product
Table 114. MakeMyTrip Revenue in Online Travel Business (2017-2022) & (US$ Million)
Table 115. MakeMyTrip Recent Developments
Table 116. AirGorilla Company Details
Table 117. AirGorilla Business Overview
Table 118. AirGorilla Online Travel Product
Table 119. AirGorilla Revenue in Online Travel Business (2017-2022) & (US$ Million)
Table 120. AirGorilla Recent Developments
Table 121. Hays Travel Company Details
Table 122. Hays Travel Business Overview
Table 123. Hays Travel Online Travel Product
Table 124. Hays Travel Revenue in Online Travel Business (2017-2022) & (US$ Million)
Table 125. Hays Travel Recent Developments
Table 126. Airbnb Company Details
Table 127. Airbnb Business Overview
Table 128. Airbnb Online Travel Product
Table 129. Airbnb Revenue in Online Travel Business (2017-2022) & (US$ Million)
Table 130. Airbnb Recent Developments
Table 131. Yatra Online Company Details
Table 132. Yatra Online Business Overview
Table 133. Yatra Online Online Travel Product
Table 134. Yatra Online Revenue in Online Travel Business (2017-2022) & (US$ Million)
Table 135. Yatra Online Recent Developments
Table 136. Alibaba Company Details
Table 137. Alibaba Business Overview
Table 138. Alibaba Online Travel Product
Table 139. Alibaba Revenue in Online Travel Business (2017-2022) & (US$ Million)
Table 140. Alibaba Recent Developments
Table 141. Tuniu Company Details
Table 142. Tuniu Business Overview
Table 143. Tuniu Online Travel Product
Table 144. Tuniu Revenue in Online Travel Business (2017-2022) & (US$ Million)
Table 145. Tuniu Recent Developments
Table 146. Research Programs/Design for This Report
Table 147. Key Data Information from Secondary Sources
Table 148. Key Data Information from Primary Sources
List of Figures
Figure 1. Global Online Travel Market Share by Type: 2021 VS 2028
Figure 2. Online Travel Agencies Features
Figure 3. Direct Travel Suppliers Features
Figure 4. Global Online Travel Market Share by Application: 2021 VS 2028
Figure 5. Transportation Case Studies
Figure 6. Travel Accommodation Case Studies
Figure 7. Vacation Packages Case Studies
Figure 8. Online Travel Report Years Considered
Figure 9. Global Online Travel Market Size (US$ Million), Year-over-Year: 2017-2028
Figure 10. Global Online Travel Market Size, (US$ Million), 2017 VS 2021 VS 2028
Figure 11. Global Online Travel Market Share by Region: 2021 VS 2028
Figure 12. Global Online Travel Market Share by Players in 2021
Figure 13. Global Top Online Travel Players by Company Type (Tier 1, Tier 2, and Tier 3) & (based on the Revenue in Online Travel as of 2021)
Figure 14. The Top 10 and 5 Players Market Share by Online Travel Revenue in 2021
Figure 15. North America Online Travel Market Size YoY (2017-2028) & (US$ Million)
Figure 16. North America Online Travel Market Size Market Share by Type (2017-2028)
Figure 17. North America Online Travel Market Size Market Share by Application (2017-2028)
Figure 18. North America Online Travel Market Size Share by Country (2017-2028)
Figure 19. United States Online Travel Market Size YoY Growth (2017-2028) & (US$ Million)
Figure 20. Canada Online Travel Market Size YoY Growth (2017-2028) & (US$ Million)
Figure 21. Europe Online Travel Market Size YoY (2017-2028) & (US$ Million)
Figure 22. Europe Online Travel Market Size Market Share by Type (2017-2028)
Figure 23. Europe Online Travel Market Size Market Share by Application (2017-2028)
Figure 24. Europe Online Travel Market Size Share by Country (2017-2028)
Figure 25. Germany Online Travel Market Size YoY Growth (2017-2028) & (US$ Million)
Figure 26. France Online Travel Market Size YoY Growth (2017-2028) & (US$ Million)
Figure 27. U.K. Online Travel Market Size YoY Growth (2017-2028) & (US$ Million)
Figure 28. Italy Online Travel Market Size YoY Growth (2017-2028) & (US$ Million)
Figure 29. Russia Online Travel Market Size YoY Growth (2017-2028) & (US$ Million)
Figure 30. Nordic Countries Online Travel Market Size YoY Growth (2017-2028) & (US$ Million)
Figure 31. Asia-Pacific Online Travel Market Size YoY (2017-2028) & (US$ Million)
Figure 32. Asia Pacific Online Travel Market Size Market Share by Type (2017-2028)
Figure 33. Asia Pacific Online Travel Market Size Market Share by Application (2017-2028)
Figure 34. Asia Pacific Online Travel Market Size Share by Region (2017-2028)
Figure 35. China Online Travel Market Size YoY Growth (2017-2028) & (US$ Million)
Figure 36. Japan Online Travel Market Size YoY Growth (2017-2028) & (US$ Million)
Figure 37. South Korea Online Travel Market Size YoY Growth (2017-2028) & (US$ Million)
Figure 38. Southeast Asia Online Travel Market Size YoY Growth (2017-2028) & (US$ Million)
Figure 39. India Online Travel Market Size YoY Growth (2017-2028) & (US$ Million)
Figure 40. Australia Online Travel Market Size YoY Growth (2017-2028) & (US$ Million)
List of Figures
Figure 41. Latin America Online Travel Market Size YoY (2017-2028) & (US$ Million)
Figure 42. Latin America Online Travel Market Size Market Share by Type (2017-2028)
Figure 43. Latin America Online Travel Market Size Market Share by Application (2017-2028)
Figure 44. Latin America Online Travel Market Size Share by Country (2017-2028)
Figure 45. Mexico Online Travel Market Size YoY Growth (2017-2028) & (US$ Million)
Figure 46. Brazil Online Travel Market Size YoY Growth (2017-2028) & (US$ Million)
Figure 47. Middle East & Africa Online Travel Market Size YoY (2017-2028) & (US$ Million)
Figure 48. Middle East and Africa Online Travel Market Size Market Share by Type (2017-2028)
Figure 49. Middle East and Africa Online Travel Market Size Market Share by Application (2017-2028)
Figure 50. Middle East and Africa Online Travel Market Size Share by Country (2017-2028)
Figure 51. Turkey Online Travel Market Size YoY Growth (2017-2028) & (US$ Million)
Figure 52. Saudi Arabia Online Travel Market Size YoY Growth (2017-2028) & (US$ Million)
Figure 53. UAE Online Travel Market Size YoY Growth (2017-2028) & (US$ Million)
Figure 54. Expedia Revenue Growth Rate in Online Travel Business (2017-2022)
Figure 55. Priceline Revenue Growth Rate in Online Travel Business (2017-2022)
Figure 56. TripAdvisor Revenue Growth Rate in Online Travel Business (2017-2022)
Figure 57. Ctrip.Com International Revenue Growth Rate in Online Travel Business (2017-2022)
Figure 58. Hostelworld Revenue Growth Rate in Online Travel Business (2017-2022)
Figure 59. Hotel Urbano Revenue Growth Rate in Online Travel Business (2017-2022)
Figure 60. Tourism Revenue Growth Rate in Online Travel Business (2017-2022)
Figure 61. CheapOair.Com Revenue Growth Rate in Online Travel Business (2017-2022)
Figure 62. Trivago Revenue Growth Rate in Online Travel Business (2017-2022)
Figure 63. Thomas Cook Revenue Growth Rate in Online Travel Business (2017-2022)
Figure 64. MakeMyTrip Revenue Growth Rate in Online Travel Business (2017-2022)
Figure 65. AirGorilla Revenue Growth Rate in Online Travel Business (2017-2022)
Figure 66. Hays Travel Revenue Growth Rate in Online Travel Business (2017-2022)
Figure 67. Airbnb Revenue Growth Rate in Online Travel Business (2017-2022)
Figure 68. Yatra Online Revenue Growth Rate in Online Travel Business (2017-2022)
Figure 69. Alibaba Revenue Growth Rate in Online Travel Business (2017-2022)
Figure 70. Tuniu Revenue Growth Rate in Online Travel Business (2017-2022)
Figure 71. Bottom-up and Top-down Approaches for This Report
Figure 72. Data Triangulation
Figure 73. Key Executives Interviewed
$4900
$7350
$9800
