List of Tables
Table 1. Compressed Natural Gas (CNG) Cylinders CAGR in Value, India VS Global, 2018 VS 2022 VS 2029
Table 2. Compressed Natural Gas (CNG) Cylinders Market Trends
Table 3. Compressed Natural Gas (CNG) Cylinders Market Drivers
Table 4. Compressed Natural Gas (CNG) Cylinders Market Challenges
Table 5. Compressed Natural Gas (CNG) Cylinders Market Restraints
Table 6. Global Compressed Natural Gas (CNG) Cylinders Sales Growth Rate (CAGR) by Type: 2018 VS 2022 VS 2029 (US$ Million)
Table 7. India Compressed Natural Gas (CNG) Cylinders Sales Growth Rate (CAGR) by Type: 2018 VS 2022 VS 2029 (US$ Million)
Table 8. Global Compressed Natural Gas (CNG) Cylinders Sales Growth Rate (CAGR) by Application: 2018 VS 2022 VS 2029 (US$ Million)
Table 9. India Compressed Natural Gas (CNG) Cylinders Sales Growth Rate (CAGR) by Application: 2018 VS 2022 VS 2029 (US$ Million)
Table 10. Global Key Manufacturers of Compressed Natural Gas (CNG) Cylinders, Ranked by Revenue (2022) & (US$ Million)
Table 11. Global Compressed Natural Gas (CNG) Cylinders Revenue by Manufacturer, (US$ Million), 2018-2023
Table 12. Global Compressed Natural Gas (CNG) Cylinders Revenue Share by Manufacturer, 2018-2023
Table 13. Global Compressed Natural Gas (CNG) Cylinders Sales by Manufacturer, (K Units), 2018-2023
Table 14. Global Compressed Natural Gas (CNG) Cylinders Sales Share by Manufacturer, 2018-2023
Table 15. Global Compressed Natural Gas (CNG) Cylinders Price by Manufacturer (2018-2023) & (USD/Unit)
Table 16. Global Compressed Natural Gas (CNG) Cylinders Manufacturers Market Concentration Ratio (CR5 and HHI)
Table 17. Global Compressed Natural Gas (CNG) Cylinders by Company Type (Tier 1, Tier 2, and Tier 3) & (based on the Revenue in Compressed Natural Gas (CNG) Cylinders as of 2022)
Table 18. Global Key Manufacturers of Compressed Natural Gas (CNG) Cylinders, Manufacturing Base Distribution and Headquarters
Table 19. Global Key Manufacturers of Compressed Natural Gas (CNG) Cylinders, Product Offered and Application
Table 20. Global Key Manufacturers of Compressed Natural Gas (CNG) Cylinders, Date of Enter into This Industry
Table 21. Manufacturers Mergers & Acquisitions, Expansion Plans
Table 22. Key Players of Compressed Natural Gas (CNG) Cylinders in India, Ranked by Revenue (2022) & (US$ million)
Table 23. India Compressed Natural Gas (CNG) Cylinders Revenue by Players, (US$ Million), (2018-2023)
Table 24. India Compressed Natural Gas (CNG) Cylinders Revenue Share by Players, (2018-2023)
Table 25. India Compressed Natural Gas (CNG) Cylinders Sales by Players, (K Units), (2018-2023)
Table 26. India Compressed Natural Gas (CNG) Cylinders Sales Share by Players, (2018-2023)
Table 27. Global Compressed Natural Gas (CNG) Cylinders Market Size Growth Rate (CAGR) by Region (US$ Million): 2018 VS 2022 VS 2029
Table 28. Global Compressed Natural Gas (CNG) Cylinders Sales in Volume by Region (2018-2023) & (K Units)
Table 29. Global Compressed Natural Gas (CNG) Cylinders Sales in Volume Forecast by Region (2024-2029) & (K Units)
Table 30. Global Compressed Natural Gas (CNG) Cylinders Sales in Value by Region (2018-2023) & (US$ Million)
Table 31. Global Compressed Natural Gas (CNG) Cylinders Sales in Value Forecast by Region (2024-2029) & (US$ Million)
Table 32. Americas Compressed Natural Gas (CNG) Cylinders Market Size Growth Rate (CAGR) by Country (US$ Million): 2018 VS 2022 VS 2029
Table 33. Americas Compressed Natural Gas (CNG) Cylinders Sales in Value by Country (2018-2023) & (US$ Million)
Table 34. Americas Compressed Natural Gas (CNG) Cylinders Sales in Value by Country (2024-2029) & (US$ Million)
Table 35. Americas Compressed Natural Gas (CNG) Cylinders Sales in Volume by Country (2018-2023) & (K Units)
Table 36. Americas Compressed Natural Gas (CNG) Cylinders Sales in Volume by Country (2024-2029) & (K Units)
Table 37. EMEA Compressed Natural Gas (CNG) Cylinders Market Size Growth Rate (CAGR) by Country (US$ Million): 2018 VS 2022 VS 2029
Table 38. EMEA Compressed Natural Gas (CNG) Cylinders Sales in Value by Country (2018-2023) & (US$ Million)
Table 39. EMEA Compressed Natural Gas (CNG) Cylinders Sales in Value by Country (2024-2029) & (US$ Million)
Table 40. EMEA Compressed Natural Gas (CNG) Cylinders Sales in Volume by Country (2018-2023) & (K Units)
Table 41. EMEA Compressed Natural Gas (CNG) Cylinders Sales in Volume by Country (2024-2029) & (K Units)
Table 42. APAC Compressed Natural Gas (CNG) Cylinders Market Size Growth Rate (CAGR) by Country (US$ Million): 2018 VS 2022 VS 2029
Table 43. APAC Compressed Natural Gas (CNG) Cylinders Sales in Value by Country (2018-2023) & (US$ Million)
Table 44. APAC Compressed Natural Gas (CNG) Cylinders Sales in Value by Country (2024-2029) & (US$ Million)
Table 45. APAC Compressed Natural Gas (CNG) Cylinders Sales in Volume by Country (2018-2023) & (K Units)
Table 46. APAC Compressed Natural Gas (CNG) Cylinders Sales in Volume by Country (2024-2029) & (K Units)
Table 47. Sinomatech Company Information
Table 48. Sinomatech Description and Business Overview
Table 49. Sinomatech Compressed Natural Gas (CNG) Cylinders Sales (K Units), Revenue (US$ Million), Price (USD/Unit) and Gross Margin (2018-2023)
Table 50. Sinomatech Compressed Natural Gas (CNG) Cylinders Product
Table 51. Sinomatech Recent Development
Table 52. Everest Kanto Cylinders Company Information
Table 53. Everest Kanto Cylinders Description and Business Overview
Table 54. Everest Kanto Cylinders Compressed Natural Gas (CNG) Cylinders Sales (K Units), Revenue (US$ Million), Price (USD/Unit) and Gross Margin (2018-2023)
Table 55. Everest Kanto Cylinders Compressed Natural Gas (CNG) Cylinders Product
Table 56. Everest Kanto Cylinders Recent Development
Table 57. Worthington Industries Company Information
Table 58. Worthington Industries Description and Business Overview
Table 59. Worthington Industries Compressed Natural Gas (CNG) Cylinders Sales (K Units), Revenue (US$ Million), Price (USD/Unit) and Gross Margin (2018-2023)
Table 60. Worthington Industries Compressed Natural Gas (CNG) Cylinders Product
Table 61. Worthington Industries Recent Development
Table 62. Luxfer Group Company Information
Table 63. Luxfer Group Description and Business Overview
Table 64. Luxfer Group Compressed Natural Gas (CNG) Cylinders Sales (K Units), Revenue (US$ Million), Price (USD/Unit) and Gross Margin (2018-2023)
Table 65. Luxfer Group Compressed Natural Gas (CNG) Cylinders Product
Table 66. Luxfer Group Recent Development
Table 67. Hexagon Composites Company Information
Table 68. Hexagon Composites Description and Business Overview
Table 69. Hexagon Composites Compressed Natural Gas (CNG) Cylinders Sales (K Units), Revenue (US$ Million), Price (USD/Unit) and Gross Margin (2018-2023)
Table 70. Hexagon Composites Compressed Natural Gas (CNG) Cylinders Product
Table 71. Hexagon Composites Recent Development
Table 72. Beijing Tianhai Industry Company Information
Table 73. Beijing Tianhai Industry Description and Business Overview
Table 74. Beijing Tianhai Industry Compressed Natural Gas (CNG) Cylinders Sales (K Units), Revenue (US$ Million), Price (USD/Unit) and Gross Margin (2018-2023)
Table 75. Beijing Tianhai Industry Compressed Natural Gas (CNG) Cylinders Product
Table 76. Beijing Tianhai Industry Recent Development
Table 77. Rama Cylinders Company Information
Table 78. Rama Cylinders Description and Business Overview
Table 79. Rama Cylinders Compressed Natural Gas (CNG) Cylinders Sales (K Units), Revenue (US$ Million), Price (USD/Unit) and Gross Margin (2018-2023)
Table 80. Rama Cylinders Compressed Natural Gas (CNG) Cylinders Product
Table 81. Rama Cylinders Recent Development
Table 82. Quantum Technologies Company Information
Table 83. Quantum Technologies Description and Business Overview
Table 84. Quantum Technologies Compressed Natural Gas (CNG) Cylinders Sales (K Units), Revenue (US$ Million), Price (USD/Unit) and Gross Margin (2018-2023)
Table 85. Quantum Technologies Compressed Natural Gas (CNG) Cylinders Product
Table 86. Quantum Technologies Recent Development
Table 87. Faber Industrie Company Information
Table 88. Faber Industrie Description and Business Overview
Table 89. Faber Industrie Compressed Natural Gas (CNG) Cylinders Sales (K Units), Revenue (US$ Million), Price (USD/Unit) and Gross Margin (2018-2023)
Table 90. Faber Industrie Compressed Natural Gas (CNG) Cylinders Product
Table 91. Faber Industrie Recent Development
Table 92. CIMC ENRIC Company Information
Table 93. CIMC ENRIC Description and Business Overview
Table 94. CIMC ENRIC Compressed Natural Gas (CNG) Cylinders Sales (K Units), Revenue (US$ Million), Price (USD/Unit) and Gross Margin (2018-2023)
Table 95. CIMC ENRIC Compressed Natural Gas (CNG) Cylinders Product
Table 96. CIMC ENRIC Recent Development
Table 97. Avanco Group Company Information
Table 98. Avanco Group Description and Business Overview
Table 99. Avanco Group Compressed Natural Gas (CNG) Cylinders Sales (K Units), Revenue (US$ Million), Price (USD/Unit) and Gross Margin (2018-2023)
Table 100. Avanco Group Compressed Natural Gas (CNG) Cylinders Product
Table 101. Avanco Group Recent Development
Table 102. Key Raw Materials Lists
Table 103. Raw Materials Key Suppliers Lists
Table 104. Compressed Natural Gas (CNG) Cylinders Customers List
Table 105. Compressed Natural Gas (CNG) Cylinders Distributors List
Table 106. Research Programs/Design for This Report
Table 107. Key Data Information from Secondary Sources
Table 108. Key Data Information from Primary Sources
List of Figures
Figure 1. Compressed Natural Gas (CNG) Cylinders Product Picture
Figure 2. Global Compressed Natural Gas (CNG) Cylinders Revenue, (US$ Million), 2018 VS 2022 VS 2029
Figure 3. Global Compressed Natural Gas (CNG) Cylinders Market Size 2018-2029 (US$ Million)
Figure 4. Global Compressed Natural Gas (CNG) Cylinders Sales 2018-2029 (K Units)
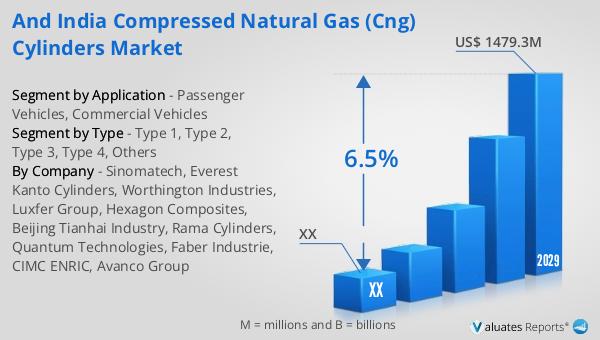
Figure 5. India Compressed Natural Gas (CNG) Cylinders Revenue, (US$ Million), 2018 VS 2022 VS 2029
Figure 6. India Compressed Natural Gas (CNG) Cylinders Market Size 2018-2029 (US$ Million)
Figure 7. India Compressed Natural Gas (CNG) Cylinders Sales 2018-2029 (K Units)
Figure 8. India Compressed Natural Gas (CNG) Cylinders Market Share in Global, in Value (US$ Million) 2018-2029
Figure 9. India Compressed Natural Gas (CNG) Cylinders Market Share in Global, in Volume (K Units) 2018-2029
Figure 10. Compressed Natural Gas (CNG) Cylinders Report Years Considered
Figure 11. Product Picture of Type 1
Figure 12. Product Picture of Type 2
Figure 13. Product Picture of Type 3
Figure 14. Product Picture of Type 4
Figure 15. Product Picture of Others
Figure 16. Global Compressed Natural Gas (CNG) Cylinders Market Share by Type in 2022 & 2029
Figure 17. Global Compressed Natural Gas (CNG) Cylinders Sales in Value by Type (2018-2029) & (US$ Million)
Figure 18. Global Compressed Natural Gas (CNG) Cylinders Sales Market Share in Value by Type (2018-2029)
Figure 19. Global Compressed Natural Gas (CNG) Cylinders Sales by Type (2018-2029) & (K Units)
Figure 20. Global Compressed Natural Gas (CNG) Cylinders Sales Market Share in Volume by Type (2018-2029)
Figure 21. Global Compressed Natural Gas (CNG) Cylinders Price by Type (2018-2029) & (USD/Unit)
Figure 22. India Compressed Natural Gas (CNG) Cylinders Market Share by Type in 2022 & 2029
Figure 23. India Compressed Natural Gas (CNG) Cylinders Sales in Value by Type (2018-2029) & (US$ Million)
Figure 24. India Compressed Natural Gas (CNG) Cylinders Sales Market Share in Value by Type (2018-2029)
Figure 25. India Compressed Natural Gas (CNG) Cylinders Sales by Type (2018-2029) & (K Units)
Figure 26. India Compressed Natural Gas (CNG) Cylinders Sales Market Share in Volume by Type (2018-2029)
Figure 27. India Compressed Natural Gas (CNG) Cylinders Price by Type (2018-2029) & (USD/Unit)
Figure 28. Product Picture of Passenger Vehicles
Figure 29. Product Picture of Commercial Vehicles
Figure 30. Global Compressed Natural Gas (CNG) Cylinders Market Share by Application in 2022 & 2029
Figure 31. Global Compressed Natural Gas (CNG) Cylinders Sales in Value by Application (2018-2029) & (US$ Million)
Figure 32. Global Compressed Natural Gas (CNG) Cylinders Sales Market Share in Value by Application (2018-2029)
Figure 33. Global Compressed Natural Gas (CNG) Cylinders Sales by Application (2018-2029) & (K Units)
Figure 34. Global Compressed Natural Gas (CNG) Cylinders Sales Market Share in Volume by Application (2018-2029)
Figure 35. Global Compressed Natural Gas (CNG) Cylinders Price by Application (2018-2029) & (USD/Unit)
Figure 36. India Compressed Natural Gas (CNG) Cylinders Market Share by Application in 2022 & 2029
Figure 37. India Compressed Natural Gas (CNG) Cylinders Sales in Value by Application (2018-2029) & (US$ Million)
Figure 38. India Compressed Natural Gas (CNG) Cylinders Sales Market Share in Value by Application (2018-2029)
Figure 39. India Compressed Natural Gas (CNG) Cylinders Sales by Application (2018-2029) & (K Units)
Figure 40. India Compressed Natural Gas (CNG) Cylinders Sales Market Share in Volume by Application (2018-2029)
Figure 41. India Compressed Natural Gas (CNG) Cylinders Price by Application (2018-2029) & (USD/Unit)
Figure 42. Americas Compressed Natural Gas (CNG) Cylinders Sales in Volume Growth Rate 2018-2029 (K Units)
Figure 43. Americas Compressed Natural Gas (CNG) Cylinders Sales in Value Growth Rate 2018-2029 (US$ Million)
Figure 44. Americas Compressed Natural Gas (CNG) Cylinders Sales by Type (2018-2029) & (K Units)
Figure 45. Americas Compressed Natural Gas (CNG) Cylinders Sales Market Share in Volume by Type (2018-2029)
Figure 46. Americas Compressed Natural Gas (CNG) Cylinders Sales by Application (2018-2029) & (K Units)
Figure 47. Americas Compressed Natural Gas (CNG) Cylinders Sales Market Share in Volume by Application (2018-2029)
Figure 48. United States Compressed Natural Gas (CNG) Cylinders Sales in Value Growth Rate (2018-2029) & (US$ Million)
Figure 49. Canada Compressed Natural Gas (CNG) Cylinders Sales in Value Growth Rate (2018-2029) & (US$ Million)
Figure 50. Mexico Compressed Natural Gas (CNG) Cylinders Sales in Value Growth Rate (2018-2029) & (US$ Million)
Figure 51. Brazil Compressed Natural Gas (CNG) Cylinders Sales in Value Growth Rate (2018-2029) & (US$ Million)
Figure 52. EMEA Compressed Natural Gas (CNG) Cylinders Sales in Volume Growth Rate 2018-2029 (K Units)
Figure 53. EMEA Compressed Natural Gas (CNG) Cylinders Sales in Value Growth Rate 2018-2029 (US$ Million)
Figure 54. EMEA Compressed Natural Gas (CNG) Cylinders Sales by Type (2018-2029) & (K Units)
Figure 55. EMEA Compressed Natural Gas (CNG) Cylinders Sales Market Share in Volume by Type (2018-2029)
Figure 56. EMEA Compressed Natural Gas (CNG) Cylinders Sales by Application (2018-2029) & (K Units)
Figure 57. EMEA Compressed Natural Gas (CNG) Cylinders Sales Market Share in Volume by Application (2018-2029)
Figure 58. Europe Compressed Natural Gas (CNG) Cylinders Sales in Value Growth Rate (2018-2029) & (US$ Million)
Figure 59. Middle East Compressed Natural Gas (CNG) Cylinders Sales in Value Growth Rate (2018-2029) & (US$ Million)
Figure 60. Africa Compressed Natural Gas (CNG) Cylinders Sales in Value Growth Rate (2018-2029) & (US$ Million)
Figure 61. China Compressed Natural Gas (CNG) Cylinders Sales in Volume Growth Rate 2018-2029 (K Units)
Figure 62. China Compressed Natural Gas (CNG) Cylinders Sales in Value Growth Rate 2018-2029 (US$ Million)
Figure 63. China Compressed Natural Gas (CNG) Cylinders Sales by Type (2018-2029) & (K Units)
Figure 64. China Compressed Natural Gas (CNG) Cylinders Sales Market Share in Volume by Type (2018-2029)
Figure 65. China Compressed Natural Gas (CNG) Cylinders Sales by Application (2018-2029) & (K Units)
Figure 66. China Compressed Natural Gas (CNG) Cylinders Sales Market Share in Volume by Application (2018-2029)
Figure 67. APAC Compressed Natural Gas (CNG) Cylinders Sales in Volume Growth Rate 2018-2029 (K Units)
Figure 68. APAC Compressed Natural Gas (CNG) Cylinders Sales in Value Growth Rate 2018-2029 (US$ Million)
Figure 69. APAC Compressed Natural Gas (CNG) Cylinders Sales by Type (2018-2029) & (K Units)
Figure 70. APAC Compressed Natural Gas (CNG) Cylinders Sales Market Share in Volume by Type (2018-2029)
Figure 71. APAC Compressed Natural Gas (CNG) Cylinders Sales by Application (2018-2029) & (K Units)
Figure 72. APAC Compressed Natural Gas (CNG) Cylinders Sales Market Share in Volume by Application (2018-2029)
Figure 73. Japan Compressed Natural Gas (CNG) Cylinders Sales in Value Growth Rate (2018-2029) & (US$ Million)
Figure 74. South Korea Compressed Natural Gas (CNG) Cylinders Sales in Value Growth Rate (2018-2029) & (US$ Million)
Figure 75. China Taiwan Compressed Natural Gas (CNG) Cylinders Sales in Value Growth Rate (2018-2029) & (US$ Million)
Figure 76. Southeast Asia Compressed Natural Gas (CNG) Cylinders Sales in Value Growth Rate (2018-2029) & (US$ Million)
Figure 77. India Compressed Natural Gas (CNG) Cylinders Sales in Value Growth Rate (2018-2029) & (US$ Million)
Figure 78. Compressed Natural Gas (CNG) Cylinders Value Chain
Figure 79. Compressed Natural Gas (CNG) Cylinders Production Process
Figure 80. Channels of Distribution
Figure 81. Distributors Profiles
Figure 82. Bottom-up and Top-down Approaches for This Report
Figure 83. Data Triangulation
Figure 84. Key Executives Interviewed