1 Market Overview
1.1 Recycled Cobalt Product Introduction
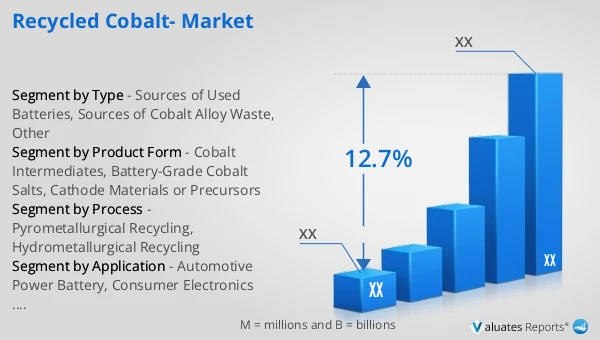
1.2 Global Recycled Cobalt Market Size Forecast
1.2.1 Global Recycled Cobalt Sales Value (2021–2032)
1.2.2 Global Recycled Cobalt Sales Volume (2021–2032)
1.2.3 Global Recycled Cobalt Sales Price (2021–2032)
1.3 Recycled Cobalt Market Trends & Drivers
1.3.1 Recycled Cobalt Industry Trends
1.3.2 Recycled Cobalt Market Drivers & Opportunities
1.3.3 Recycled Cobalt Market Challenges
1.3.4 Recycled Cobalt Market Restraints
1.3.5 Impact of U.S. Tariffs
1.4 Assumptions and Limitations
1.5 Study Objectives
1.6 Years Considered
2 Competitive Analysis by Company
2.1 Global Recycled Cobalt Players Revenue Ranking (2025)
2.2 Global Recycled Cobalt Revenue by Company (2021–2026)
2.3 Global Recycled Cobalt Sales Volume Ranking of Players (2025)
2.4 Global Recycled Cobalt Sales Volume by Company (2021–2026)
2.5 Global Recycled Cobalt Average Price by Company (2021–2026)
2.6 Key Manufacturers Recycled Cobalt Manufacturing Base and Headquarters
2.7 Key Manufacturers Recycled Cobalt Product Offerings
2.8 Key Manufacturers Start of Mass Production of Recycled Cobalt
2.9 Recycled Cobalt Market Competitive Analysis
2.9.1 Recycled Cobalt Market Concentration Rate (2021–2026)
2.9.2 Global 5 and 10 Largest Manufacturers by Recycled Cobalt Revenue in 2025
2.9.3 Global Companies by Tier (Tier 1, Tier 2, Tier 3), based on Recycled Cobalt revenue, 2025
2.10 Mergers & Acquisitions and Expansion
3 Segmentation Recycled Cobalt Market Classification
3.1 Introduction by Type
3.1.1 Sources of Used Batteries
3.1.2 Sources of Cobalt Alloy Waste
3.1.3 Other
3.1.4 Global Recycled Cobalt Sales Value by Type
3.1.4.1 Global Recycled Cobalt Sales Value by Type (2021 vs 2025 vs 2032)
3.1.4.2 Global Recycled Cobalt Sales Value, by Type (2021–2032)
3.1.4.3 Global Recycled Cobalt Sales Value, by Type (%), 2021–2032
3.1.5 Global Recycled Cobalt Sales Volume by Type
3.1.5.1 Global Recycled Cobalt Sales Volume by Type (2021 vs 2025 vs 2032)
3.1.5.2 Global Recycled Cobalt Sales Volume, by Type (2021–2032)
3.1.5.3 Global Recycled Cobalt Sales Volume, by Type (%), 2021–2032
3.1.6 Global Recycled Cobalt Average Price by Type (2021–2032)
3.2 Introduction by Process
3.2.1 Pyrometallurgical Recycling
3.2.2 Hydrometallurgical Recycling
3.2.3 Global Recycled Cobalt Sales Value by Process
3.2.3.1 Global Recycled Cobalt Sales Value by Process (2021 vs 2025 vs 2032)
3.2.3.2 Global Recycled Cobalt Sales Value, by Process (2021–2032)
3.2.3.3 Global Recycled Cobalt Sales Value, by Process (%), 2021–2032
3.2.4 Global Recycled Cobalt Sales Volume by Process
3.2.4.1 Global Recycled Cobalt Sales Volume by Process (2021 vs 2025 vs 2032)
3.2.4.2 Global Recycled Cobalt Sales Volume, by Process (2021–2032)
3.2.4.3 Global Recycled Cobalt Sales Volume, by Process (%), 2021–2032
3.2.5 Global Recycled Cobalt Average Price by Process (2021–2032)
3.3 Introduction by Product Form
3.3.1 Cobalt Intermediates
3.3.2 Battery-Grade Cobalt Salts
3.3.3 Cathode Materials or Precursors
3.3.4 Global Recycled Cobalt Sales Value by Product Form
3.3.4.1 Global Recycled Cobalt Sales Value by Product Form (2021 vs 2025 vs 2032)
3.3.4.2 Global Recycled Cobalt Sales Value, by Product Form (2021–2032)
3.3.4.3 Global Recycled Cobalt Sales Value, by Product Form (%), 2021–2032
3.3.5 Global Recycled Cobalt Sales Volume by Product Form
3.3.5.1 Global Recycled Cobalt Sales Volume by Product Form (2021 vs 2025 vs 2032)
3.3.5.2 Global Recycled Cobalt Sales Volume, by Product Form (2021–2032)
3.3.5.3 Global Recycled Cobalt Sales Volume, by Product Form (%), 2021–2032
3.3.6 Global Recycled Cobalt Average Price by Product Form (2021–2032)
4 Segmentation by Application
4.1 Introduction by Application
4.1.1 Automotive Power Battery
4.1.2 Consumer Electronics Battery
4.1.3 Alloy
4.1.4 Other
4.2 Global Recycled Cobalt Sales Value by Application
4.2.1 Global Recycled Cobalt Sales Value by Application (2021 vs 2025 vs 2032)
4.2.2 Global Recycled Cobalt Sales Value, by Application (2021–2032)
4.2.3 Global Recycled Cobalt Sales Value, by Application (%), 2021–2032
4.3 Global Recycled Cobalt Sales Volume by Application
4.3.1 Global Recycled Cobalt Sales Volume by Application (2021 vs 2025 vs 2032)
4.3.2 Global Recycled Cobalt Sales Volume, by Application (2021–2032)
4.3.3 Global Recycled Cobalt Sales Volume, by Application (%), 2021–2032
4.4 Global Recycled Cobalt Average Price by Application (2021–2032)
5 Segmentation by Region
5.1 Global Recycled Cobalt Sales Value by Region
5.1.1 Global Recycled Cobalt Sales Value by Region: 2021 vs 2025 vs 2032
5.1.2 Global Recycled Cobalt Sales Value by Region (2021–2026)
5.1.3 Global Recycled Cobalt Sales Value by Region (2027–2032)
5.1.4 Global Recycled Cobalt Sales Value by Region (%), 2021–2032
5.2 Global Recycled Cobalt Sales Volume by Region
5.2.1 Global Recycled Cobalt Sales Volume by Region: 2021 vs 2025 vs 2032
5.2.2 Global Recycled Cobalt Sales Volume by Region (2021–2026)
5.2.3 Global Recycled Cobalt Sales Volume by Region (2027–2032)
5.2.4 Global Recycled Cobalt Sales Volume by Region (%), 2021–2032
5.3 Global Recycled Cobalt Average Price by Region (2021–2032)
5.4 North America
5.4.1 North America Recycled Cobalt Sales Value, 2021–2032
5.4.2 North America Recycled Cobalt Sales Value by Country (%), 2025 vs 2032
5.5 Europe
5.5.1 Europe Recycled Cobalt Sales Value, 2021–2032
5.5.2 Europe Recycled Cobalt Sales Value by Country (%), 2025 vs 2032
5.6 Asia Pacific
5.6.1 Asia Pacific Recycled Cobalt Sales Value, 2021–2032
5.6.2 Asia Pacific Recycled Cobalt Sales Value by Region (%), 2025 vs 2032
5.7 South America
5.7.1 South America Recycled Cobalt Sales Value, 2021–2032
5.7.2 South America Recycled Cobalt Sales Value by Country (%), 2025 vs 2032
5.8 Middle East & Africa
5.8.1 Middle East & Africa Recycled Cobalt Sales Value, 2021–2032
5.8.2 Middle East & Africa Recycled Cobalt Sales Value by Country (%), 2025 vs 2032
6 Segmentation by Key Countries/Regions
6.1 Key Countries/Regions Recycled Cobalt Sales Value Growth Trends, 2021 vs 2025 vs 2032
6.2 Key Countries/Regions Recycled Cobalt Sales Value and Sales Volume
6.2.1 Key Countries/Regions Recycled Cobalt Sales Value, 2021–2032
6.2.2 Key Countries/Regions Recycled Cobalt Sales Volume, 2021–2032
6.3 United States
6.3.1 United States Recycled Cobalt Sales Value, 2021–2032
6.3.2 United States Recycled Cobalt Sales Value by Type (%), 2025 vs 2032
6.3.3 United States Recycled Cobalt Sales Value by Application, 2025 vs 2032
6.4 Europe
6.4.1 Europe Recycled Cobalt Sales Value, 2021–2032
6.4.2 Europe Recycled Cobalt Sales Value by Type (%), 2025 vs 2032
6.4.3 Europe Recycled Cobalt Sales Value by Application, 2025 vs 2032
6.5 China
6.5.1 China Recycled Cobalt Sales Value, 2021–2032
6.5.2 China Recycled Cobalt Sales Value by Type (%), 2025 vs 2032
6.5.3 China Recycled Cobalt Sales Value by Application, 2025 vs 2032
6.6 Japan
6.6.1 Japan Recycled Cobalt Sales Value, 2021–2032
6.6.2 Japan Recycled Cobalt Sales Value by Type (%), 2025 vs 2032
6.6.3 Japan Recycled Cobalt Sales Value by Application, 2025 vs 2032
6.7 South Korea
6.7.1 South Korea Recycled Cobalt Sales Value, 2021–2032
6.7.2 South Korea Recycled Cobalt Sales Value by Type (%), 2025 vs 2032
6.7.3 South Korea Recycled Cobalt Sales Value by Application, 2025 vs 2032
6.8 Southeast Asia
6.8.1 Southeast Asia Recycled Cobalt Sales Value, 2021–2032
6.8.2 Southeast Asia Recycled Cobalt Sales Value by Type (%), 2025 vs 2032
6.8.3 Southeast Asia Recycled Cobalt Sales Value by Application, 2025 vs 2032
6.9 India
6.9.1 India Recycled Cobalt Sales Value, 2021–2032
6.9.2 India Recycled Cobalt Sales Value by Type (%), 2025 vs 2032
6.9.3 India Recycled Cobalt Sales Value by Application, 2025 vs 2032
7 Company Profiles
7.1 GEM Co.,Ltd
7.1.1 GEM Co.,Ltd Company Information
7.1.2 GEM Co.,Ltd Introduction and Business Overview
7.1.3 GEM Co.,Ltd Recycled Cobalt Sales, Revenue, Price and Gross Margin (2021–2026)
7.1.4 GEM Co.,Ltd Recycled Cobalt Product Offerings
7.1.5 GEM Co.,Ltd Recent Developments
7.2 Huayou Holding Group
7.2.1 Huayou Holding Group Company Information
7.2.2 Huayou Holding Group Introduction and Business Overview
7.2.3 Huayou Holding Group Recycled Cobalt Sales, Revenue, Price and Gross Margin (2021–2026)
7.2.4 Huayou Holding Group Recycled Cobalt Product Offerings
7.2.5 Huayou Holding Group Recent Developments
7.3 CNGR Advanced Material
7.3.1 CNGR Advanced Material Company Information
7.3.2 CNGR Advanced Material Introduction and Business Overview
7.3.3 CNGR Advanced Material Recycled Cobalt Sales, Revenue, Price and Gross Margin (2021–2026)
7.3.4 CNGR Advanced Material Recycled Cobalt Product Offerings
7.3.5 CNGR Advanced Material Recent Developments
7.4 BRUNP RECYCLING
7.4.1 BRUNP RECYCLING Company Information
7.4.2 BRUNP RECYCLING Introduction and Business Overview
7.4.3 BRUNP RECYCLING Recycled Cobalt Sales, Revenue, Price and Gross Margin (2021–2026)
7.4.4 BRUNP RECYCLING Recycled Cobalt Product Offerings
7.4.5 BRUNP RECYCLING Recent Developments
7.5 Miracle Automation Engineering
7.5.1 Miracle Automation Engineering Company Information
7.5.2 Miracle Automation Engineering Introduction and Business Overview
7.5.3 Miracle Automation Engineering Recycled Cobalt Sales, Revenue, Price and Gross Margin (2021–2026)
7.5.4 Miracle Automation Engineering Recycled Cobalt Product Offerings
7.5.5 Miracle Automation Engineering Recent Developments
7.6 Redwood Materials
7.6.1 Redwood Materials Company Information
7.6.2 Redwood Materials Introduction and Business Overview
7.6.3 Redwood Materials Recycled Cobalt Sales, Revenue, Price and Gross Margin (2021–2026)
7.6.4 Redwood Materials Recycled Cobalt Product Offerings
7.6.5 Redwood Materials Recent Developments
7.7 Umicore
7.7.1 Umicore Company Information
7.7.2 Umicore Introduction and Business Overview
7.7.3 Umicore Recycled Cobalt Sales, Revenue, Price and Gross Margin (2021–2026)
7.7.4 Umicore Recycled Cobalt Product Offerings
7.7.5 Umicore Recent Developments
7.8 Guangdong Guanghua Sci-Tech
7.8.1 Guangdong Guanghua Sci-Tech Company Information
7.8.2 Guangdong Guanghua Sci-Tech Introduction and Business Overview
7.8.3 Guangdong Guanghua Sci-Tech Recycled Cobalt Sales, Revenue, Price and Gross Margin (2021–2026)
7.8.4 Guangdong Guanghua Sci-Tech Recycled Cobalt Product Offerings
7.8.5 Guangdong Guanghua Sci-Tech Recent Developments
7.9 Ganzhou Highpower Technology
7.9.1 Ganzhou Highpower Technology Company Information
7.9.2 Ganzhou Highpower Technology Introduction and Business Overview
7.9.3 Ganzhou Highpower Technology Recycled Cobalt Sales, Revenue, Price and Gross Margin (2021–2026)
7.9.4 Ganzhou Highpower Technology Recycled Cobalt Product Offerings
7.9.5 Ganzhou Highpower Technology Recent Developments
7.10 TES
7.10.1 TES Company Information
7.10.2 TES Introduction and Business Overview
7.10.3 TES Recycled Cobalt Sales, Revenue, Price and Gross Margin (2021–2026)
7.10.4 TES Recycled Cobalt Product Offerings
7.10.5 TES Recent Developments
8 Industry Chain Analysis
8.1 Recycled Cobalt Industrial Chain
8.2 Recycled Cobalt Upstream Analysis
8.2.1 Key Raw Materials
8.2.2 Key Suppliers of Raw Materials
8.2.3 Manufacturing Cost Structure
8.3 Midstream Analysis
8.4 Downstream Analysis (Customer Analysis)
8.5 Sales Model and Sales Channelss
8.5.1 Recycled Cobalt Sales Model
8.5.2 Sales Channels
8.5.3 Recycled Cobalt Distributors
9 Research Findings and Conclusion
10 Appendix
10.1 Research Methodology
10.1.1 Methodology/Research Approach
10.1.1.1 Research Programs/Design
10.1.1.2 Market Size Estimation
10.1.1.3 Market Breakdown and Data Triangulation
10.1.2 Data Source
10.1.2.1 Secondary Sources
10.1.2.2 Primary Sources
10.2 Author Details
10.3 Disclaimer