List of Tables
Table 1. Global Fresh Produce Testing Service Market Size Growth Rate by Type (US$ Million): 2021 vs 2025 vs 2032
Table 2. Key Players of Microbiological Testing
Table 3. Key Players of Nutritional Analysis
Table 4. Key Players of Molecular & Traceability Testing
Table 5. Global Fresh Produce Testing Service Market Size Growth Rate by Technology (US$ Million): 2021 vs 2025 vs 2032
Table 6. Key Players of Routine Sample Submission Testing
Table 7. Key Players of Rapid Testing
Table 8. Key Players of On-site Rapid Screening
Table 9. Key Players of On-site Monitoring Service
Table 10. Global Fresh Produce Testing Service Market Size Growth by Application (US$ Million): 2021 vs 2025 vs 2032
Table 11. Global Fresh Produce Testing Service Market Size by Region (US$ Million): 2021 vs 2025 vs 2032
Table 12. Global Fresh Produce Testing Service Market Size by Region (US$ Million), 2021–2026
Table 13. Global Fresh Produce Testing Service Market Share by Region (2021–2026)
Table 14. Global Fresh Produce Testing Service Forecasted Market Size by Region (US$ Million), 2027–2032
Table 15. Global Fresh Produce Testing Service Market Share by Region (2027–2032)
Table 16. Fresh Produce Testing Service Market Trends
Table 17. Fresh Produce Testing Service Market Drivers
Table 18. Fresh Produce Testing Service Market Challenges
Table 19. Fresh Produce Testing Service Market Restraints
Table 20. Global Fresh Produce Testing Service Revenue by Players (US$ Million), 2021–2026
Table 21. Global Fresh Produce Testing Service Market Share by Players (2021–2026)
Table 22. Global Top Fresh Produce Testing Service Players by Tier (Tier 1, Tier 2, and Tier 3), based on Fresh Produce Testing Service Revenue, 2025
Table 23. Ranking of Global Top Fresh Produce Testing Service Companies by Revenue (US$ Million) in 2025
Table 24. Global 5 Largest Players Market Share by Fresh Produce Testing Service Revenue (CR5 and HHI), 2021–2026
Table 25. Global Key Players of Fresh Produce Testing Service, Headquarters and Area Served
Table 26. Global Key Players of Fresh Produce Testing Service, Products and Applications
Table 27. Global Key Players of Fresh Produce Testing Service, Date of General Availability (GA)
Table 28. Mergers and Acquisitions, Expansion Plans
Table 29. Global Fresh Produce Testing Service Market Size by Type (US$ Million), 2021–2026
Table 30. Global Fresh Produce Testing Service Revenue Market Share by Type (2021–2026)
Table 31. Global Fresh Produce Testing Service Forecasted Market Size by Type (US$ Million), 2027–2032
Table 32. Global Fresh Produce Testing Service Revenue Market Share by Type (2027–2032)
Table 33. Global Fresh Produce Testing Service Market Size by Application (US$ Million), 2021–2026
Table 34. Global Fresh Produce Testing Service Revenue Market Share by Application (2021–2026)
Table 35. Global Fresh Produce Testing Service Forecasted Market Size by Application (US$ Million), 2027–2032
Table 36. Global Fresh Produce Testing Service Revenue Market Share by Application (2027–2032)
Table 37. North America Fresh Produce Testing Service Market Size Growth Rate by Country (US$ Million): 2021 vs 2025 vs 2032
Table 38. North America Fresh Produce Testing Service Market Size by Country (US$ Million), 2021–2026
Table 39. North America Fresh Produce Testing Service Market Size by Country (US$ Million), 2027–2032
Table 40. Europe Fresh Produce Testing Service Market Size Growth Rate by Country (US$ Million): 2021 vs 2025 vs 2032
Table 41. Europe Fresh Produce Testing Service Market Size by Country (US$ Million), 2021–2026
Table 42. Europe Fresh Produce Testing Service Market Size by Country (US$ Million), 2027–2032
Table 43. Asia-Pacific Fresh Produce Testing Service Market Size Growth Rate by Region (US$ Million): 2021 vs 2025 vs 2032
Table 44. Asia-Pacific Fresh Produce Testing Service Market Size by Region (US$ Million), 2021–2026
Table 45. Asia-Pacific Fresh Produce Testing Service Market Size by Region (US$ Million), 2027–2032
Table 46. Latin America Fresh Produce Testing Service Market Size Growth Rate by Country (US$ Million): 2021 vs 2025 vs 2032
Table 47. Latin America Fresh Produce Testing Service Market Size by Country (US$ Million), 2021–2026
Table 48. Latin America Fresh Produce Testing Service Market Size by Country (US$ Million), 2027–2032
Table 49. Middle East & Africa Fresh Produce Testing Service Market Size Growth Rate by Country (US$ Million): 2021 vs 2025 vs 2032
Table 50. Middle East & Africa Fresh Produce Testing Service Market Size by Country (US$ Million), 2021–2026
Table 51. Middle East & Africa Fresh Produce Testing Service Market Size by Country (US$ Million), 2027–2032
Table 52. Eurofins Scientific SE (Listed, Luxembourg) Company Details
Table 53. Eurofins Scientific SE (Listed, Luxembourg) Business Overview
Table 54. Eurofins Scientific SE (Listed, Luxembourg) Fresh Produce Testing Service Product
Table 55. Eurofins Scientific SE (Listed, Luxembourg) Revenue in Fresh Produce Testing Service Business (US$ Million), 2021–2026
Table 56. Eurofins Scientific SE (Listed, Luxembourg) Recent Development
Table 57. SGS SA (Listed, Geneva Switzerland) Company Details
Table 58. SGS SA (Listed, Geneva Switzerland) Business Overview
Table 59. SGS SA (Listed, Geneva Switzerland) Fresh Produce Testing Service Product
Table 60. SGS SA (Listed, Geneva Switzerland) Revenue in Fresh Produce Testing Service Business (US$ Million), 2021–2026
Table 61. SGS SA (Listed, Geneva Switzerland) Recent Development
Table 62. Bureau Veritas SA (Listed, Paris France) Company Details
Table 63. Bureau Veritas SA (Listed, Paris France) Business Overview
Table 64. Bureau Veritas SA (Listed, Paris France) Fresh Produce Testing Service Product
Table 65. Bureau Veritas SA (Listed, Paris France) Revenue in Fresh Produce Testing Service Business (US$ Million), 2021–2026
Table 66. Bureau Veritas SA (Listed, Paris France) Recent Development
Table 67. Intertek Group plc (Listed, London UK) Company Details
Table 68. Intertek Group plc (Listed, London UK) Business Overview
Table 69. Intertek Group plc (Listed, London UK) Fresh Produce Testing Service Product
Table 70. Intertek Group plc (Listed, London UK) Revenue in Fresh Produce Testing Service Business (US$ Million), 2021–2026
Table 71. Intertek Group plc (Listed, London UK) Recent Development
Table 72. ALS Limited (Listed, Brisbane Australia) Company Details
Table 73. ALS Limited (Listed, Brisbane Australia) Business Overview
Table 74. ALS Limited (Listed, Brisbane Australia) Fresh Produce Testing Service Product
Table 75. ALS Limited (Listed, Brisbane Australia) Revenue in Fresh Produce Testing Service Business (US$ Million), 2021–2026
Table 76. ALS Limited (Listed, Brisbane Australia) Recent Development
Table 77. Mérieux NutriSciences Corporation (Unlisted, Chicago USA) Company Details
Table 78. Mérieux NutriSciences Corporation (Unlisted, Chicago USA) Business Overview
Table 79. Mérieux NutriSciences Corporation (Unlisted, Chicago USA) Fresh Produce Testing Service Product
Table 80. Mérieux NutriSciences Corporation (Unlisted, Chicago USA) Revenue in Fresh Produce Testing Service Business (US$ Million), 2021–2026
Table 81. Mérieux NutriSciences Corporation (Unlisted, Chicago USA) Recent Development
Table 82. NSF International (Unlisted, Michigan USA) Company Details
Table 83. NSF International (Unlisted, Michigan USA) Business Overview
Table 84. NSF International (Unlisted, Michigan USA) Fresh Produce Testing Service Product
Table 85. NSF International (Unlisted, Michigan USA) Revenue in Fresh Produce Testing Service Business (US$ Million), 2021–2026
Table 86. NSF International (Unlisted, Michigan USA) Recent Development
Table 87. AsureQuality Limited (Unlisted, Auckland New Zealand) Company Details
Table 88. AsureQuality Limited (Unlisted, Auckland New Zealand) Business Overview
Table 89. AsureQuality Limited (Unlisted, Auckland New Zealand) Fresh Produce Testing Service Product
Table 90. AsureQuality Limited (Unlisted, Auckland New Zealand) Revenue in Fresh Produce Testing Service Business (US$ Million), 2021–2026
Table 91. AsureQuality Limited (Unlisted, Auckland New Zealand) Recent Development
Table 92. Microbac Laboratories, Inc. (Unlisted, Pittsburgh USA) Company Details
Table 93. Microbac Laboratories, Inc. (Unlisted, Pittsburgh USA) Business Overview
Table 94. Microbac Laboratories, Inc. (Unlisted, Pittsburgh USA) Fresh Produce Testing Service Product
Table 95. Microbac Laboratories, Inc. (Unlisted, Pittsburgh USA) Revenue in Fresh Produce Testing Service Business (US$ Million), 2021–2026
Table 96. Microbac Laboratories, Inc. (Unlisted, Pittsburgh USA) Recent Development
Table 97. IEH Laboratories & Consulting Group (Unlisted, Seattle USA) Company Details
Table 98. IEH Laboratories & Consulting Group (Unlisted, Seattle USA) Business Overview
Table 99. IEH Laboratories & Consulting Group (Unlisted, Seattle USA) Fresh Produce Testing Service Product
Table 100. IEH Laboratories & Consulting Group (Unlisted, Seattle USA) Revenue in Fresh Produce Testing Service Business (US$ Million), 2021–2026
Table 101. IEH Laboratories & Consulting Group (Unlisted, Seattle USA) Recent Development
Table 102. Symbio Laboratories Pty Ltd (Unlisted, Sydney Australia) Company Details
Table 103. Symbio Laboratories Pty Ltd (Unlisted, Sydney Australia) Business Overview
Table 104. Symbio Laboratories Pty Ltd (Unlisted, Sydney Australia) Fresh Produce Testing Service Product
Table 105. Symbio Laboratories Pty Ltd (Unlisted, Sydney Australia) Revenue in Fresh Produce Testing Service Business (US$ Million), 2021–2026
Table 106. Symbio Laboratories Pty Ltd (Unlisted, Sydney Australia) Recent Development
Table 107. Fera Science Ltd. (Unlisted, York UK) Company Details
Table 108. Fera Science Ltd. (Unlisted, York UK) Business Overview
Table 109. Fera Science Ltd. (Unlisted, York UK) Fresh Produce Testing Service Product
Table 110. Fera Science Ltd. (Unlisted, York UK) Revenue in Fresh Produce Testing Service Business (US$ Million), 2021–2026
Table 111. Fera Science Ltd. (Unlisted, York UK) Recent Development
Table 112. Control Union Certifications (Unlisted, Zwolle Netherlands) Company Details
Table 113. Control Union Certifications (Unlisted, Zwolle Netherlands) Business Overview
Table 114. Control Union Certifications (Unlisted, Zwolle Netherlands) Fresh Produce Testing Service Product
Table 115. Control Union Certifications (Unlisted, Zwolle Netherlands) Revenue in Fresh Produce Testing Service Business (US$ Million), 2021–2026
Table 116. Control Union Certifications (Unlisted, Zwolle Netherlands) Recent Development
Table 117. QIMA Ltd. (Unlisted, Hong Kong China) Company Details
Table 118. QIMA Ltd. (Unlisted, Hong Kong China) Business Overview
Table 119. QIMA Ltd. (Unlisted, Hong Kong China) Fresh Produce Testing Service Product
Table 120. QIMA Ltd. (Unlisted, Hong Kong China) Revenue in Fresh Produce Testing Service Business (US$ Million), 2021–2026
Table 121. QIMA Ltd. (Unlisted, Hong Kong China) Recent Development
Table 122. China Testing & Certification International Group(Listed, Shenzhen China) Company Details
Table 123. China Testing & Certification International Group(Listed, Shenzhen China) Business Overview
Table 124. China Testing & Certification International Group(Listed, Shenzhen China) Fresh Produce Testing Service Product
Table 125. China Testing & Certification International Group(Listed, Shenzhen China) Revenue in Fresh Produce Testing Service Business (US$ Million), 2021–2026
Table 126. China Testing & Certification International Group(Listed, Shenzhen China) Recent Development
Table 127. Pony Testing (Listed, Beijing China) Company Details
Table 128. Pony Testing (Listed, Beijing China) Business Overview
Table 129. Pony Testing (Listed, Beijing China) Fresh Produce Testing Service Product
Table 130. Pony Testing (Listed, Beijing China) Revenue in Fresh Produce Testing Service Business (US$ Million), 2021–2026
Table 131. Pony Testing (Listed, Beijing China) Recent Development
Table 132. CCIC (Unlisted, Beijing China) Company Details
Table 133. CCIC (Unlisted, Beijing China) Business Overview
Table 134. CCIC (Unlisted, Beijing China) Fresh Produce Testing Service Product
Table 135. CCIC (Unlisted, Beijing China) Revenue in Fresh Produce Testing Service Business (US$ Million), 2021–2026
Table 136. CCIC (Unlisted, Beijing China) Recent Development
Table 137. Neogen Corporation (Listed, Michigan USA) Company Details
Table 138. Neogen Corporation (Listed, Michigan USA) Business Overview
Table 139. Neogen Corporation (Listed, Michigan USA) Fresh Produce Testing Service Product
Table 140. Neogen Corporation (Listed, Michigan USA) Revenue in Fresh Produce Testing Service Business (US$ Million), 2021–2026
Table 141. Neogen Corporation (Listed, Michigan USA) Recent Development
Table 142. Campden BRI (Unlisted, Chipping Campden UK) Company Details
Table 143. Campden BRI (Unlisted, Chipping Campden UK) Business Overview
Table 144. Campden BRI (Unlisted, Chipping Campden UK) Fresh Produce Testing Service Product
Table 145. Campden BRI (Unlisted, Chipping Campden UK) Revenue in Fresh Produce Testing Service Business (US$ Million), 2021–2026
Table 146. Campden BRI (Unlisted, Chipping Campden UK) Recent Development
Table 147. FoodChain ID (Unlisted Iowa USA) Company Details
Table 148. FoodChain ID (Unlisted Iowa USA) Business Overview
Table 149. FoodChain ID (Unlisted Iowa USA) Fresh Produce Testing Service Product
Table 150. FoodChain ID (Unlisted Iowa USA) Revenue in Fresh Produce Testing Service Business (US$ Million), 2021–2026
Table 151. FoodChain ID (Unlisted Iowa USA) Recent Development
Table 152. Element Materials Technology (Unlisted, London UK) Company Details
Table 153. Element Materials Technology (Unlisted, London UK) Business Overview
Table 154. Element Materials Technology (Unlisted, London UK) Fresh Produce Testing Service Product
Table 155. Element Materials Technology (Unlisted, London UK) Revenue in Fresh Produce Testing Service Business (US$ Million), 2021–2026
Table 156. Element Materials Technology (Unlisted, London UK) Recent Development
Table 157. QTS Analytical Services (Unlisted, County Durham UK) Company Details
Table 158. QTS Analytical Services (Unlisted, County Durham UK) Business Overview
Table 159. QTS Analytical Services (Unlisted, County Durham UK) Fresh Produce Testing Service Product
Table 160. QTS Analytical Services (Unlisted, County Durham UK) Revenue in Fresh Produce Testing Service Business (US$ Million), 2021–2026
Table 161. QTS Analytical Services (Unlisted, County Durham UK) Recent Development
Table 162. Research Programs/Design for This Report
Table 163. Key Data Information from Secondary Sources
Table 164. Key Data Information from Primary Sources
Table 165. Authors List of This Report
List of Figures
Figure 1. Fresh Produce Testing Service Picture
Figure 2. Global Fresh Produce Testing Service Market Size Comparison by Type (US$ Million), 2021–2032
Figure 3. Global Fresh Produce Testing Service Market Share by Type: 2025 vs 2032
Figure 4. Microbiological Testing Features
Figure 5. Nutritional Analysis Features
Figure 6. Molecular & Traceability Testing Features
Figure 7. Global Fresh Produce Testing Service Market Size Comparison by Technology (US$ Million), 2021–2032
Figure 8. Routine Sample Submission Testing Features
Figure 9. Rapid Testing Features
Figure 10. On-site Rapid Screening Features
Figure 11. On-site Monitoring Service Features
Figure 12. Global Fresh Produce Testing Service Market Size by Application (US$ Million), 2021–2032
Figure 13. Global Fresh Produce Testing Service Market Share by Application: 2025 vs 2032
Figure 14. Fresh Fruit Case Studies
Figure 15. Fresh Vegetable Case Studies
Figure 16. Other Case Studies
Figure 17. Fresh Produce Testing Service Report Years Considered
Figure 18. Global Fresh Produce Testing Service Market Size (US$ Million), Year-over-Year: 2021–2032
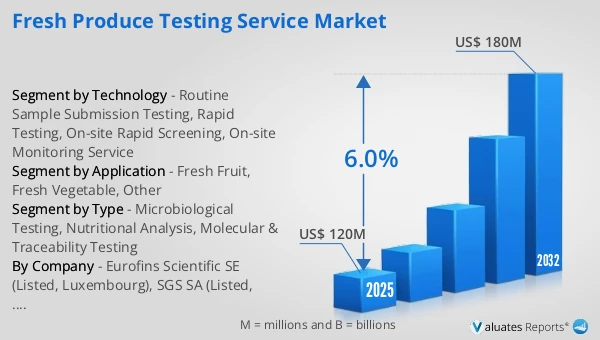
Figure 19. Global Fresh Produce Testing Service Market Size, (US$ Million), 2021 vs 2025 vs 2032
Figure 20. Global Fresh Produce Testing Service Market Share by Region: 2025 vs 2032
Figure 21. Global Fresh Produce Testing Service Market Share by Players in 2025
Figure 22. Global Fresh Produce Testing Service Market Share by Company Type (Tier 1, Tier 2, and Tier 3)
Figure 23. The Top 10 and 5 Players Market Share by Fresh Produce Testing Service Revenue in 2025
Figure 24. North America Fresh Produce Testing Service Market Size YoY Growth (US$ Million), 2021–2032
Figure 25. North America Fresh Produce Testing Service Market Share by Country (2021–2032)
Figure 26. United States Fresh Produce Testing Service Market Size YoY Growth (US$ Million), 2021–2032
Figure 27. Canada Fresh Produce Testing Service Market Size YoY Growth (US$ Million), 2021–2032
Figure 28. Europe Fresh Produce Testing Service Market Size YoY Growth (US$ Million), 2021–2032
Figure 29. Europe Fresh Produce Testing Service Market Share by Country (2021–2032)
Figure 30. Germany Fresh Produce Testing Service Market Size YoY Growth (US$ Million), 2021–2032
Figure 31. France Fresh Produce Testing Service Market Size YoY Growth (US$ Million), 2021–2032
Figure 32. U.K. Fresh Produce Testing Service Market Size YoY Growth (US$ Million), 2021–2032
Figure 33. Italy Fresh Produce Testing Service Market Size YoY Growth (US$ Million), 2021–2032
Figure 34. Russia Fresh Produce Testing Service Market Size YoY Growth (US$ Million), 2021–2032
Figure 35. Ireland Fresh Produce Testing Service Market Size YoY Growth (US$ Million), 2021–2032
Figure 36. Asia-Pacific Fresh Produce Testing Service Market Size YoY Growth (US$ Million), 2021–2032
Figure 37. Asia-Pacific Fresh Produce Testing Service Market Share by Region (2021–2032)
Figure 38. China Fresh Produce Testing Service Market Size YoY Growth (US$ Million), 2021–2032
Figure 39. Japan Fresh Produce Testing Service Market Size YoY Growth (US$ Million), 2021–2032
Figure 40. South Korea Fresh Produce Testing Service Market Size YoY Growth (US$ Million), 2021–2032
Figure 41. Southeast Asia Fresh Produce Testing Service Market Size YoY Growth (US$ Million), 2021–2032
Figure 42. India Fresh Produce Testing Service Market Size YoY Growth (US$ Million), 2021–2032
Figure 43. Australia & New Zealand Fresh Produce Testing Service Market Size YoY Growth (US$ Million), 2021–2032
Figure 44. Latin America Fresh Produce Testing Service Market Size YoY Growth (US$ Million), 2021–2032
Figure 45. Latin America Fresh Produce Testing Service Market Share by Country (2021–2032)
Figure 46. Mexico Fresh Produce Testing Service Market Size YoY Growth (US$ Million), 2021–2032
Figure 47. Brazil Fresh Produce Testing Service Market Size YoY Growth (US$ Million), 2021–2032
Figure 48. Middle East & Africa Fresh Produce Testing Service Market Size YoY Growth (US$ Million), 2021–2032
Figure 49. Middle East & Africa Fresh Produce Testing Service Market Share by Country (2021–2032)
Figure 50. Israel Fresh Produce Testing Service Market Size YoY Growth (US$ Million), 2021–2032
Figure 51. Saudi Arabia Fresh Produce Testing Service Market Size YoY Growth (US$ Million), 2021–2032
Figure 52. UAE Fresh Produce Testing Service Market Size YoY Growth (US$ Million), 2021–2032
Figure 53. Eurofins Scientific SE (Listed, Luxembourg) Revenue Growth Rate in Fresh Produce Testing Service Business (2021–2026)
Figure 54. SGS SA (Listed, Geneva Switzerland) Revenue Growth Rate in Fresh Produce Testing Service Business (2021–2026)
Figure 55. Bureau Veritas SA (Listed, Paris France) Revenue Growth Rate in Fresh Produce Testing Service Business (2021–2026)
Figure 56. Intertek Group plc (Listed, London UK) Revenue Growth Rate in Fresh Produce Testing Service Business (2021–2026)
Figure 57. ALS Limited (Listed, Brisbane Australia) Revenue Growth Rate in Fresh Produce Testing Service Business (2021–2026)
Figure 58. Mérieux NutriSciences Corporation (Unlisted, Chicago USA) Revenue Growth Rate in Fresh Produce Testing Service Business (2021–2026)
Figure 59. NSF International (Unlisted, Michigan USA) Revenue Growth Rate in Fresh Produce Testing Service Business (2021–2026)
Figure 60. AsureQuality Limited (Unlisted, Auckland New Zealand) Revenue Growth Rate in Fresh Produce Testing Service Business (2021–2026)
Figure 61. Microbac Laboratories, Inc. (Unlisted, Pittsburgh USA) Revenue Growth Rate in Fresh Produce Testing Service Business (2021–2026)
Figure 62. IEH Laboratories & Consulting Group (Unlisted, Seattle USA) Revenue Growth Rate in Fresh Produce Testing Service Business (2021–2026)
Figure 63. Symbio Laboratories Pty Ltd (Unlisted, Sydney Australia) Revenue Growth Rate in Fresh Produce Testing Service Business (2021–2026)
Figure 64. Fera Science Ltd. (Unlisted, York UK) Revenue Growth Rate in Fresh Produce Testing Service Business (2021–2026)
Figure 65. Control Union Certifications (Unlisted, Zwolle Netherlands) Revenue Growth Rate in Fresh Produce Testing Service Business (2021–2026)
Figure 66. QIMA Ltd. (Unlisted, Hong Kong China) Revenue Growth Rate in Fresh Produce Testing Service Business (2021–2026)
Figure 67. China Testing & Certification International Group(Listed, Shenzhen China) Revenue Growth Rate in Fresh Produce Testing Service Business (2021–2026)
Figure 68. Pony Testing (Listed, Beijing China) Revenue Growth Rate in Fresh Produce Testing Service Business (2021–2026)
Figure 69. CCIC (Unlisted, Beijing China) Revenue Growth Rate in Fresh Produce Testing Service Business (2021–2026)
Figure 70. Neogen Corporation (Listed, Michigan USA) Revenue Growth Rate in Fresh Produce Testing Service Business (2021–2026)
Figure 71. Campden BRI (Unlisted, Chipping Campden UK) Revenue Growth Rate in Fresh Produce Testing Service Business (2021–2026)
Figure 72. FoodChain ID (Unlisted Iowa USA) Revenue Growth Rate in Fresh Produce Testing Service Business (2021–2026)
Figure 73. Element Materials Technology (Unlisted, London UK) Revenue Growth Rate in Fresh Produce Testing Service Business (2021–2026)
Figure 74. QTS Analytical Services (Unlisted, County Durham UK) Revenue Growth Rate in Fresh Produce Testing Service Business (2021–2026)
Figure 75. Bottom-up and Top-down Approaches for This Report
Figure 76. Data Triangulation
Figure 77. Key Executives Interviewed