
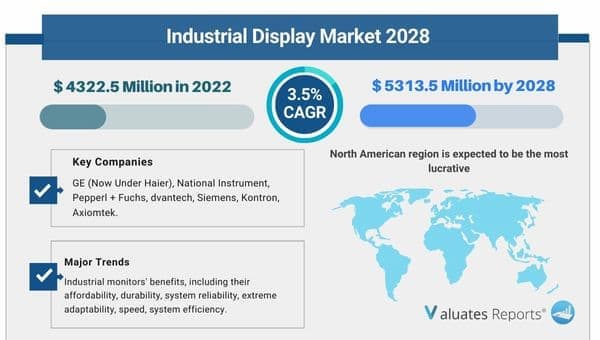
Due to the COVID-19 pandemic, the global Industrial Display market size is estimated to be worth USD 4322.5 Million in 2022 and is forecast to a readjusted size of USD 5313.5 Million by 2028 with a CAGR of 3.5% during the forecast period 2022-2028.
An industrial display is a display used in an industrial control process or device. Its main difference with the civilian or commercial display is the shell design is generally more endurable than the common display used in the civilian or commercial fields, the type of materials used to make these panels are divided into ordinary iron, stainless steel, aluminum and many others. There are also special designs, like industrial-grade LCD screen, is specifically engineered to cater to the higher environmental requirements, these industrial-grade LCD screen can tolerate a very wide temperature range, -40 to 85 Celsius degrees, only a few foreign manufacturers produce such displays, the price is, therefore more expensive. The degree of protection of industrial displays is indicated by IP **, the first one being the dust-proof rating and the second being the waterproof rating. Dustproof rating up to 6, waterproof up to 8.
Fully considering the economic change by this health crisis, Rugged Displays accounting for % of the Industrial Display global market in 2021, is projected to value US$ million by 2028, growing at a revised % CAGR from 2022 to 2028. While HMI segment is altered to an % CAGR throughout this forecast period.
The LCD technology accounted for the largest share of the overall industrial display market in 2017. Products such flat-panel displays, desktop monitors, industrial PCs, and some video walls are using LCD technology. This is responsible for driving the this market.
The research report has incorporated the analysis of different factors that augment the market’s growth. It constitutes trends, restraints, and drivers that transform the market in either a positive or negative manner. This section also provides the scope of different segments and applications that can potentially influence the market in the future. The detailed information is based on current trends and historic milestones. This section also provides an analysis of the volume of production about the global market and about each type from 2017 to 2028. This section mentions the volume of production by region from 2017 to 2028. Pricing analysis is included in the report according to each type from the year 2017 to 2028, manufacturer from 2017 to 2022, region from 2017 to 2022, and global price from 2017 to 2028.
A thorough evaluation of the restrains included in the report portrays the contrast to drivers and gives room for strategic planning. Factors that overshadow the market growth are pivotal as they can be understood to devise different bends for getting hold of the lucrative opportunities that are present in the ever-growing market. Additionally, insights into market expert’s opinions have been taken to understand the market better.
The readers in the section will understand how the Industrial Display market scenario changed across the globe during the pandemic and post-pandemic. The study is done keeping in view the changes in aspects such as production, demand, consumption, supply chain. The industry experts have also highlighted the key factors that will help create opportunities for players and stabilize the overall industry in the years to come.
Key segments including type and application have been elaborated in this report. The consultants at QY Research have studied every segment and provided the market size using historical data. They have also talked about the growth opportunities that the segment may pose in the future. This study bestows production and revenue data by type and application during the historical period (2017-2022) and forecast period (2023-2028).
This section of the report provides key insights regarding various regions and the key players operating in each region. Economic, social, environmental, technological, and political factors have been taken into consideration while assessing the growth of the particular region/country. The readers will also get their hands on the revenue and production data of each region and country for the period 2017-2028. This information derived through comprehensive research will help the reader to get familiar with the potential value of the investment in a particular region.
|
Report Metric |
Details |
|
Report Name |
Industrial Display Market |
|
Market size value in 2022 |
USD 4322.5 Million |
|
Revenue forecast in 2028 |
USD 5313.5 Million |
|
Growth Rate |
3.5% |
|
Base year considered |
2022 |
|
Forecast Period |
2022-2028 |
|
By Type |
Rugged Displays, Open Frame Displays, Panel-mount Displays, Marine Displays, Video Walls |
|
By Application |
HMI, Remote Monitoring, Interactive Display (Kiosk), Imaging, Digital Signage |
|
Report Coverage |
Revenue & volume forecast, company share, competitive landscape, growth factors, and trends |
|
Segments Covered |
By Type, Application, and Region |
|
Geographic Regions Covered |
North America, Europe, Asia Pacific, Latin America, Middle East & Africa |
Ans. Due to the COVID-19 pandemic, the global Industrial Display market size is estimated to be worth USD 4322.5 Million in 2022 and is forecast to a readjusted size of USD 5313.5 Million by 2028 with a CAGR of 3.5% during the forecast period 2022-2028.
Ans. Some of the Major companies are GE (Now Under Haier), National Instrument, Pepperl + Fuchs, dvantech, Siemens, Kontron, Axiomtek, Aaeon, Allen-Bradley, Red Lion
Ans. Yes, the report includes a COVID-19 impact analysis. Also, it is further extended into every individual segment of the report.
1 Industrial Display Market Overview
1.1 Product Overview and Scope of Industrial Display
1.2 Industrial Display Segment by Type
1.2.1 Global Industrial Display Market Size Growth Rate Analysis by Type 2022 VS 2028
1.2.2 Rugged Displays
1.2.3 Open Frame Displays
1.2.4 Panel-mount Displays
1.2.5 Marine Displays
1.2.6 Video Walls
1.3 Industrial Display Segment by Application
1.3.1 Global Industrial Display Consumption Comparison by Application: 2022 VS 2028
1.3.2 HMI
1.3.3 Remote Monitoring
1.3.4 Interactive Display (Kiosk)
1.3.5 Digital Signage
1.3.6 Imaging
1.4 Global Market Growth Prospects
1.4.1 Global Industrial Display Revenue Estimates and Forecasts (2017-2028)
1.4.2 Global Industrial Display Production Estimates and Forecasts (2017-2028)
1.5 Global Market Size by Region
1.5.1 Global Industrial Display Market Size Estimates and Forecasts by Region: 2017 VS 2021 VS 2028
1.5.2 North America Industrial Display Estimates and Forecasts (2017-2028)
1.5.3 Europe Industrial Display Estimates and Forecasts (2017-2028)
1.5.4 China Industrial Display Estimates and Forecasts (2017-2028)
1.5.5 Japan Industrial Display Estimates and Forecasts (2017-2028)
2 Market Competition by Manufacturers
2.1 Global Industrial Display Production Market Share by Manufacturers (2017-2022)
2.2 Global Industrial Display Revenue Market Share by Manufacturers (2017-2022)
2.3 Industrial Display Market Share by Company Type (Tier 1, Tier 2 and Tier 3)
2.4 Global Industrial Display Average Price by Manufacturers (2017-2022)
2.5 Manufacturers Industrial Display Production Sites, Area Served, Product Types
2.6 Industrial Display Market Competitive Situation and Trends
2.6.1 Industrial Display Market Concentration Rate
2.6.2 Global 5 and 10 Largest Industrial Display Players Market Share by Revenue
2.6.3 Mergers & Acquisitions, Expansion
3 Production by Region
3.1 Global Production of Industrial Display Market Share by Region (2017-2022)
3.2 Global Industrial Display Revenue Market Share by Region (2017-2022)
3.3 Global Industrial Display Production, Revenue, Price and Gross Margin (2017-2022)
3.4 North America Industrial Display Production
3.4.1 North America Industrial Display Production Growth Rate (2017-2022)
3.4.2 North America Industrial Display Production, Revenue, Price and Gross Margin (2017-2022)
3.5 Europe Industrial Display Production
3.5.1 Europe Industrial Display Production Growth Rate (2017-2022)
3.5.2 Europe Industrial Display Production, Revenue, Price and Gross Margin (2017-2022)
3.6 China Industrial Display Production
3.6.1 China Industrial Display Production Growth Rate (2017-2022)
3.6.2 China Industrial Display Production, Revenue, Price and Gross Margin (2017-2022)
3.7 Japan Industrial Display Production
3.7.1 Japan Industrial Display Production Growth Rate (2017-2022)
3.7.2 Japan Industrial Display Production, Revenue, Price and Gross Margin (2017-2022)
4 Global Industrial Display Consumption by Region
4.1 Global Industrial Display Consumption by Region
4.1.1 Global Industrial Display Consumption by Region
4.1.2 Global Industrial Display Consumption Market Share by Region
4.2 North America
4.2.1 North America Industrial Display Consumption by Country
4.2.2 U.S.
4.2.3 Canada
4.3 Europe
4.3.1 Europe Industrial Display Consumption by Country
4.3.2 Germany
4.3.3 France
4.3.4 U.K.
4.3.5 Italy
4.3.6 Russia
4.4 Asia Pacific
4.4.1 Asia Pacific Industrial Display Consumption by Region
4.4.2 China
4.4.3 Japan
4.4.4 South Korea
4.4.5 China Taiwan
4.4.6 Southeast Asia
4.4.7 India
4.4.8 Australia
4.5 Latin America
4.5.1 Latin America Industrial Display Consumption by Country
4.5.2 Mexico
4.5.3 Brazil
5 Segment by Type
5.1 Global Industrial Display Production Market Share by Type (2017-2022)
5.2 Global Industrial Display Revenue Market Share by Type (2017-2022)
5.3 Global Industrial Display Price by Type (2017-2022)
6 Segment by Application
6.1 Global Industrial Display Production Market Share by Application (2017-2022)
6.2 Global Industrial Display Revenue Market Share by Application (2017-2022)
6.3 Global Industrial Display Price by Application (2017-2022)
7 Key Companies Profiled
7.1 GE (Now Under Haier)
7.1.1 GE (Now Under Haier) Industrial Display Corporation Information
7.1.2 GE (Now Under Haier) Industrial Display Product Portfolio
7.1.3 GE (Now Under Haier) Industrial Display Production, Revenue, Price and Gross Margin (2017-2022)
7.1.4 GE (Now Under Haier) Main Business and Markets Served
7.1.5 GE (Now Under Haier) Recent Developments/Updates
7.2 National Instrument
7.2.1 National Instrument Industrial Display Corporation Information
7.2.2 National Instrument Industrial Display Product Portfolio
7.2.3 National Instrument Industrial Display Production, Revenue, Price and Gross Margin (2017-2022)
7.2.4 National Instrument Main Business and Markets Served
7.2.5 National Instrument Recent Developments/Updates
7.3 Pepperl + Fuchs
7.3.1 Pepperl + Fuchs Industrial Display Corporation Information
7.3.2 Pepperl + Fuchs Industrial Display Product Portfolio
7.3.3 Pepperl + Fuchs Industrial Display Production, Revenue, Price and Gross Margin (2017-2022)
7.3.4 Pepperl + Fuchs Main Business and Markets Served
7.3.5 Pepperl + Fuchs Recent Developments/Updates
7.4 Advantech
7.4.1 Advantech Industrial Display Corporation Information
7.4.2 Advantech Industrial Display Product Portfolio
7.4.3 Advantech Industrial Display Production, Revenue, Price and Gross Margin (2017-2022)
7.4.4 Advantech Main Business and Markets Served
7.4.5 Advantech Recent Developments/Updates
7.5 Siemens
7.5.1 Siemens Industrial Display Corporation Information
7.5.2 Siemens Industrial Display Product Portfolio
7.5.3 Siemens Industrial Display Production, Revenue, Price and Gross Margin (2017-2022)
7.5.4 Siemens Main Business and Markets Served
7.5.5 Siemens Recent Developments/Updates
7.6 Kontron
7.6.1 Kontron Industrial Display Corporation Information
7.6.2 Kontron Industrial Display Product Portfolio
7.6.3 Kontron Industrial Display Production, Revenue, Price and Gross Margin (2017-2022)
7.6.4 Kontron Main Business and Markets Served
7.6.5 Kontron Recent Developments/Updates
7.7 Axiomtek
7.7.1 Axiomtek Industrial Display Corporation Information
7.7.2 Axiomtek Industrial Display Product Portfolio
7.7.3 Axiomtek Industrial Display Production, Revenue, Price and Gross Margin (2017-2022)
7.7.4 Axiomtek Main Business and Markets Served
7.7.5 Axiomtek Recent Developments/Updates
7.8 Aaeon
7.8.1 Aaeon Industrial Display Corporation Information
7.8.2 Aaeon Industrial Display Product Portfolio
7.8.3 Aaeon Industrial Display Production, Revenue, Price and Gross Margin (2017-2022)
7.8.4 Aaeon Main Business and Markets Served
7.7.5 Aaeon Recent Developments/Updates
7.9 Allen-Bradley
7.9.1 Allen-Bradley Industrial Display Corporation Information
7.9.2 Allen-Bradley Industrial Display Product Portfolio
7.9.3 Allen-Bradley Industrial Display Production, Revenue, Price and Gross Margin (2017-2022)
7.9.4 Allen-Bradley Main Business and Markets Served
7.9.5 Allen-Bradley Recent Developments/Updates
7.10 Red Lion
7.10.1 Red Lion Industrial Display Corporation Information
7.10.2 Red Lion Industrial Display Product Portfolio
7.10.3 Red Lion Industrial Display Production, Revenue, Price and Gross Margin (2017-2022)
7.10.4 Red Lion Main Business and Markets Served
7.10.5 Red Lion Recent Developments/Updates
7.11 Yuda
7.11.1 Yuda Industrial Display Corporation Information
7.11.2 Yuda Industrial Display Product Portfolio
7.11.3 Yuda Industrial Display Production, Revenue, Price and Gross Margin (2017-2022)
7.11.4 Yuda Main Business and Markets Served
7.11.5 Yuda Recent Developments/Updates
7.12 Sparton
7.12.1 Sparton Industrial Display Corporation Information
7.12.2 Sparton Industrial Display Product Portfolio
7.12.3 Sparton Industrial Display Production, Revenue, Price and Gross Margin (2017-2022)
7.12.4 Sparton Main Business and Markets Served
7.12.5 Sparton Recent Developments/Updates
7.13 HIS
7.13.1 HIS Industrial Display Corporation Information
7.13.2 HIS Industrial Display Product Portfolio
7.13.3 HIS Industrial Display Production, Revenue, Price and Gross Margin (2017-2022)
7.13.4 HIS Main Business and Markets Served
7.13.5 HIS Recent Developments/Updates
8 Industrial Display Manufacturing Cost Analysis
8.1 Industrial Display Key Raw Materials Analysis
8.1.1 Key Raw Materials
8.1.2 Key Suppliers of Raw Materials
8.2 Proportion of Manufacturing Cost Structure
8.3 Manufacturing Process Analysis of Industrial Display
8.4 Industrial Display Industrial Chain Analysis
9 Marketing Channel, Distributors and Customers
9.1 Marketing Channel
9.2 Industrial Display Distributors List
9.3 Industrial Display Customers
10 Market Dynamics
10.1 Industrial Display Industry Trends
10.2 Industrial Display Market Drivers
10.3 Industrial Display Market Challenges
10.4 Industrial Display Market Restraints
11 Production and Supply Forecast
11.1 Global Forecasted Production of Industrial Display by Region (2023-2028)
11.2 North America Industrial Display Production, Revenue Forecast (2023-2028)
11.3 Europe Industrial Display Production, Revenue Forecast (2023-2028)
11.4 China Industrial Display Production, Revenue Forecast (2023-2028)
11.5 Japan Industrial Display Production, Revenue Forecast (2023-2028)
12 Consumption and Demand Forecast
12.1 Global Forecasted Demand Analysis of Industrial Display
12.2 North America Forecasted Consumption of Industrial Display by Country
12.3 Europe Market Forecasted Consumption of Industrial Display by Country
12.4 Asia Pacific Market Forecasted Consumption of Industrial Display by Region
12.5 Latin America Forecasted Consumption of Industrial Display by Country
13 Forecast by Type and by Application (2023-2028)
13.1 Global Production, Revenue and Price Forecast by Type (2023-2028)
13.1.1 Global Forecasted Production of Industrial Display by Type (2023-2028)
13.1.2 Global Forecasted Revenue of Industrial Display by Type (2023-2028)
13.1.3 Global Forecasted Price of Industrial Display by Type (2023-2028)
13.2 Global Forecasted Consumption of Industrial Display by Application (2023-2028)
13.2.1 Global Forecasted Production of Industrial Display by Application (2023-2028)
13.2.2 Global Forecasted Revenue of Industrial Display by Application (2023-2028)
13.2.3 Global Forecasted Price of Industrial Display by Application (2023-2028)
14 Research Finding and Conclusion
15 Methodology and Data Source
15.1 Methodology/Research Approach
15.1.1 Research Programs/Design
15.1.2 Market Size Estimation
15.1.3 Market Breakdown and Data Triangulation
15.2 Data Source
15.2.1 Secondary Sources
15.2.2 Primary Sources
15.3 Author List
15.4 Disclaimer
List of Tables
Table 1. Global Industrial Display Market Size by Type (K Units) & (US$ Million) (2022 VS 2028)
Table 2. Global Industrial Display Market Size by Application (K Units) & (US$ Million) (2022 VS 2028)
Table 3. Industrial Display Market Size Comparison by Region: 2017 VS 2021 VS 2028
Table 4. Global Industrial Display Production by Manufacturers (2017-2022) & (K Units)
Table 5. Global Industrial Display Production (K Units) by Manufacturers (2017-2022)
Table 6. Global Industrial Display Production Market Share by Manufacturers (2017-2022)
Table 7. Global Industrial Display Revenue by Manufacturers (2017-2022) & (US$ Million)
Table 8. Global Industrial Display Revenue Share by Manufacturers (2017-2022)
Table 9. Company Type (Tier 1, Tier 2 and Tier 3) & (based on the Revenue in Industrial Display as of 2021)
Table 10. Global Market Industrial Display Average Price (USD/Unit) of Key Manufacturers (2017-2022)
Table 11. Manufacturers Industrial Display Production Sites and Area Served
Table 12. Manufacturers Industrial Display Product Types
Table 13. Global Industrial Display Manufacturers Market Concentration Ratio (CR5 and HHI)
Table 14. Mergers & Acquisitions, Expansion
Table 15. Global Industrial Display Production (K Units) by Region (2017-2022)
Table 16. Global Industrial Display Revenue (US$ Million) by Region (2017-2022)
Table 17. Global Industrial Display Revenue Market Share by Region (2017-2022)
Table 18. Global Industrial Display Production (K Units), Revenue (US$ Million), Price (USD/Unit) and Gross Margin (2017-2022)
Table 19. North America Industrial Display Production (K Units), Revenue (US$ Million), Price (USD/Unit) and Gross Margin (2017-2022)
Table 20. Europe Industrial Display Production (K Units), Revenue (US$ Million), Price (USD/Unit) and Gross Margin (2017-2022)
Table 21. China Industrial Display Production (K Units), Revenue (US$ Million), Price (USD/Unit) and Gross Margin (2017-2022)
Table 22. Japan Industrial Display Production (K Units), Revenue (US$ Million), Price (USD/Unit) and Gross Margin (2017-2022)
Table 23. Global Industrial Display Consumption Market by Region (2017-2022) & (K Units)
Table 24. Global Industrial Display Consumption Market Share by Region (2017-2022)
Table 25. North America Industrial Display Consumption by Country (2017-2022) & (K Units)
Table 26. Europe Industrial Display Consumption by Country (2017-2022) & (K Units)
Table 27. Asia Pacific Industrial Display Consumption by Region (2017-2022) & (K Units)
Table 28. Latin America Industrial Display Consumption by Country (2017-2022) & (K Units)
Table 29. Global Industrial Display Production (K Units) by Type (2017-2022)
Table 30. Global Industrial Display Production Market Share by Type (2017-2022)
Table 31. Global Industrial Display Revenue (US$ Million) by Type (2017-2022)
Table 32. Global Industrial Display Revenue Share by Type (2017-2022)
Table 33. Global Industrial Display Price (USD/Unit) by Type (2017-2022)
Table 34. Global Industrial Display Production by Application (2017-2022) & (K Units)
Table 35. Global Industrial Display Production Market Share by Application (2017-2022)
Table 36. Global Industrial Display Revenue (US$ Million) by Application (2017-2022)
Table 37. Global Industrial Display Revenue Share by Application (2017-2022)
Table 38. Global Industrial Display Price (USD/Unit) by Application (2017-2022)
Table 39. GE (Now Under Haier) Industrial Display Corporation Information
Table 40. GE (Now Under Haier) Specification and Application
Table 41. GE (Now Under Haier) Industrial Display Production (K Units), Revenue (US$ Million), Price (USD/Unit) and Gross Margin (2017-2022)
Table 42. GE (Now Under Haier) Main Business and Markets Served
Table 43. GE (Now Under Haier) Recent Developments/Updates
Table 44. National Instrument Industrial Display Corporation Information
Table 45. National Instrument Specification and Application
Table 46. National Instrument Industrial Display Production (K Units), Revenue (US$ Million), Price (USD/Unit) and Gross Margin (2017-2022)
Table 47. National Instrument Main Business and Markets Served
Table 48. National Instrument Recent Developments/Updates
Table 49. Pepperl + Fuchs Industrial Display Corporation Information
Table 50. Pepperl + Fuchs Specification and Application
Table 51. Pepperl + Fuchs Industrial Display Production (K Units), Revenue (US$ Million), Price (USD/Unit) and Gross Margin (2017-2022)
Table 52. Pepperl + Fuchs Main Business and Markets Served
Table 53. Pepperl + Fuchs Recent Developments/Updates
Table 54. Advantech Industrial Display Corporation Information
Table 55. Advantech Specification and Application
Table 56. Advantech Industrial Display Production (K Units), Revenue (US$ Million), Price (USD/Unit) and Gross Margin (2017-2022)
Table 57. Advantech Main Business and Markets Served
Table 58. Advantech Recent Developments/Updates
Table 59. Siemens Industrial Display Corporation Information
Table 60. Siemens Specification and Application
Table 61. Siemens Industrial Display Production (K Units), Revenue (US$ Million), Price (USD/Unit) and Gross Margin (2017-2022)
Table 62. Siemens Main Business and Markets Served
Table 63. Siemens Recent Developments/Updates
Table 64. Kontron Industrial Display Corporation Information
Table 65. Kontron Specification and Application
Table 66. Kontron Industrial Display Production (K Units), Revenue (US$ Million), Price (USD/Unit) and Gross Margin (2017-2022)
Table 67. Kontron Main Business and Markets Served
Table 68. Kontron Recent Developments/Updates
Table 69. Axiomtek Industrial Display Corporation Information
Table 70. Axiomtek Specification and Application
Table 71. Axiomtek Industrial Display Production (K Units), Revenue (US$ Million), Price (USD/Unit) and Gross Margin (2017-2022)
Table 72. Axiomtek Main Business and Markets Served
Table 73. Axiomtek Recent Developments/Updates
Table 74. Aaeon Industrial Display Corporation Information
Table 75. Aaeon Specification and Application
Table 76. Aaeon Industrial Display Production (K Units), Revenue (US$ Million), Price (USD/Unit) and Gross Margin (2017-2022)
Table 77. Aaeon Main Business and Markets Served
Table 78. Aaeon Recent Developments/Updates
Table 79. Allen-Bradley Industrial Display Corporation Information
Table 80. Allen-Bradley Specification and Application
Table 81. Allen-Bradley Industrial Display Production (K Units), Revenue (US$ Million), Price (USD/Unit) and Gross Margin (2017-2022)
Table 82. Allen-Bradley Main Business and Markets Served
Table 83. Allen-Bradley Recent Developments/Updates
Table 84. Red Lion Industrial Display Corporation Information
Table 85. Red Lion Specification and Application
Table 86. Red Lion Industrial Display Production (K Units), Revenue (US$ Million), Price (USD/Unit) and Gross Margin (2017-2022)
Table 87. Red Lion Main Business and Markets Served
Table 88. Red Lion Recent Developments/Updates
Table 89. Yuda Industrial Display Corporation Information
Table 90. Yuda Specification and Application
Table 91. Yuda Industrial Display Production (K Units), Revenue (US$ Million), Price (USD/Unit) and Gross Margin (2017-2022)
Table 92. Yuda Main Business and Markets Served
Table 93. Yuda Recent Developments/Updates
Table 94. Sparton Industrial Display Corporation Information
Table 95. Sparton Specification and Application
Table 96. Sparton Industrial Display Production (K Units), Revenue (US$ Million), Price (USD/Unit) and Gross Margin (2017-2022)
Table 97. Sparton Main Business and Markets Served
Table 98. Sparton Recent Developments/Updates
Table 99. HIS Industrial Display Corporation Information
Table 100. HIS Specification and Application
Table 101. HIS Industrial Display Production (K Units), Revenue (US$ Million), Price (USD/Unit) and Gross Margin (2017-2022)
Table 102. HIS Main Business and Markets Served
Table 103. HIS Recent Developments/Updates
Table 104. Production Base and Market Concentration Rate of Raw Material
Table 105. Key Suppliers of Raw Materials
Table 106. Industrial Display Distributors List
Table 107. Industrial Display Customers List
Table 108. Industrial Display Market Trends
Table 109. Industrial Display Market Drivers
Table 110. Industrial Display Market Challenges
Table 111. Industrial Display Market Restraints
Table 112. Global Industrial Display Production (K Units) Forecast by Region (2023-2028)
Table 113. North America Industrial Display Consumption Forecast by Country (2023-2028) & (K Units)
Table 114. Europe Industrial Display Consumption Forecast by Country (2023-2028) & (K Units)
Table 115. Asia Pacific Industrial Display Consumption Forecast by Region (2023-2028) & (K Units)
Table 116. Latin America Industrial Display Consumption Forecast by Country (2023-2028) & (K Units)
Table 117. Global Industrial Display Production Forecast by Type (2023-2028) & (K Units)
Table 118. Global Industrial Display Revenue Forecast by Type (2023-2028) & (US$ Million)
Table 119. Global Industrial Display Price Forecast by Type (2023-2028) & (USD/Unit)
Table 120. Global Industrial Display Production Forecast by Application (2023-2028) & (K Units)
Table 121. Global Industrial Display Revenue Forecast by Application (2023-2028) & (US$ Million)
Table 122. Global Industrial Display Price Forecast by Application (2023-2028) & (USD/Unit)
Table 123. Research Programs/Design for This Report
Table 124. Key Data Information from Secondary Sources
Table 125. Key Data Information from Primary Sources
List of Figures
Figure 1. Product Picture of Industrial Display
Figure 2. Global Industrial Display Market Share by Type: 2022 VS 2028
Figure 3. Rugged Displays Product Picture
Figure 4. Open Frame Displays Product Picture
Figure 5. Panel-mount Displays Product Picture
Figure 6. Marine Displays Product Picture
Figure 7. Video Walls Product Picture
Figure 8. Global Industrial Display Market Share by Application: 2022 VS 2028
Figure 9. HMI
Figure 10. Remote Monitoring
Figure 11. Interactive Display (Kiosk)
Figure 12. Digital Signage
Figure 13. Imaging
Figure 14. Global Industrial Display Revenue (US$ Million), 2017 VS 2021 VS 2028
Figure 15. Global Industrial Display Revenue (US$ Million) (2017-2028)
Figure 16. Global Industrial Display Production (K Units) & (2017-2028)
Figure 17. North America Industrial Display Revenue (US$ Million) and Growth Rate (2017-2028)
Figure 18. Europe Industrial Display Revenue (US$ Million) and Growth Rate (2017-2028)
Figure 19. China Industrial Display Revenue (US$ Million) and Growth Rate (2017-2028)
Figure 20. Japan Industrial Display Revenue (US$ Million) and Growth Rate (2017-2028)
Figure 21. Industrial Display Production Share by Manufacturers in 2021
Figure 22. Global Industrial Display Revenue Share by Manufacturers in 2021
Figure 23. Industrial Display Market Share by Company Type (Tier 1, Tier 2 and Tier 3): 2017 VS 2021
Figure 24. Global Market Industrial Display Average Price (USD/Unit) of Key Manufacturers in 2021
Figure 25. The Global 5 and 10 Largest Players: Market Share by Industrial Display Revenue in 2021
Figure 26. Global Industrial Display Production Market Share by Region (2017-2022)
Figure 27. North America Industrial Display Production (K Units) Growth Rate (2017-2022)
Figure 28. Europe Industrial Display Production (K Units) Growth Rate (2017-2022)
Figure 29. China Industrial Display Production (K Units) Growth Rate (2017-2022)
Figure 30. Japan Industrial Display Production (K Units) Growth Rate (2017-2022)
Figure 31. Global Industrial Display Consumption Market Share by Region (2017-2022)
Figure 32. North America Industrial Display Consumption and Growth Rate (2017-2022) & (K Units)
Figure 33. North America Industrial Display Consumption Market Share by Country in 2021
Figure 34. Canada Industrial Display Consumption Growth Rate (2017-2022) & (K Units)
Figure 35. U.S. Industrial Display Consumption Growth Rate (2017-2022) & (K Units)
Figure 36. Europe Industrial Display Consumption Growth Rate (2017-2022) & (K Units)
Figure 37. Europe Industrial Display Consumption Market Share by Country in 2021
Figure 38. Germany Industrial Display Consumption and Growth Rate (2017-2022) & (K Units)
Figure 39. France Industrial Display Consumption and Growth Rate (2017-2022) & (K Units)
Figure 40. U.K. Industrial Display Consumption and Growth Rate (2017-2022) & (K Units)
Figure 41. Italy Industrial Display Consumption and Growth Rate (2017-2022) & (K Units)
Figure 42. Russia Industrial Display Consumption and Growth Rate (2017-2022) & (K Units)
Figure 43. Asia Pacific Industrial Display Consumption and Growth Rate (2017-2022) & (K Units)
Figure 44. Asia Pacific Industrial Display Consumption Market Share by Regions in 2021
Figure 45. China Industrial Display Consumption and Growth Rate (2017-2022) & (K Units)
Figure 46. Japan Industrial Display Consumption and Growth Rate (2017-2022) & (K Units)
Figure 47. South Korea Industrial Display Consumption and Growth Rate (2017-2022) & (K Units)
Figure 48. China Taiwan Industrial Display Consumption and Growth Rate (2017-2022) & (K Units)
Figure 49. Southeast Asia Industrial Display Consumption and Growth Rate (2017-2022) & (K Units)
Figure 50. India Industrial Display Consumption and Growth Rate (2017-2022) & (K Units)
Figure 51. Australia Industrial Display Consumption and Growth Rate (2017-2022) & (K Units)
Figure 52. Latin America Industrial Display Consumption and Growth Rate (2017-2022) & (K Units)
Figure 53. Latin America Industrial Display Consumption Market Share by Country in 2021
Figure 54. Mexico Industrial Display Consumption and Growth Rate (2017-2022) & (K Units)
Figure 55. Brazil Industrial Display Consumption and Growth Rate (2017-2022) & (K Units)
Figure 56. Production Market Share of Industrial Display by Type (2017-2022)
Figure 57. Production Market Share of Industrial Display by Type in 2021
Figure 58. Revenue Share of Industrial Display by Type (2017-2022)
Figure 59. Revenue Market Share of Industrial Display by Type in 2021
Figure 60. Production Market Share of Industrial Display by Application (2017-2022)
Figure 61. Production Market Share of Industrial Display by Application in 2021
Figure 62. Revenue Share of Industrial Display by Application (2017-2022)
Figure 63. Revenue Market Share of Industrial Display by Application in 2021
Figure 64. Manufacturing Cost Structure of Industrial Display
Figure 65. Manufacturing Process Analysis of Industrial Display
Figure 66. Industrial Display Industrial Chain Analysis
Figure 67. Channels of Distribution
Figure 68. Distributors Profiles
Figure 69. Global Industrial Display Production Market Share Forecast by Region (2023-2028)
Figure 70. North America Industrial Display Production (K Units) Growth Rate Forecast (2023-2028)
Figure 71. Europe Industrial Display Production (K Units) Growth Rate Forecast (2023-2028)
Figure 72. China Industrial Display Production (K Units) Growth Rate Forecast (2023-2028)
Figure 73. Japan Industrial Display Production (K Units) Growth Rate Forecast (2023-2028)
Figure 74. Global Forecasted Demand Analysis of Industrial Display (2017-2028) & (K Units)
Figure 75. Global Industrial Display Production Market Share Forecast by Type (2023-2028)
Figure 76. Global Industrial Display Revenue Market Share Forecast by Type (2023-2028)
Figure 77. Global Industrial Display Production Market Share Forecast by Application (2023-2028)
Figure 78. Global Industrial Display Revenue Market Share Forecast by Application (2023-2028)
Figure 79. Bottom-up and Top-down Approaches for This Report
Figure 80. Data Triangulation
$2900
$5800
HAVE A QUERY?
OUR CUSTOMER
