0
U.S. (TOLL FREE)
+1 (315) 215-3225
Automative

0
U.S. (TOLL FREE)
+1 (315) 215-3225
GERD Drug and Devices - Global Market Share and Ranking, Overall Sales and Demand Forecast 2024-2030
Published Date: December 2024
|
Report Code: QYRE-Auto-39Z10060
Home | Market Reports | Business & Industrial| Pharmaceuticals & Biotech
Global GERD Drug and Devices Market Insights and Forecast to 2028
BUY CHAPTERS

GERD Drug and Devices - Global Market Share and Ranking, Overall Sales and Demand Forecast 2024-2030

Code: QYRE-Auto-39Z10060
Report
December 2024
Pages:162
QYResearch
Buy Now with 15% Discount
DESCRIPTION
TABLE OF CONTENT
TABLES & FIGURES

GERD Drug and Devices - Market Size

According to our research, the global market for medical devices is estimated at US$ 603 billion in the year 2023, and will be growing at a CAGR of 5% during next six years.

GERD Drug and Devices - Market

GERD Drug and Devices - Market

The global market for GERD Drug and Devices was estimated to be worth US$ million in 2023 and is forecast to a readjusted size of US$ million by 2030 with a CAGR of % during the forecast period 2024-2030.
The global healthcare spending contributes to occupy 10% of the global GDP and is continuously rising in recent years due to the increasing health needs of the aging population, the growing prevalence of chronic and infectious diseases and the expansion of emerging markets. The medical devices market plays a significant role in the healthcare industry. The market is driven by several factors, including the increasing demand for advanced healthcare services globally, advancements in medical technology, growing geriatric population, rising healthcare expenditure, and increasing awareness about early disease diagnosis and treatment.

Report Scope

This report aims to provide a comprehensive presentation of the global market for GERD Drug and Devices, focusing on the total sales revenue, key companies market share and ranking, together with an analysis of GERD Drug and Devices by region & country, by Type, and by Application.
The GERD Drug and Devices market size, estimations, and forecasts are provided in terms of sales revenue ($ millions), considering 2023 as the base year, with history and forecast data for the period from 2019 to 2030. With both quantitative and qualitative analysis, to help readers develop business/growth strategies, assess the market competitive situation, analyze their position in the current marketplace, and make informed business decisions regarding GERD Drug and Devices.
Market Segmentation

Scope of GERD Drug and Devices - Market Report

Report Metric Details
Report Name GERD Drug and Devices - Market
Accounted market size in year US$ 603 billion
CAGR 5%
Base Year year
Segment by Type:
Segment by Application
By Region
  • North America (United States, Canada)
  • Europe (Germany, France, UK, Italy, Russia) Rest of Europe
  • Nordic Countries
  • Asia-Pacific (China, Japan, South Korea)
  • Southeast Asia (India, Australia)
  • Rest of Asia
  • Latin America (Mexico, Brazil)
  • Rest of Latin America
  • Middle East & Africa (Turkey, Saudi Arabia, UAE, Rest of MEA)
By Company AstraZeneca PLC, Boston Scientific Corporation, Cempra Inc., Eisai Co., EndoGastric Solutions Inc., EndoStim Inc., GlaxoSmithKline Plc, Ironwood Pharmaceuticals, Jeil Pharmaceutical Co. Ltd., Johnson & Johnson, Mederi Therapeutics Inc., Medigus Ltd., Medtronic Inc., Merck, Novartis AG, Pfizer Inc., Takeda Pharmaceutical, Teva Pharmaceuticals Industries, Torax Medical, Bausch Health
Forecast units USD million in value
Report coverage Revenue and volume forecast, company share, competitive landscape, growth factors and trends

Chapter Outline

  • Chapter 1: Introduces the report scope of the report, global total market size. This chapter also provides the market dynamics, latest developments of the market, the driving factors and restrictive factors of the market, the challenges and risks faced by manufacturers in the industry, and the analysis of relevant policies in the industry.
  • Chapter 2: Detailed analysis of GERD Drug and Devices manufacturers competitive landscape, revenue market share, latest development plan, merger, and acquisition information, etc.
  • Chapter 3: Provides the analysis of various market segments by Type, covering the market size and development potential of each market segment, to help readers find the blue ocean market in different market segments.
  • Chapter 4: Provides the analysis of various market segments by Application, covering the market size and development potential of each market segment, to help readers find the blue ocean market in different downstream markets.
  • Chapter 5: Revenue of GERD Drug and Devices in regional level. It provides a quantitative analysis of the market size and development potential of each region and introduces the market development, future development prospects, market space, and market size of each country in the world.
  • Chapter 6: Revenue of GERD Drug and Devices in country level. It provides sigmate data by Type, and by Application for each country/region.
  • Chapter 7: Provides profiles of key players, introducing the basic situation of the main companies in the market in detail, including product revenue, gross margin, product introduction, recent development, etc.
  • Chapter 8: Analysis of industrial chain, including the upstream and downstream of the industry.
  • Chapter 9: Conclusion.

FAQ for this report

Who are the main players in the GERD Drug and Devices - Market report?

Ans: The main players in the GERD Drug and Devices - Market are AstraZeneca PLC, Boston Scientific Corporation, Cempra Inc., Eisai Co., EndoGastric Solutions Inc., EndoStim Inc., GlaxoSmithKline Plc, Ironwood Pharmaceuticals, Jeil Pharmaceutical Co. Ltd., Johnson & Johnson, Mederi Therapeutics Inc., Medigus Ltd., Medtronic Inc., Merck, Novartis AG, Pfizer Inc., Takeda Pharmaceutical, Teva Pharmaceuticals Industries, Torax Medical, Bausch Health

What are the Application segmentation covered in the GERD Drug and Devices - Market report?

Ans: The Applications covered in the GERD Drug and Devices - Market report are Heartburn, Acid reflux disorders

What are the Type segmentation covered in the GERD Drug and Devices - Market report?

Ans: The Types covered in the GERD Drug and Devices - Market report are Antacids, H2 Receptor Blockers, Proton Pump Inhibitors, Pro-Kinetic Agents, Digitrapper, Bravo System, Stretta, Linx Reflux Management System, Medigus Ultrasonic Surgical Endostapler, Other

Recommended Reports

Diagnostic & Surgical Devices

Medical & Homecare Devices

Healthcare Analytics & Management

1 Market Overview
1.1 GERD Drug and Devices Product Introduction
1.2 Global GERD Drug and Devices Market Size Forecast
1.3 GERD Drug and Devices Market Trends & Drivers
1.3.1 GERD Drug and Devices Industry Trends
1.3.2 GERD Drug and Devices Market Drivers & Opportunity
1.3.3 GERD Drug and Devices Market Challenges
1.3.4 GERD Drug and Devices Market Restraints
1.4 Assumptions and Limitations
1.5 Study Objectives
1.6 Years Considered
2 Competitive Analysis by Company
2.1 Global GERD Drug and Devices Players Revenue Ranking (2023)
2.2 Global GERD Drug and Devices Revenue by Company (2019-2024)
2.3 Key Companies GERD Drug and Devices Manufacturing Base Distribution and Headquarters
2.4 Key Companies GERD Drug and Devices Product Offered
2.5 Key Companies Time to Begin Mass Production of GERD Drug and Devices
2.6 GERD Drug and Devices Market Competitive Analysis
2.6.1 GERD Drug and Devices Market Concentration Rate (2019-2024)
2.6.2 Global 5 and 10 Largest Companies by GERD Drug and Devices Revenue in 2023
2.6.3 Global Top Companies by Company Type (Tier 1, Tier 2, and Tier 3) & (based on the Revenue in GERD Drug and Devices as of 2023)
2.7 Mergers & Acquisitions, Expansion
3 Segmentation by Type
3.1 Introduction by Type
3.1.1 Antacids
3.1.2 H2 Receptor Blockers
3.1.3 Proton Pump Inhibitors
3.1.4 Pro-Kinetic Agents
3.1.5 Digitrapper
3.1.6 Bravo System
3.1.7 Stretta
3.1.8 Linx Reflux Management System
3.1.9 Medigus Ultrasonic Surgical Endostapler
3.1.10 Other
3.2 Global GERD Drug and Devices Sales Value by Type
3.2.1 Global GERD Drug and Devices Sales Value by Type (2019 VS 2023 VS 2030)
3.2.2 Global GERD Drug and Devices Sales Value, by Type (2019-2030)
3.2.3 Global GERD Drug and Devices Sales Value, by Type (%) (2019-2030)
4 Segmentation by Application
4.1 Introduction by Application
4.1.1 Heartburn
4.1.2 Acid reflux disorders
4.2 Global GERD Drug and Devices Sales Value by Application
4.2.1 Global GERD Drug and Devices Sales Value by Application (2019 VS 2023 VS 2030)
4.2.2 Global GERD Drug and Devices Sales Value, by Application (2019-2030)
4.2.3 Global GERD Drug and Devices Sales Value, by Application (%) (2019-2030)
5 Segmentation by Region
5.1 Global GERD Drug and Devices Sales Value by Region
5.1.1 Global GERD Drug and Devices Sales Value by Region: 2019 VS 2023 VS 2030
5.1.2 Global GERD Drug and Devices Sales Value by Region (2019-2024)
5.1.3 Global GERD Drug and Devices Sales Value by Region (2025-2030)
5.1.4 Global GERD Drug and Devices Sales Value by Region (%), (2019-2030)
5.2 North America
5.2.1 North America GERD Drug and Devices Sales Value, 2019-2030
5.2.2 North America GERD Drug and Devices Sales Value by Country (%), 2023 VS 2030
5.3 Europe
5.3.1 Europe GERD Drug and Devices Sales Value, 2019-2030
5.3.2 Europe GERD Drug and Devices Sales Value by Country (%), 2023 VS 2030
5.4 Asia Pacific
5.4.1 Asia Pacific GERD Drug and Devices Sales Value, 2019-2030
5.4.2 Asia Pacific GERD Drug and Devices Sales Value by Country (%), 2023 VS 2030
5.5 South America
5.5.1 South America GERD Drug and Devices Sales Value, 2019-2030
5.5.2 South America GERD Drug and Devices Sales Value by Country (%), 2023 VS 2030
5.6 Middle East & Africa
5.6.1 Middle East & Africa GERD Drug and Devices Sales Value, 2019-2030
5.6.2 Middle East & Africa GERD Drug and Devices Sales Value by Country (%), 2023 VS 2030
6 Segmentation by Key Countries/Regions
6.1 Key Countries/Regions GERD Drug and Devices Sales Value Growth Trends, 2019 VS 2023 VS 2030
6.2 Key Countries/Regions GERD Drug and Devices Sales Value
6.3 United States
6.3.1 United States GERD Drug and Devices Sales Value, 2019-2030
6.3.2 United States GERD Drug and Devices Sales Value by Type (%), 2023 VS 2030
6.3.3 United States GERD Drug and Devices Sales Value by Application, 2023 VS 2030
6.4 Europe
6.4.1 Europe GERD Drug and Devices Sales Value, 2019-2030
6.4.2 Europe GERD Drug and Devices Sales Value by Type (%), 2023 VS 2030
6.4.3 Europe GERD Drug and Devices Sales Value by Application, 2023 VS 2030
6.5 China
6.5.1 China GERD Drug and Devices Sales Value, 2019-2030
6.5.2 China GERD Drug and Devices Sales Value by Type (%), 2023 VS 2030
6.5.3 China GERD Drug and Devices Sales Value by Application, 2023 VS 2030
6.6 Japan
6.6.1 Japan GERD Drug and Devices Sales Value, 2019-2030
6.6.2 Japan GERD Drug and Devices Sales Value by Type (%), 2023 VS 2030
6.6.3 Japan GERD Drug and Devices Sales Value by Application, 2023 VS 2030
6.7 South Korea
6.7.1 South Korea GERD Drug and Devices Sales Value, 2019-2030
6.7.2 South Korea GERD Drug and Devices Sales Value by Type (%), 2023 VS 2030
6.7.3 South Korea GERD Drug and Devices Sales Value by Application, 2023 VS 2030
6.8 Southeast Asia
6.8.1 Southeast Asia GERD Drug and Devices Sales Value, 2019-2030
6.8.2 Southeast Asia GERD Drug and Devices Sales Value by Type (%), 2023 VS 2030
6.8.3 Southeast Asia GERD Drug and Devices Sales Value by Application, 2023 VS 2030
6.9 India
6.9.1 India GERD Drug and Devices Sales Value, 2019-2030
6.9.2 India GERD Drug and Devices Sales Value by Type (%), 2023 VS 2030
6.9.3 India GERD Drug and Devices Sales Value by Application, 2023 VS 2030
7 Company Profiles
7.1 AstraZeneca PLC
7.1.1 AstraZeneca PLC Profile
7.1.2 AstraZeneca PLC Main Business
7.1.3 AstraZeneca PLC GERD Drug and Devices Products, Services and Solutions
7.1.4 AstraZeneca PLC GERD Drug and Devices Revenue (US$ Million) & (2019-2024)
7.1.5 AstraZeneca PLC Recent Developments
7.2 Boston Scientific Corporation
7.2.1 Boston Scientific Corporation Profile
7.2.2 Boston Scientific Corporation Main Business
7.2.3 Boston Scientific Corporation GERD Drug and Devices Products, Services and Solutions
7.2.4 Boston Scientific Corporation GERD Drug and Devices Revenue (US$ Million) & (2019-2024)
7.2.5 Boston Scientific Corporation Recent Developments
7.3 Cempra Inc.
7.3.1 Cempra Inc. Profile
7.3.2 Cempra Inc. Main Business
7.3.3 Cempra Inc. GERD Drug and Devices Products, Services and Solutions
7.3.4 Cempra Inc. GERD Drug and Devices Revenue (US$ Million) & (2019-2024)
7.3.5 Eisai Co. Recent Developments
7.4 Eisai Co.
7.4.1 Eisai Co. Profile
7.4.2 Eisai Co. Main Business
7.4.3 Eisai Co. GERD Drug and Devices Products, Services and Solutions
7.4.4 Eisai Co. GERD Drug and Devices Revenue (US$ Million) & (2019-2024)
7.4.5 Eisai Co. Recent Developments
7.5 EndoGastric Solutions Inc.
7.5.1 EndoGastric Solutions Inc. Profile
7.5.2 EndoGastric Solutions Inc. Main Business
7.5.3 EndoGastric Solutions Inc. GERD Drug and Devices Products, Services and Solutions
7.5.4 EndoGastric Solutions Inc. GERD Drug and Devices Revenue (US$ Million) & (2019-2024)
7.5.5 EndoGastric Solutions Inc. Recent Developments
7.6 EndoStim Inc.
7.6.1 EndoStim Inc. Profile
7.6.2 EndoStim Inc. Main Business
7.6.3 EndoStim Inc. GERD Drug and Devices Products, Services and Solutions
7.6.4 EndoStim Inc. GERD Drug and Devices Revenue (US$ Million) & (2019-2024)
7.6.5 EndoStim Inc. Recent Developments
7.7 GlaxoSmithKline Plc
7.7.1 GlaxoSmithKline Plc Profile
7.7.2 GlaxoSmithKline Plc Main Business
7.7.3 GlaxoSmithKline Plc GERD Drug and Devices Products, Services and Solutions
7.7.4 GlaxoSmithKline Plc GERD Drug and Devices Revenue (US$ Million) & (2019-2024)
7.7.5 GlaxoSmithKline Plc Recent Developments
7.8 Ironwood Pharmaceuticals
7.8.1 Ironwood Pharmaceuticals Profile
7.8.2 Ironwood Pharmaceuticals Main Business
7.8.3 Ironwood Pharmaceuticals GERD Drug and Devices Products, Services and Solutions
7.8.4 Ironwood Pharmaceuticals GERD Drug and Devices Revenue (US$ Million) & (2019-2024)
7.8.5 Ironwood Pharmaceuticals Recent Developments
7.9 Jeil Pharmaceutical Co. Ltd.
7.9.1 Jeil Pharmaceutical Co. Ltd. Profile
7.9.2 Jeil Pharmaceutical Co. Ltd. Main Business
7.9.3 Jeil Pharmaceutical Co. Ltd. GERD Drug and Devices Products, Services and Solutions
7.9.4 Jeil Pharmaceutical Co. Ltd. GERD Drug and Devices Revenue (US$ Million) & (2019-2024)
7.9.5 Jeil Pharmaceutical Co. Ltd. Recent Developments
7.10 Johnson & Johnson
7.10.1 Johnson & Johnson Profile
7.10.2 Johnson & Johnson Main Business
7.10.3 Johnson & Johnson GERD Drug and Devices Products, Services and Solutions
7.10.4 Johnson & Johnson GERD Drug and Devices Revenue (US$ Million) & (2019-2024)
7.10.5 Johnson & Johnson Recent Developments
7.11 Mederi Therapeutics Inc.
7.11.1 Mederi Therapeutics Inc. Profile
7.11.2 Mederi Therapeutics Inc. Main Business
7.11.3 Mederi Therapeutics Inc. GERD Drug and Devices Products, Services and Solutions
7.11.4 Mederi Therapeutics Inc. GERD Drug and Devices Revenue (US$ Million) & (2019-2024)
7.11.5 Mederi Therapeutics Inc. Recent Developments
7.12 Medigus Ltd.
7.12.1 Medigus Ltd. Profile
7.12.2 Medigus Ltd. Main Business
7.12.3 Medigus Ltd. GERD Drug and Devices Products, Services and Solutions
7.12.4 Medigus Ltd. GERD Drug and Devices Revenue (US$ Million) & (2019-2024)
7.12.5 Medigus Ltd. Recent Developments
7.13 Medtronic Inc.
7.13.1 Medtronic Inc. Profile
7.13.2 Medtronic Inc. Main Business
7.13.3 Medtronic Inc. GERD Drug and Devices Products, Services and Solutions
7.13.4 Medtronic Inc. GERD Drug and Devices Revenue (US$ Million) & (2019-2024)
7.13.5 Medtronic Inc. Recent Developments
7.14 Merck
7.14.1 Merck Profile
7.14.2 Merck Main Business
7.14.3 Merck GERD Drug and Devices Products, Services and Solutions
7.14.4 Merck GERD Drug and Devices Revenue (US$ Million) & (2019-2024)
7.14.5 Merck Recent Developments
7.15 Novartis AG
7.15.1 Novartis AG Profile
7.15.2 Novartis AG Main Business
7.15.3 Novartis AG GERD Drug and Devices Products, Services and Solutions
7.15.4 Novartis AG GERD Drug and Devices Revenue (US$ Million) & (2019-2024)
7.15.5 Novartis AG Recent Developments
7.16 Pfizer Inc.
7.16.1 Pfizer Inc. Profile
7.16.2 Pfizer Inc. Main Business
7.16.3 Pfizer Inc. GERD Drug and Devices Products, Services and Solutions
7.16.4 Pfizer Inc. GERD Drug and Devices Revenue (US$ Million) & (2019-2024)
7.16.5 Pfizer Inc. Recent Developments
7.17 Takeda Pharmaceutical
7.17.1 Takeda Pharmaceutical Profile
7.17.2 Takeda Pharmaceutical Main Business
7.17.3 Takeda Pharmaceutical GERD Drug and Devices Products, Services and Solutions
7.17.4 Takeda Pharmaceutical GERD Drug and Devices Revenue (US$ Million) & (2019-2024)
7.17.5 Takeda Pharmaceutical Recent Developments
7.18 Teva Pharmaceuticals Industries
7.18.1 Teva Pharmaceuticals Industries Profile
7.18.2 Teva Pharmaceuticals Industries Main Business
7.18.3 Teva Pharmaceuticals Industries GERD Drug and Devices Products, Services and Solutions
7.18.4 Teva Pharmaceuticals Industries GERD Drug and Devices Revenue (US$ Million) & (2019-2024)
7.18.5 Teva Pharmaceuticals Industries Recent Developments
7.19 Torax Medical
7.19.1 Torax Medical Profile
7.19.2 Torax Medical Main Business
7.19.3 Torax Medical GERD Drug and Devices Products, Services and Solutions
7.19.4 Torax Medical GERD Drug and Devices Revenue (US$ Million) & (2019-2024)
7.19.5 Torax Medical Recent Developments
7.20 Bausch Health
7.20.1 Bausch Health Profile
7.20.2 Bausch Health Main Business
7.20.3 Bausch Health GERD Drug and Devices Products, Services and Solutions
7.20.4 Bausch Health GERD Drug and Devices Revenue (US$ Million) & (2019-2024)
7.20.5 Bausch Health Recent Developments
8 Industry Chain Analysis
8.1 GERD Drug and Devices Industrial Chain
8.2 GERD Drug and Devices Upstream Analysis
8.2.1 Key Raw Materials
8.2.2 Raw Materials Key Suppliers
8.2.3 Manufacturing Cost Structure
8.3 Midstream Analysis
8.4 Downstream Analysis (Customers Analysis)
8.5 Sales Model and Sales Channels
8.5.1 GERD Drug and Devices Sales Model
8.5.2 Sales Channel
8.5.3 GERD Drug and Devices Distributors
9 Research Findings and Conclusion
10 Appendix
10.1 Research Methodology
10.1.1 Methodology/Research Approach
10.1.2 Data Source
10.2 Author Details
10.3 Disclaimer
List of Tables
    Table 1. GERD Drug and Devices Market Trends
    Table 2. GERD Drug and Devices Market Drivers & Opportunity
    Table 3. GERD Drug and Devices Market Challenges
    Table 4. GERD Drug and Devices Market Restraints
    Table 5. Global GERD Drug and Devices Revenue by Company (2019-2024) & (US$ Million)
    Table 6. Global GERD Drug and Devices Revenue Market Share by Company (2019-2024)
    Table 7. Key Companies GERD Drug and Devices Manufacturing Base Distribution and Headquarters
    Table 8. Key Companies GERD Drug and Devices Product Type
    Table 9. Key Companies Time to Begin Mass Production of GERD Drug and Devices
    Table 10. Global GERD Drug and Devices Companies Market Concentration Ratio (CR5 and HHI)
    Table 11. Global Top Companies Market Share by Company Type (Tier 1, Tier 2, and Tier 3) & (based on the Revenue in GERD Drug and Devices as of 2023)
    Table 12. Mergers & Acquisitions, Expansion Plans
    Table 13. Global GERD Drug and Devices Sales Value by Type: 2019 VS 2023 VS 2030 (US$ Million)
    Table 14. Global GERD Drug and Devices Sales Value by Type (2019-2024) & (US$ Million)
    Table 15. Global GERD Drug and Devices Sales Value by Type (2025-2030) & (US$ Million)
    Table 16. Global GERD Drug and Devices Sales Market Share in Value by Type (2019-2024) & (%)
    Table 17. Global GERD Drug and Devices Sales Market Share in Value by Type (2025-2030) & (%)
    Table 18. Global GERD Drug and Devices Sales Value by Application: 2019 VS 2023 VS 2030 (US$ Million)
    Table 19. Global GERD Drug and Devices Sales Value by Application (2019-2024) & (US$ Million)
    Table 20. Global GERD Drug and Devices Sales Value by Application (2025-2030) & (US$ Million)
    Table 21. Global GERD Drug and Devices Sales Market Share in Value by Application (2019-2024) & (%)
    Table 22. Global GERD Drug and Devices Sales Market Share in Value by Application (2025-2030) & (%)
    Table 23. Global GERD Drug and Devices Sales Value by Region: 2019 VS 2023 VS 2030 (US$ Million)
    Table 24. Global GERD Drug and Devices Sales Value by Region (2019-2024) & (US$ Million)
    Table 25. Global GERD Drug and Devices Sales Value by Region (2025-2030) & (US$ Million)
    Table 26. Global GERD Drug and Devices Sales Value by Region (2019-2024) & (%)
    Table 27. Global GERD Drug and Devices Sales Value by Region (2025-2030) & (%)
    Table 28. Key Countries/Regions GERD Drug and Devices Sales Value Growth Trends, (US$ Million): 2019 VS 2023 VS 2030
    Table 29. Key Countries/Regions GERD Drug and Devices Sales Value, (2019-2024) & (US$ Million)
    Table 30. Key Countries/Regions GERD Drug and Devices Sales Value, (2025-2030) & (US$ Million)
    Table 31. AstraZeneca PLC Basic Information List
    Table 32. AstraZeneca PLC Description and Business Overview
    Table 33. AstraZeneca PLC GERD Drug and Devices Products, Services and Solutions
    Table 34. Revenue (US$ Million) in GERD Drug and Devices Business of AstraZeneca PLC (2019-2024)
    Table 35. AstraZeneca PLC Recent Developments
    Table 36. Boston Scientific Corporation Basic Information List
    Table 37. Boston Scientific Corporation Description and Business Overview
    Table 38. Boston Scientific Corporation GERD Drug and Devices Products, Services and Solutions
    Table 39. Revenue (US$ Million) in GERD Drug and Devices Business of Boston Scientific Corporation (2019-2024)
    Table 40. Boston Scientific Corporation Recent Developments
    Table 41. Cempra Inc. Basic Information List
    Table 42. Cempra Inc. Description and Business Overview
    Table 43. Cempra Inc. GERD Drug and Devices Products, Services and Solutions
    Table 44. Revenue (US$ Million) in GERD Drug and Devices Business of Cempra Inc. (2019-2024)
    Table 45. Cempra Inc. Recent Developments
    Table 46. Eisai Co. Basic Information List
    Table 47. Eisai Co. Description and Business Overview
    Table 48. Eisai Co. GERD Drug and Devices Products, Services and Solutions
    Table 49. Revenue (US$ Million) in GERD Drug and Devices Business of Eisai Co. (2019-2024)
    Table 50. Eisai Co. Recent Developments
    Table 51. EndoGastric Solutions Inc. Basic Information List
    Table 52. EndoGastric Solutions Inc. Description and Business Overview
    Table 53. EndoGastric Solutions Inc. GERD Drug and Devices Products, Services and Solutions
    Table 54. Revenue (US$ Million) in GERD Drug and Devices Business of EndoGastric Solutions Inc. (2019-2024)
    Table 55. EndoGastric Solutions Inc. Recent Developments
    Table 56. EndoStim Inc. Basic Information List
    Table 57. EndoStim Inc. Description and Business Overview
    Table 58. EndoStim Inc. GERD Drug and Devices Products, Services and Solutions
    Table 59. Revenue (US$ Million) in GERD Drug and Devices Business of EndoStim Inc. (2019-2024)
    Table 60. EndoStim Inc. Recent Developments
    Table 61. GlaxoSmithKline Plc Basic Information List
    Table 62. GlaxoSmithKline Plc Description and Business Overview
    Table 63. GlaxoSmithKline Plc GERD Drug and Devices Products, Services and Solutions
    Table 64. Revenue (US$ Million) in GERD Drug and Devices Business of GlaxoSmithKline Plc (2019-2024)
    Table 65. GlaxoSmithKline Plc Recent Developments
    Table 66. Ironwood Pharmaceuticals Basic Information List
    Table 67. Ironwood Pharmaceuticals Description and Business Overview
    Table 68. Ironwood Pharmaceuticals GERD Drug and Devices Products, Services and Solutions
    Table 69. Revenue (US$ Million) in GERD Drug and Devices Business of Ironwood Pharmaceuticals (2019-2024)
    Table 70. Ironwood Pharmaceuticals Recent Developments
    Table 71. Jeil Pharmaceutical Co. Ltd. Basic Information List
    Table 72. Jeil Pharmaceutical Co. Ltd. Description and Business Overview
    Table 73. Jeil Pharmaceutical Co. Ltd. GERD Drug and Devices Products, Services and Solutions
    Table 74. Revenue (US$ Million) in GERD Drug and Devices Business of Jeil Pharmaceutical Co. Ltd. (2019-2024)
    Table 75. Jeil Pharmaceutical Co. Ltd. Recent Developments
    Table 76. Johnson & Johnson Basic Information List
    Table 77. Johnson & Johnson Description and Business Overview
    Table 78. Johnson & Johnson GERD Drug and Devices Products, Services and Solutions
    Table 79. Revenue (US$ Million) in GERD Drug and Devices Business of Johnson & Johnson (2019-2024)
    Table 80. Johnson & Johnson Recent Developments
    Table 81. Mederi Therapeutics Inc. Basic Information List
    Table 82. Mederi Therapeutics Inc. Description and Business Overview
    Table 83. Mederi Therapeutics Inc. GERD Drug and Devices Products, Services and Solutions
    Table 84. Revenue (US$ Million) in GERD Drug and Devices Business of Mederi Therapeutics Inc. (2019-2024)
    Table 85. Mederi Therapeutics Inc. Recent Developments
    Table 86. Medigus Ltd. Basic Information List
    Table 87. Medigus Ltd. Description and Business Overview
    Table 88. Medigus Ltd. GERD Drug and Devices Products, Services and Solutions
    Table 89. Revenue (US$ Million) in GERD Drug and Devices Business of Medigus Ltd. (2019-2024)
    Table 90. Medigus Ltd. Recent Developments
    Table 91. Medtronic Inc. Basic Information List
    Table 92. Medtronic Inc. Description and Business Overview
    Table 93. Medtronic Inc. GERD Drug and Devices Products, Services and Solutions
    Table 94. Revenue (US$ Million) in GERD Drug and Devices Business of Medtronic Inc. (2019-2024)
    Table 95. Medtronic Inc. Recent Developments
    Table 96. Merck Basic Information List
    Table 97. Merck Description and Business Overview
    Table 98. Merck GERD Drug and Devices Products, Services and Solutions
    Table 99. Revenue (US$ Million) in GERD Drug and Devices Business of Merck (2019-2024)
    Table 100. Merck Recent Developments
    Table 101. Novartis AG Basic Information List
    Table 102. Novartis AG Description and Business Overview
    Table 103. Novartis AG GERD Drug and Devices Products, Services and Solutions
    Table 104. Revenue (US$ Million) in GERD Drug and Devices Business of Novartis AG (2019-2024)
    Table 105. Novartis AG Recent Developments
    Table 106. Pfizer Inc. Basic Information List
    Table 107. Pfizer Inc. Description and Business Overview
    Table 108. Pfizer Inc. GERD Drug and Devices Products, Services and Solutions
    Table 109. Revenue (US$ Million) in GERD Drug and Devices Business of Pfizer Inc. (2019-2024)
    Table 110. Pfizer Inc. Recent Developments
    Table 111. Takeda Pharmaceutical Basic Information List
    Table 112. Takeda Pharmaceutical Description and Business Overview
    Table 113. Takeda Pharmaceutical GERD Drug and Devices Products, Services and Solutions
    Table 114. Revenue (US$ Million) in GERD Drug and Devices Business of Takeda Pharmaceutical (2019-2024)
    Table 115. Takeda Pharmaceutical Recent Developments
    Table 116. Teva Pharmaceuticals Industries Basic Information List
    Table 117. Teva Pharmaceuticals Industries Description and Business Overview
    Table 118. Teva Pharmaceuticals Industries GERD Drug and Devices Products, Services and Solutions
    Table 119. Revenue (US$ Million) in GERD Drug and Devices Business of Teva Pharmaceuticals Industries (2019-2024)
    Table 120. Teva Pharmaceuticals Industries Recent Developments
    Table 121. Torax Medical Basic Information List
    Table 122. Torax Medical Description and Business Overview
    Table 123. Torax Medical GERD Drug and Devices Products, Services and Solutions
    Table 124. Revenue (US$ Million) in GERD Drug and Devices Business of Torax Medical (2019-2024)
    Table 125. Torax Medical Recent Developments
    Table 126. Bausch Health Basic Information List
    Table 127. Bausch Health Description and Business Overview
    Table 128. Bausch Health GERD Drug and Devices Products, Services and Solutions
    Table 129. Revenue (US$ Million) in GERD Drug and Devices Business of Bausch Health (2019-2024)
    Table 130. Bausch Health Recent Developments
    Table 131. Key Raw Materials Lists
    Table 132. Raw Materials Key Suppliers Lists
    Table 133. GERD Drug and Devices Downstream Customers
    Table 134. GERD Drug and Devices Distributors List
    Table 135. Research Programs/Design for This Report
    Table 136. Key Data Information from Secondary Sources
    Table 137. Key Data Information from Primary Sources
    Table 138. Business Unit and Senior & Team Lead Analysts
List of Figures
    Figure 1. GERD Drug and Devices Product Picture
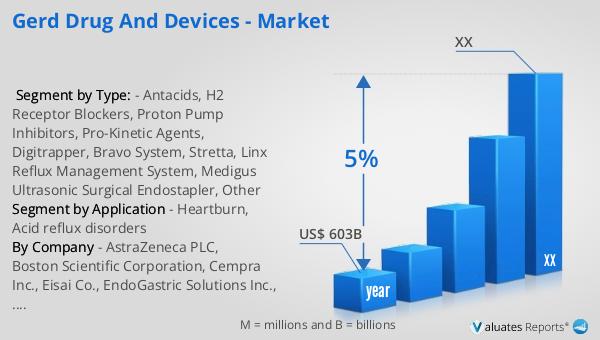
    Figure 2. Global GERD Drug and Devices Sales Value, 2019 VS 2023 VS 2030 (US$ Million)
    Figure 3. Global GERD Drug and Devices Sales Value (2019-2030) & (US$ Million)
    Figure 4. GERD Drug and Devices Report Years Considered
    Figure 5. Global GERD Drug and Devices Players Revenue Ranking (2023) & (US$ Million)
    Figure 6. The 5 and 10 Largest Manufacturers in the World: Market Share by GERD Drug and Devices Revenue in 2023
    Figure 7. GERD Drug and Devices Market Share by Company Type (Tier 1, Tier 2, and Tier 3): 2019 VS 2023
    Figure 8. Antacids Picture
    Figure 9. H2 Receptor Blockers Picture
    Figure 10. Proton Pump Inhibitors Picture
    Figure 11. Pro-Kinetic Agents Picture
    Figure 12. Digitrapper Picture
    Figure 13. Bravo System Picture
    Figure 14. Stretta Picture
    Figure 15. Linx Reflux Management System Picture
    Figure 16. Medigus Ultrasonic Surgical Endostapler Picture
    Figure 17. Other Picture
    Figure 18. Global GERD Drug and Devices Sales Value by Type (2019 VS 2023 VS 2030) & (US$ Million)
    Figure 19. Global GERD Drug and Devices Sales Value Market Share by Type, 2023 & 2030
    Figure 20. Product Picture of Heartburn
    Figure 21. Product Picture of Acid reflux disorders
    Figure 22. Global GERD Drug and Devices Sales Value by Application (2019 VS 2023 VS 2030) & (US$ Million)
    Figure 23. Global GERD Drug and Devices Sales Value Market Share by Application, 2023 & 2030
    Figure 24. North America GERD Drug and Devices Sales Value (2019-2030) & (US$ Million)
    Figure 25. North America GERD Drug and Devices Sales Value by Country (%), 2023 VS 2030
    Figure 26. Europe GERD Drug and Devices Sales Value (2019-2030) & (US$ Million)
    Figure 27. Europe GERD Drug and Devices Sales Value by Country (%), 2023 VS 2030
    Figure 28. Asia Pacific GERD Drug and Devices Sales Value (2019-2030) & (US$ Million)
    Figure 29. Asia Pacific GERD Drug and Devices Sales Value by Country (%), 2023 VS 2030
    Figure 30. South America GERD Drug and Devices Sales Value (2019-2030) & (US$ Million)
    Figure 31. South America GERD Drug and Devices Sales Value by Country (%), 2023 VS 2030
    Figure 32. Middle East & Africa GERD Drug and Devices Sales Value (2019-2030) & (US$ Million)
    Figure 33. Middle East & Africa GERD Drug and Devices Sales Value by Country (%), 2023 VS 2030
    Figure 34. Key Countries/Regions GERD Drug and Devices Sales Value (%), (2019-2030)
    Figure 35. United States GERD Drug and Devices Sales Value, (2019-2030) & (US$ Million)
    Figure 36. United States GERD Drug and Devices Sales Value by Type (%), 2023 VS 2030
    Figure 37. United States GERD Drug and Devices Sales Value by Application (%), 2023 VS 2030
    Figure 38. Europe GERD Drug and Devices Sales Value, (2019-2030) & (US$ Million)
    Figure 39. Europe GERD Drug and Devices Sales Value by Type (%), 2023 VS 2030
    Figure 40. Europe GERD Drug and Devices Sales Value by Application (%), 2023 VS 2030
    Figure 41. China GERD Drug and Devices Sales Value, (2019-2030) & (US$ Million)
    Figure 42. China GERD Drug and Devices Sales Value by Type (%), 2023 VS 2030
    Figure 43. China GERD Drug and Devices Sales Value by Application (%), 2023 VS 2030
    Figure 44. Japan GERD Drug and Devices Sales Value, (2019-2030) & (US$ Million)
    Figure 45. Japan GERD Drug and Devices Sales Value by Type (%), 2023 VS 2030
    Figure 46. Japan GERD Drug and Devices Sales Value by Application (%), 2023 VS 2030
    Figure 47. South Korea GERD Drug and Devices Sales Value, (2019-2030) & (US$ Million)
    Figure 48. South Korea GERD Drug and Devices Sales Value by Type (%), 2023 VS 2030
    Figure 49. South Korea GERD Drug and Devices Sales Value by Application (%), 2023 VS 2030
    Figure 50. Southeast Asia GERD Drug and Devices Sales Value, (2019-2030) & (US$ Million)
    Figure 51. Southeast Asia GERD Drug and Devices Sales Value by Type (%), 2023 VS 2030
    Figure 52. Southeast Asia GERD Drug and Devices Sales Value by Application (%), 2023 VS 2030
    Figure 53. India GERD Drug and Devices Sales Value, (2019-2030) & (US$ Million)
    Figure 54. India GERD Drug and Devices Sales Value by Type (%), 2023 VS 2030
    Figure 55. India GERD Drug and Devices Sales Value by Application (%), 2023 VS 2030
    Figure 56. GERD Drug and Devices Industrial Chain
    Figure 57. GERD Drug and Devices Manufacturing Cost Structure
    Figure 58. Channels of Distribution (Direct Sales, and Distribution)
    Figure 59. Bottom-up and Top-down Approaches for This Report
    Figure 60. Data Triangulation
SELECT A FORMAT
Added to Cart
Electronic (PDF)

$3950

This license allows only one user to access the PDF.
Electronic (PDF)

$5925

This license allows 1 - 5 user to access the PDF, license is suitable for small groups of 5 users working together
Electronic (PDF)

$7900

This license allows users/teams in a same Enterprise to use this report, various departments within an enterpise can use this report
Add to Cart
Buy Now (15% Discount)

OUR CUSTOMER

Nano String

SIMILAR REPORTS