List of Tables
Table 1. Global Production Quality Analytics (PQA) Market Size Growth Rate by Type (US$ Million): 2020 VS 2024 VS 2031
Table 2. Key Players of Defect Detection & Classification
Table 3. Key Players of Process Capability Analysis
Table 4. Key Players of Predictive Quality Analytics
Table 5. Key Players of Compliance & Audit Analytics
Table 6. Key Players of Root Cause Analysis (RCA) Analytics
Table 7. Key Players of Supplier Quality Analytics
Table 8. Global Production Quality Analytics (PQA) Market Size Growth Rate by Data Sources (Input Data Type) (US$ Million): 2020 VS 2024 VS 2031
Table 9. Key Players of Sensor & IoT Data Analytics
Table 10. Key Players of Visual Data Analytics
Table 11. Key Players of Transactional & ERP Data Analytics
Table 12. Key Players of Human-Generated Data Analytics
Table 13. Key Players of Supply Chain Data Analytics
Table 14. Global Production Quality Analytics (PQA) Market Size Growth Rate by Analytical Methodologies (Technical Approach) (US$ Million): 2020 VS 2024 VS 2031
Table 15. Key Players of Descriptive Analytics
Table 16. Key Players of Diagnostic Analytics
Table 17. Key Players of Predictive Analytics
Table 18. Key Players of Prescriptive Analytics
Table 19. Key Players of AI/Deep Learning Analytics
Table 20. Global Production Quality Analytics (PQA) Market Size Growth by Application (US$ Million): 2020 VS 2024 VS 2031
Table 21. Global Production Quality Analytics (PQA) Market Size by Region (US$ Million): 2020 VS 2024 VS 2031
Table 22. Global Production Quality Analytics (PQA) Market Size by Region (2020-2025) & (US$ Million)
Table 23. Global Production Quality Analytics (PQA) Market Share by Region (2020-2025)
Table 24. Global Production Quality Analytics (PQA) Forecasted Market Size by Region (2026-2031) & (US$ Million)
Table 25. Global Production Quality Analytics (PQA) Market Share by Region (2026-2031)
Table 26. Production Quality Analytics (PQA) Market Trends
Table 27. Production Quality Analytics (PQA) Market Drivers
Table 28. Production Quality Analytics (PQA) Market Challenges
Table 29. Production Quality Analytics (PQA) Market Restraints
Table 30. Global Production Quality Analytics (PQA) Revenue by Players (2020-2025) & (US$ Million)
Table 31. Global Production Quality Analytics (PQA) Market Share by Players (2020-2025)
Table 32. Global Top Production Quality Analytics (PQA) Players by Company Type (Tier 1, Tier 2, and Tier 3) & (based on the Revenue in Production Quality Analytics (PQA) as of 2024)
Table 33. Ranking of Global Top Production Quality Analytics (PQA) Companies by Revenue (US$ Million) in 2024
Table 34. Global 5 Largest Players Market Share by Production Quality Analytics (PQA) Revenue (CR5 and HHI) & (2020-2025)
Table 35. Global Key Players of Production Quality Analytics (PQA), Headquarters and Area Served
Table 36. Global Key Players of Production Quality Analytics (PQA), Product and Application
Table 37. Global Key Players of Production Quality Analytics (PQA), Date of Enter into This Industry
Table 38. Mergers & Acquisitions, Expansion Plans
Table 39. Global Production Quality Analytics (PQA) Market Size by Type (2020-2025) & (US$ Million)
Table 40. Global Production Quality Analytics (PQA) Revenue Market Share by Type (2020-2025)
Table 41. Global Production Quality Analytics (PQA) Forecasted Market Size by Type (2026-2031) & (US$ Million)
Table 42. Global Production Quality Analytics (PQA) Revenue Market Share by Type (2026-2031)
Table 43. Global Production Quality Analytics (PQA) Market Size by Application (2020-2025) & (US$ Million)
Table 44. Global Production Quality Analytics (PQA) Revenue Market Share by Application (2020-2025)
Table 45. Global Production Quality Analytics (PQA) Forecasted Market Size by Application (2026-2031) & (US$ Million)
Table 46. Global Production Quality Analytics (PQA) Revenue Market Share by Application (2026-2031)
Table 47. North America Production Quality Analytics (PQA) Market Size Growth Rate by Country (US$ Million): 2020 VS 2024 VS 2031
Table 48. North America Production Quality Analytics (PQA) Market Size by Country (2020-2025) & (US$ Million)
Table 49. North America Production Quality Analytics (PQA) Market Size by Country (2026-2031) & (US$ Million)
Table 50. Europe Production Quality Analytics (PQA) Market Size Growth Rate by Country (US$ Million): 2020 VS 2024 VS 2031
Table 51. Europe Production Quality Analytics (PQA) Market Size by Country (2020-2025) & (US$ Million)
Table 52. Europe Production Quality Analytics (PQA) Market Size by Country (2026-2031) & (US$ Million)
Table 53. Asia-Pacific Production Quality Analytics (PQA) Market Size Growth Rate by Region (US$ Million): 2020 VS 2024 VS 2031
Table 54. Asia-Pacific Production Quality Analytics (PQA) Market Size by Region (2020-2025) & (US$ Million)
Table 55. Asia-Pacific Production Quality Analytics (PQA) Market Size by Region (2026-2031) & (US$ Million)
Table 56. Latin America Production Quality Analytics (PQA) Market Size Growth Rate by Country (US$ Million): 2020 VS 2024 VS 2031
Table 57. Latin America Production Quality Analytics (PQA) Market Size by Country (2020-2025) & (US$ Million)
Table 58. Latin America Production Quality Analytics (PQA) Market Size by Country (2026-2031) & (US$ Million)
Table 59. Middle East & Africa Production Quality Analytics (PQA) Market Size Growth Rate by Country (US$ Million): 2020 VS 2024 VS 2031
Table 60. Middle East & Africa Production Quality Analytics (PQA) Market Size by Country (2020-2025) & (US$ Million)
Table 61. Middle East & Africa Production Quality Analytics (PQA) Market Size by Country (2026-2031) & (US$ Million)
Table 62. SAS Institute Inc Company Details
Table 63. SAS Institute Inc Business Overview
Table 64. SAS Institute Inc Production Quality Analytics (PQA) Product
Table 65. SAS Institute Inc Revenue in Production Quality Analytics (PQA) Business (2020-2025) & (US$ Million)
Table 66. SAS Institute Inc Recent Development
Table 67. Pinnacle Solutions, Inc. Company Details
Table 68. Pinnacle Solutions, Inc. Business Overview
Table 69. Pinnacle Solutions, Inc. Production Quality Analytics (PQA) Product
Table 70. Pinnacle Solutions, Inc. Revenue in Production Quality Analytics (PQA) Business (2020-2025) & (US$ Million)
Table 71. Pinnacle Solutions, Inc. Recent Development
Table 72. Qarma Company Details
Table 73. Qarma Business Overview
Table 74. Qarma Production Quality Analytics (PQA) Product
Table 75. Qarma Revenue in Production Quality Analytics (PQA) Business (2020-2025) & (US$ Million)
Table 76. Qarma Recent Development
Table 77. Siemens Company Details
Table 78. Siemens Business Overview
Table 79. Siemens Production Quality Analytics (PQA) Product
Table 80. Siemens Revenue in Production Quality Analytics (PQA) Business (2020-2025) & (US$ Million)
Table 81. Siemens Recent Development
Table 82. AWS Company Details
Table 83. AWS Business Overview
Table 84. AWS Production Quality Analytics (PQA) Product
Table 85. AWS Revenue in Production Quality Analytics (PQA) Business (2020-2025) & (US$ Million)
Table 86. AWS Recent Development
Table 87. QualityLine Company Details
Table 88. QualityLine Business Overview
Table 89. QualityLine Production Quality Analytics (PQA) Product
Table 90. QualityLine Revenue in Production Quality Analytics (PQA) Business (2020-2025) & (US$ Million)
Table 91. QualityLine Recent Development
Table 92. TT PSC Company Details
Table 93. TT PSC Business Overview
Table 94. TT PSC Production Quality Analytics (PQA) Product
Table 95. TT PSC Revenue in Production Quality Analytics (PQA) Business (2020-2025) & (US$ Million)
Table 96. TT PSC Recent Development
Table 97. Oden Company Details
Table 98. Oden Business Overview
Table 99. Oden Production Quality Analytics (PQA) Product
Table 100. Oden Revenue in Production Quality Analytics (PQA) Business (2020-2025) & (US$ Million)
Table 101. Oden Recent Development
Table 102. Craftworks Company Details
Table 103. Craftworks Business Overview
Table 104. Craftworks Production Quality Analytics (PQA) Product
Table 105. Craftworks Revenue in Production Quality Analytics (PQA) Business (2020-2025) & (US$ Million)
Table 106. Craftworks Recent Development
Table 107. Vanti AI Company Details
Table 108. Vanti AI Business Overview
Table 109. Vanti AI Production Quality Analytics (PQA) Product
Table 110. Vanti AI Revenue in Production Quality Analytics (PQA) Business (2020-2025) & (US$ Million)
Table 111. Vanti AI Recent Development
Table 112. QDA-Solutions Company Details
Table 113. QDA-Solutions Business Overview
Table 114. QDA-Solutions Production Quality Analytics (PQA) Product
Table 115. QDA-Solutions Revenue in Production Quality Analytics (PQA) Business (2020-2025) & (US$ Million)
Table 116. QDA-Solutions Recent Development
Table 117. Acerta Analytics Solutions Company Details
Table 118. Acerta Analytics Solutions Business Overview
Table 119. Acerta Analytics Solutions Production Quality Analytics (PQA) Product
Table 120. Acerta Analytics Solutions Revenue in Production Quality Analytics (PQA) Business (2020-2025) & (US$ Million)
Table 121. Acerta Analytics Solutions Recent Development
Table 122. Matics Manufacturing Analytics Company Details
Table 123. Matics Manufacturing Analytics Business Overview
Table 124. Matics Manufacturing Analytics Production Quality Analytics (PQA) Product
Table 125. Matics Manufacturing Analytics Revenue in Production Quality Analytics (PQA) Business (2020-2025) & (US$ Million)
Table 126. Matics Manufacturing Analytics Recent Development
Table 127. Precognize Company Details
Table 128. Precognize Business Overview
Table 129. Precognize Production Quality Analytics (PQA) Product
Table 130. Precognize Revenue in Production Quality Analytics (PQA) Business (2020-2025) & (US$ Million)
Table 131. Precognize Recent Development
Table 132. Aegasis Labs Company Details
Table 133. Aegasis Labs Business Overview
Table 134. Aegasis Labs Production Quality Analytics (PQA) Product
Table 135. Aegasis Labs Revenue in Production Quality Analytics (PQA) Business (2020-2025) & (US$ Million)
Table 136. Aegasis Labs Recent Development
Table 137. ARDICTECH Company Details
Table 138. ARDICTECH Business Overview
Table 139. ARDICTECH Production Quality Analytics (PQA) Product
Table 140. ARDICTECH Revenue in Production Quality Analytics (PQA) Business (2020-2025) & (US$ Million)
Table 141. ARDICTECH Recent Development
Table 142. Cerexio Company Details
Table 143. Cerexio Business Overview
Table 144. Cerexio Production Quality Analytics (PQA) Product
Table 145. Cerexio Revenue in Production Quality Analytics (PQA) Business (2020-2025) & (US$ Million)
Table 146. Cerexio Recent Development
Table 147. Katulu Company Details
Table 148. Katulu Business Overview
Table 149. Katulu Production Quality Analytics (PQA) Product
Table 150. Katulu Revenue in Production Quality Analytics (PQA) Business (2020-2025) & (US$ Million)
Table 151. Katulu Recent Development
Table 152. Fero Labs Company Details
Table 153. Fero Labs Business Overview
Table 154. Fero Labs Production Quality Analytics (PQA) Product
Table 155. Fero Labs Revenue in Production Quality Analytics (PQA) Business (2020-2025) & (US$ Million)
Table 156. Fero Labs Recent Development
Table 157. IBM Company Details
Table 158. IBM Business Overview
Table 159. IBM Production Quality Analytics (PQA) Product
Table 160. IBM Revenue in Production Quality Analytics (PQA) Business (2020-2025) & (US$ Million)
Table 161. IBM Recent Development
Table 162. Praxie Company Details
Table 163. Praxie Business Overview
Table 164. Praxie Production Quality Analytics (PQA) Product
Table 165. Praxie Revenue in Production Quality Analytics (PQA) Business (2020-2025) & (US$ Million)
Table 166. Praxie Recent Development
Table 167. IoTco Company Details
Table 168. IoTco Business Overview
Table 169. IoTco Production Quality Analytics (PQA) Product
Table 170. IoTco Revenue in Production Quality Analytics (PQA) Business (2020-2025) & (US$ Million)
Table 171. IoTco Recent Development
Table 172. IconPro Company Details
Table 173. IconPro Business Overview
Table 174. IconPro Production Quality Analytics (PQA) Product
Table 175. IconPro Revenue in Production Quality Analytics (PQA) Business (2020-2025) & (US$ Million)
Table 176. IconPro Recent Development
Table 177. Gramener Company Details
Table 178. Gramener Business Overview
Table 179. Gramener Production Quality Analytics (PQA) Product
Table 180. Gramener Revenue in Production Quality Analytics (PQA) Business (2020-2025) & (US$ Million)
Table 181. Gramener Recent Development
Table 182. Research Programs/Design for This Report
Table 183. Key Data Information from Secondary Sources
Table 184. Key Data Information from Primary Sources
Table 185. Authors List of This Report
List of Figures
Figure 1. Production Quality Analytics (PQA) Picture
Figure 2. Global Production Quality Analytics (PQA) Market Size Comparison by Type (2020-2031) & (US$ Million)
Figure 3. Global Production Quality Analytics (PQA) Market Share by Type: 2024 VS 2031
Figure 4. Defect Detection & Classification Features
Figure 5. Process Capability Analysis Features
Figure 6. Predictive Quality Analytics Features
Figure 7. Compliance & Audit Analytics Features
Figure 8. Root Cause Analysis (RCA) Analytics Features
Figure 9. Supplier Quality Analytics Features
Figure 10. Global Production Quality Analytics (PQA) Market Size Comparison by Data Sources (Input Data Type) (2020-2031) & (US$ Million)
Figure 11. Sensor & IoT Data Analytics Features
Figure 12. Visual Data Analytics Features
Figure 13. Transactional & ERP Data Analytics Features
Figure 14. Human-Generated Data Analytics Features
Figure 15. Supply Chain Data Analytics Features
Figure 16. Global Production Quality Analytics (PQA) Market Size Comparison by Analytical Methodologies (Technical Approach) (2020-2031) & (US$ Million)
Figure 17. Descriptive Analytics Features
Figure 18. Diagnostic Analytics Features
Figure 19. Predictive Analytics Features
Figure 20. Prescriptive Analytics Features
Figure 21. AI/Deep Learning Analytics Features
Figure 22. Global Production Quality Analytics (PQA) Market Size by Application (2020-2031) & (US$ Million)
Figure 23. Global Production Quality Analytics (PQA) Market Share by Application: 2024 VS 2031
Figure 24. Pre-Production Quality Analytics Case Studies
Figure 25. In-Production Quality Analytics Case Studies
Figure 26. Post-Production Quality Analytics Case Studies
Figure 27. Lifecycle Quality Analytics Case Studies
Figure 28. Production Quality Analytics (PQA) Report Years Considered
Figure 29. Global Production Quality Analytics (PQA) Market Size (US$ Million), Year-over-Year: 2020-2031
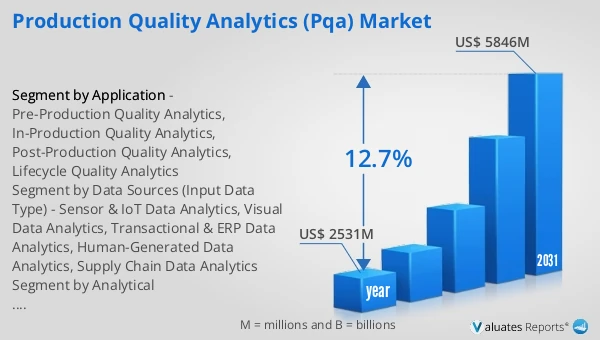
Figure 30. Global Production Quality Analytics (PQA) Market Size, (US$ Million), 2020 VS 2024 VS 2031
Figure 31. Global Production Quality Analytics (PQA) Market Share by Region: 2024 VS 2031
Figure 32. Global Production Quality Analytics (PQA) Market Share by Players in 2024
Figure 33. Global Production Quality Analytics (PQA) Market Share by Company Type (Tier 1, Tier 2, and Tier 3)
Figure 34. The Top 10 and 5 Players Market Share by Production Quality Analytics (PQA) Revenue in 2024
Figure 35. North America Production Quality Analytics (PQA) Market Size YoY Growth (2020-2031) & (US$ Million)
Figure 36. North America Production Quality Analytics (PQA) Market Share by Country (2020-2031)
Figure 37. United States Production Quality Analytics (PQA) Market Size YoY Growth (2020-2031) & (US$ Million)
Figure 38. Canada Production Quality Analytics (PQA) Market Size YoY Growth (2020-2031) & (US$ Million)
Figure 39. Europe Production Quality Analytics (PQA) Market Size YoY Growth (2020-2031) & (US$ Million)
Figure 40. Europe Production Quality Analytics (PQA) Market Share by Country (2020-2031)
Figure 41. Germany Production Quality Analytics (PQA) Market Size YoY Growth (2020-2031) & (US$ Million)
Figure 42. France Production Quality Analytics (PQA) Market Size YoY Growth (2020-2031) & (US$ Million)
Figure 43. U.K. Production Quality Analytics (PQA) Market Size YoY Growth (2020-2031) & (US$ Million)
Figure 44. Italy Production Quality Analytics (PQA) Market Size YoY Growth (2020-2031) & (US$ Million)
Figure 45. Russia Production Quality Analytics (PQA) Market Size YoY Growth (2020-2031) & (US$ Million)
Figure 46. Ireland Production Quality Analytics (PQA) Market Size YoY Growth (2020-2031) & (US$ Million)
Figure 47. Asia-Pacific Production Quality Analytics (PQA) Market Size YoY Growth (2020-2031) & (US$ Million)
Figure 48. Asia-Pacific Production Quality Analytics (PQA) Market Share by Region (2020-2031)
Figure 49. China Production Quality Analytics (PQA) Market Size YoY Growth (2020-2031) & (US$ Million)
Figure 50. Japan Production Quality Analytics (PQA) Market Size YoY Growth (2020-2031) & (US$ Million)
Figure 51. South Korea Production Quality Analytics (PQA) Market Size YoY Growth (2020-2031) & (US$ Million)
Figure 52. Southeast Asia Production Quality Analytics (PQA) Market Size YoY Growth (2020-2031) & (US$ Million)
Figure 53. India Production Quality Analytics (PQA) Market Size YoY Growth (2020-2031) & (US$ Million)
Figure 54. Australia & New Zealand Production Quality Analytics (PQA) Market Size YoY Growth (2020-2031) & (US$ Million)
Figure 55. Latin America Production Quality Analytics (PQA) Market Size YoY Growth (2020-2031) & (US$ Million)
Figure 56. Latin America Production Quality Analytics (PQA) Market Share by Country (2020-2031)
Figure 57. Mexico Production Quality Analytics (PQA) Market Size YoY Growth (2020-2031) & (US$ Million)
Figure 58. Brazil Production Quality Analytics (PQA) Market Size YoY Growth (2020-2031) & (US$ Million)
Figure 59. Middle East & Africa Production Quality Analytics (PQA) Market Size YoY Growth (2020-2031) & (US$ Million)
Figure 60. Middle East & Africa Production Quality Analytics (PQA) Market Share by Country (2020-2031)
Figure 61. Israel Production Quality Analytics (PQA) Market Size YoY Growth (2020-2031) & (US$ Million)
Figure 62. Saudi Arabia Production Quality Analytics (PQA) Market Size YoY Growth (2020-2031) & (US$ Million)
Figure 63. UAE Production Quality Analytics (PQA) Market Size YoY Growth (2020-2031) & (US$ Million)
Figure 64. SAS Institute Inc Revenue Growth Rate in Production Quality Analytics (PQA) Business (2020-2025)
Figure 65. Pinnacle Solutions, Inc. Revenue Growth Rate in Production Quality Analytics (PQA) Business (2020-2025)
Figure 66. Qarma Revenue Growth Rate in Production Quality Analytics (PQA) Business (2020-2025)
Figure 67. Siemens Revenue Growth Rate in Production Quality Analytics (PQA) Business (2020-2025)
Figure 68. AWS Revenue Growth Rate in Production Quality Analytics (PQA) Business (2020-2025)
Figure 69. QualityLine Revenue Growth Rate in Production Quality Analytics (PQA) Business (2020-2025)
Figure 70. TT PSC Revenue Growth Rate in Production Quality Analytics (PQA) Business (2020-2025)
Figure 71. Oden Revenue Growth Rate in Production Quality Analytics (PQA) Business (2020-2025)
Figure 72. Craftworks Revenue Growth Rate in Production Quality Analytics (PQA) Business (2020-2025)
Figure 73. Vanti AI Revenue Growth Rate in Production Quality Analytics (PQA) Business (2020-2025)
Figure 74. QDA-Solutions Revenue Growth Rate in Production Quality Analytics (PQA) Business (2020-2025)
Figure 75. Acerta Analytics Solutions Revenue Growth Rate in Production Quality Analytics (PQA) Business (2020-2025)
Figure 76. Matics Manufacturing Analytics Revenue Growth Rate in Production Quality Analytics (PQA) Business (2020-2025)
Figure 77. Precognize Revenue Growth Rate in Production Quality Analytics (PQA) Business (2020-2025)
Figure 78. Aegasis Labs Revenue Growth Rate in Production Quality Analytics (PQA) Business (2020-2025)
Figure 79. ARDICTECH Revenue Growth Rate in Production Quality Analytics (PQA) Business (2020-2025)
Figure 80. Cerexio Revenue Growth Rate in Production Quality Analytics (PQA) Business (2020-2025)
Figure 81. Katulu Revenue Growth Rate in Production Quality Analytics (PQA) Business (2020-2025)
Figure 82. Fero Labs Revenue Growth Rate in Production Quality Analytics (PQA) Business (2020-2025)
Figure 83. IBM Revenue Growth Rate in Production Quality Analytics (PQA) Business (2020-2025)
Figure 84. Praxie Revenue Growth Rate in Production Quality Analytics (PQA) Business (2020-2025)
Figure 85. IoTco Revenue Growth Rate in Production Quality Analytics (PQA) Business (2020-2025)
Figure 86. IconPro Revenue Growth Rate in Production Quality Analytics (PQA) Business (2020-2025)
Figure 87. Gramener Revenue Growth Rate in Production Quality Analytics (PQA) Business (2020-2025)
Figure 88. Bottom-up and Top-down Approaches for This Report
Figure 89. Data Triangulation
Figure 90. Key Executives Interviewed