FEATURED COMPANIES
Bayer
Rifa Pharma
Hubei Goto Biopharm
Saituo Biological Technology
4-Androstenedione API Market Size
The global market for 4-Androstenedione API was valued at US$ 63.00 million in the year 2024 and is projected to reach a revised size of US$ 77.89 million by 2031, growing at a CAGR of 2.8% during the forecast period.
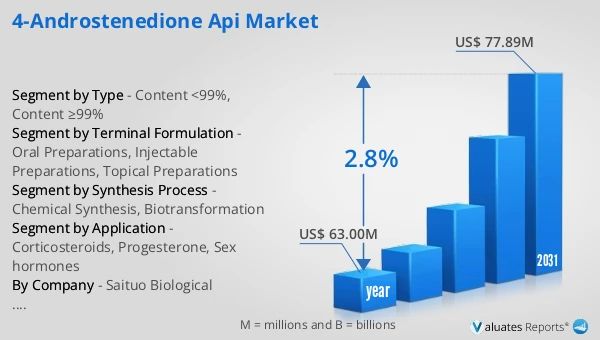
4-Androstenedione API Market
The 2025 U.S. tariff policies introduce profound uncertainty into the global economic landscape. This report critically examines the implications of recent tariff adjustments and international strategic countermeasures on 4-Androstenedione API competitive dynamics, regional economic interdependencies, and supply chain reconfigurations.
4-androstenedione, or androstenedione (abbreviated as A4 or Δ4-dione), also known as androst-4-ene-3,17-dione, is an endogenous weak androgen steroid hormone and intermediate in the biosynthesis of estrone and of testosterone from dehydroepiandrosterone (DHEA).
In 2024, global production of 4-androstenedione reached 1,457 tons, with an average selling price of US$43.5/kg and a production capacity of approximately 3,000 tons. The industry's gross profit margin was approximately 10%–20%. Cost structure: Direct materials accounted for approximately 70%, manufacturing costs for approximately 23%, and labor costs for approximately 7%. Industry chain: Upstream main raw materials include phytosterols and soybean oil fatty acids, while downstream products are steroidal drug raw materials, including corticosteroids, progestins, and sex hormones.
The global market for 4-Androstenedione API is experiencing steady growth, driven primarily by its essential role as a key intermediate in the synthesis of various steroid hormones and pharmaceuticals. The production landscape is relatively concentrated, with major players like Tianjin Jin Yao Group, BIOVET, and Indo Phyto Chemicals dominating the market share. A significant portion of global manufacturing is situated in the Asia-Pacific region, particularly in China. This growth, however, is tempered by several challenges. The market faces headwinds from evolving international trade policies and rising tariff barriers, which complicate supply chains and increase export costs for producers. Furthermore, the industry must continuously adapt to stringent and increasingly rigorous environmental regulations and quality compliance standards across different regions. The future trajectory of the market will likely be determined by how effectively manufacturers navigate these regulatory complexities while pursuing technological advancements and operational efficiency.
Report Scope
This report aims to provide a comprehensive presentation of the global market for 4-Androstenedione API, with both quantitative and qualitative analysis, to help readers develop business/growth strategies, assess the market competitive situation, analyze their position in the current marketplace, and make informed business decisions regarding 4-Androstenedione API.
The 4-Androstenedione API market size, estimations, and forecasts are provided in terms of sales volume (Tons) and revenue ($ millions), considering 2024 as the base year, with history and forecast data for the period from 2020 to 2031. This report segments the global 4-Androstenedione API market comprehensively. Regional market sizes, concerning products by Type, by Application, by Terminal Formulation and by players, are also provided.
For a more in-depth understanding of the market, the report provides profiles of the competitive landscape, key competitors, and their respective market ranks. The report also discusses technological trends and new product developments.
The report will help the 4-Androstenedione API manufacturers, new entrants, and industry chain related companies in this market with information on the revenues, sales volume, and average price for the overall market and the sub-segments across the different segments, by company, by Type, by Application, by Terminal Formulation and by regions.
Scope of 4-Androstenedione API Market Report
| Report Metric |
Details |
| Report Name |
4-Androstenedione API Market |
| Accounted market size in year |
US$ 63.00 million |
| Forecasted market size in 2031 |
US$ 77.89 million |
| CAGR |
2.8% |
| Base Year |
year |
| Forecasted years |
2026 - 2031 |
| Segment by Type |
- Content <99%
- Content ≥99%
|
| Segment by Terminal Formulation |
- Oral Preparations
- Injectable Preparations
- Topical Preparations
|
| Segment by Synthesis Process |
- Chemical Synthesis
- Biotransformation
|
| Segment by Application |
- Corticosteroids
- Progesterone
- Sex hormones
|
| Consumption by Region |
- North America (United States, Canada)
- Europe (Germany, France, UK, Italy, Russia)
- Asia-Pacific (China, Japan, South Korea, Taiwan)
- Southeast Asia (India)
- Latin America (Mexico, Brazil)
|
| By Company |
Saituo Biological Technology, Hubei Goto Biopharm, Bayer, Rifa Pharma |
| Forecast units |
USD million in value |
| Report coverage |
Revenue and volume forecast, company share, competitive landscape, growth factors and trends |
Core Chapters
- Chapter 1: Introduces the report scope of the report, executive summary of different market segments (by region, product type, application, etc), including the market size of each market segment, future development potential, and so on. It offers a high-level view of the current state of the market and its likely evolution in the short to mid-term, and long term.
- Chapter 2: Detailed analysis of 4-Androstenedione API manufacturers competitive landscape, price, sales and revenue market share, latest development plan, merger, and acquisition information, etc.
- Chapter 3: Sales, revenue of 4-Androstenedione API in regional level and country level. It provides a quantitative analysis of the market size and development potential of each region and its main countries and introduces the market development, future development prospects, market space, and market size of each country in the world.
- Chapter 4: Provides the analysis of various market segments by Type, covering the market size and development potential of each market segment, to help readers find the blue ocean market in different market segments.
- Chapter 5: Provides the analysis of various market segments by Application, covering the market size and development potential of each market segment, to help readers find the blue ocean market in different downstream markets.
- Chapter 6: Provides profiles of key players, introducing the basic situation of the main companies in the market in detail, including product sales, revenue, price, gross margin, product introduction, recent development, etc.
- Chapter 7: Analysis of industrial chain, including the upstream and downstream of the industry.
- Chapter 8: Introduces the market dynamics, latest developments of the market, the driving factors and restrictive factors of the market, the challenges and risks faced by manufacturers in the industry, and the analysis of relevant policies in the industry.
- Chapter 9: The main points and conclusions of the report.
FAQ for this report
How fast is 4-Androstenedione API Market growing?
Ans: The 4-Androstenedione API Market witnessing a CAGR of 2.8% during the forecast period 2026-2031.
What is the 4-Androstenedione API Market size in 2031?
Ans: The 4-Androstenedione API Market size in 2031 will be US$ 77.89 million.
Who are the main players in the 4-Androstenedione API Market report?
Ans: The main players in the 4-Androstenedione API Market are Saituo Biological Technology, Hubei Goto Biopharm, Bayer, Rifa Pharma
What are the Application segmentation covered in the 4-Androstenedione API Market report?
Ans: The Applications covered in the 4-Androstenedione API Market report are Corticosteroids, Progesterone, Sex hormones
What are the Type segmentation covered in the 4-Androstenedione API Market report?
Ans: The Types covered in the 4-Androstenedione API Market report are Content <99%, Content ≥99%
FEATURED COMPANIES
Bayer
Rifa Pharma
Hubei Goto Biopharm
Saituo Biological Technology

