List of Tables
Table 1. Hyperbaric Oxygen Therapy (HBOT) Devices & Equipment CAGR in Value, India VS Global, 2018 VS 2022 VS 2029
Table 2. Hyperbaric Oxygen Therapy (HBOT) Devices & Equipment Market Trends
Table 3. Hyperbaric Oxygen Therapy (HBOT) Devices & Equipment Market Drivers
Table 4. Hyperbaric Oxygen Therapy (HBOT) Devices & Equipment Market Challenges
Table 5. Hyperbaric Oxygen Therapy (HBOT) Devices & Equipment Market Restraints
Table 6. Global Hyperbaric Oxygen Therapy (HBOT) Devices & Equipment Sales Growth Rate (CAGR) by Product: 2018 VS 2022 VS 2029 (US$ Million)
Table 7. India Hyperbaric Oxygen Therapy (HBOT) Devices & Equipment Sales Growth Rate (CAGR) by Product: 2018 VS 2022 VS 2029 (US$ Million)
Table 8. Global Hyperbaric Oxygen Therapy (HBOT) Devices & Equipment Sales Growth Rate (CAGR) by End Use: 2018 VS 2022 VS 2029 (US$ Million)
Table 9. India Hyperbaric Oxygen Therapy (HBOT) Devices & Equipment Sales Growth Rate (CAGR) by End Use: 2018 VS 2022 VS 2029 (US$ Million)
Table 10. Global Key Manufacturers of Hyperbaric Oxygen Therapy (HBOT) Devices & Equipment, Ranked by Revenue (2022) & (US$ Million)
Table 11. Global Hyperbaric Oxygen Therapy (HBOT) Devices & Equipment Revenue by Manufacturer, (US$ Million), 2018-2023
Table 12. Global Hyperbaric Oxygen Therapy (HBOT) Devices & Equipment Revenue Share by Manufacturer, 2018-2023
Table 13. Global Hyperbaric Oxygen Therapy (HBOT) Devices & Equipment Sales by Manufacturer, (Units), 2018-2023
Table 14. Global Hyperbaric Oxygen Therapy (HBOT) Devices & Equipment Sales Share by Manufacturer, 2018-2023
Table 15. Global Hyperbaric Oxygen Therapy (HBOT) Devices & Equipment Price by Manufacturer (2018-2023) & (K USD/Unit)
Table 16. Global Hyperbaric Oxygen Therapy (HBOT) Devices & Equipment Manufacturers Market Concentration Ratio (CR5 and HHI)
Table 17. Global Hyperbaric Oxygen Therapy (HBOT) Devices & Equipment by Company Type (Tier 1, Tier 2, and Tier 3) & (based on the Revenue in Hyperbaric Oxygen Therapy (HBOT) Devices & Equipment as of 2022)
Table 18. Global Key Manufacturers of Hyperbaric Oxygen Therapy (HBOT) Devices & Equipment, Manufacturing Base Distribution and Headquarters
Table 19. Global Key Manufacturers of Hyperbaric Oxygen Therapy (HBOT) Devices & Equipment, Product Offered and Application
Table 20. Global Key Manufacturers of Hyperbaric Oxygen Therapy (HBOT) Devices & Equipment, Date of Enter into This Industry
Table 21. Manufacturers Mergers & Acquisitions, Expansion Plans
Table 22. Key Players of Hyperbaric Oxygen Therapy (HBOT) Devices & Equipment in India, Ranked by Revenue (2022) & (US$ million)
Table 23. India Hyperbaric Oxygen Therapy (HBOT) Devices & Equipment Revenue by Players, (US$ Million), (2018-2023)
Table 24. India Hyperbaric Oxygen Therapy (HBOT) Devices & Equipment Revenue Share by Players, (2018-2023)
Table 25. India Hyperbaric Oxygen Therapy (HBOT) Devices & Equipment Sales by Players, (Units), (2018-2023)
Table 26. India Hyperbaric Oxygen Therapy (HBOT) Devices & Equipment Sales Share by Players, (2018-2023)
Table 27. Global Hyperbaric Oxygen Therapy (HBOT) Devices & Equipment Market Size Growth Rate (CAGR) by Region (US$ Million): 2018 VS 2022 VS 2029
Table 28. Global Hyperbaric Oxygen Therapy (HBOT) Devices & Equipment Sales in Volume by Region (2018-2023) & (Units)
Table 29. Global Hyperbaric Oxygen Therapy (HBOT) Devices & Equipment Sales in Volume Forecast by Region (2024-2029) & (Units)
Table 30. Global Hyperbaric Oxygen Therapy (HBOT) Devices & Equipment Sales in Value by Region (2018-2023) & (US$ Million)
Table 31. Global Hyperbaric Oxygen Therapy (HBOT) Devices & Equipment Sales in Value Forecast by Region (2024-2029) & (US$ Million)
Table 32. Americas Hyperbaric Oxygen Therapy (HBOT) Devices & Equipment Market Size Growth Rate (CAGR) by Country (US$ Million): 2018 VS 2022 VS 2029
Table 33. Americas Hyperbaric Oxygen Therapy (HBOT) Devices & Equipment Sales in Value by Country (2018-2023) & (US$ Million)
Table 34. Americas Hyperbaric Oxygen Therapy (HBOT) Devices & Equipment Sales in Value by Country (2024-2029) & (US$ Million)
Table 35. Americas Hyperbaric Oxygen Therapy (HBOT) Devices & Equipment Sales in Volume by Country (2018-2023) & (Units)
Table 36. Americas Hyperbaric Oxygen Therapy (HBOT) Devices & Equipment Sales in Volume by Country (2024-2029) & (Units)
Table 37. EMEA Hyperbaric Oxygen Therapy (HBOT) Devices & Equipment Market Size Growth Rate (CAGR) by Country (US$ Million): 2018 VS 2022 VS 2029
Table 38. EMEA Hyperbaric Oxygen Therapy (HBOT) Devices & Equipment Sales in Value by Country (2018-2023) & (US$ Million)
Table 39. EMEA Hyperbaric Oxygen Therapy (HBOT) Devices & Equipment Sales in Value by Country (2024-2029) & (US$ Million)
Table 40. EMEA Hyperbaric Oxygen Therapy (HBOT) Devices & Equipment Sales in Volume by Country (2018-2023) & (Units)
Table 41. EMEA Hyperbaric Oxygen Therapy (HBOT) Devices & Equipment Sales in Volume by Country (2024-2029) & (Units)
Table 42. APAC Hyperbaric Oxygen Therapy (HBOT) Devices & Equipment Market Size Growth Rate (CAGR) by Country (US$ Million): 2018 VS 2022 VS 2029
Table 43. APAC Hyperbaric Oxygen Therapy (HBOT) Devices & Equipment Sales in Value by Country (2018-2023) & (US$ Million)
Table 44. APAC Hyperbaric Oxygen Therapy (HBOT) Devices & Equipment Sales in Value by Country (2024-2029) & (US$ Million)
Table 45. APAC Hyperbaric Oxygen Therapy (HBOT) Devices & Equipment Sales in Volume by Country (2018-2023) & (Units)
Table 46. APAC Hyperbaric Oxygen Therapy (HBOT) Devices & Equipment Sales in Volume by Country (2024-2029) & (Units)
Table 47. Perry Baromedical Corporation Company Information
Table 48. Perry Baromedical Corporation Description and Business Overview
Table 49. Perry Baromedical Corporation Hyperbaric Oxygen Therapy (HBOT) Devices & Equipment Sales (Units), Revenue (US$ Million), Price (K USD/Unit) and Gross Margin (2018-2023)
Table 50. Perry Baromedical Corporation Hyperbaric Oxygen Therapy (HBOT) Devices & Equipment Product
Table 51. Perry Baromedical Corporation Recent Development
Table 52. Sechrist Industries, Inc. Company Information
Table 53. Sechrist Industries, Inc. Description and Business Overview
Table 54. Sechrist Industries, Inc. Hyperbaric Oxygen Therapy (HBOT) Devices & Equipment Sales (Units), Revenue (US$ Million), Price (K USD/Unit) and Gross Margin (2018-2023)
Table 55. Sechrist Industries, Inc. Hyperbaric Oxygen Therapy (HBOT) Devices & Equipment Product
Table 56. Sechrist Industries, Inc. Recent Development
Table 57. Tekna Manufacturing Company Information
Table 58. Tekna Manufacturing Description and Business Overview
Table 59. Tekna Manufacturing Hyperbaric Oxygen Therapy (HBOT) Devices & Equipment Sales (Units), Revenue (US$ Million), Price (K USD/Unit) and Gross Margin (2018-2023)
Table 60. Tekna Manufacturing Hyperbaric Oxygen Therapy (HBOT) Devices & Equipment Product
Table 61. Tekna Manufacturing Recent Development
Table 62. ETC Company Information
Table 63. ETC Description and Business Overview
Table 64. ETC Hyperbaric Oxygen Therapy (HBOT) Devices & Equipment Sales (Units), Revenue (US$ Million), Price (K USD/Unit) and Gross Margin (2018-2023)
Table 65. ETC Hyperbaric Oxygen Therapy (HBOT) Devices & Equipment Product
Table 66. ETC Recent Development
Table 67. Pan-America Hyperbarics, Inc. Company Information
Table 68. Pan-America Hyperbarics, Inc. Description and Business Overview
Table 69. Pan-America Hyperbarics, Inc. Hyperbaric Oxygen Therapy (HBOT) Devices & Equipment Sales (Units), Revenue (US$ Million), Price (K USD/Unit) and Gross Margin (2018-2023)
Table 70. Pan-America Hyperbarics, Inc. Hyperbaric Oxygen Therapy (HBOT) Devices & Equipment Product
Table 71. Pan-America Hyperbarics, Inc. Recent Development
Table 72. Haux-Life-Support GmbH Company Information
Table 73. Haux-Life-Support GmbH Description and Business Overview
Table 74. Haux-Life-Support GmbH Hyperbaric Oxygen Therapy (HBOT) Devices & Equipment Sales (Units), Revenue (US$ Million), Price (K USD/Unit) and Gross Margin (2018-2023)
Table 75. Haux-Life-Support GmbH Hyperbaric Oxygen Therapy (HBOT) Devices & Equipment Product
Table 76. Haux-Life-Support GmbH Recent Development
Table 77. Reimers Systems, Inc. Company Information
Table 78. Reimers Systems, Inc. Description and Business Overview
Table 79. Reimers Systems, Inc. Hyperbaric Oxygen Therapy (HBOT) Devices & Equipment Sales (Units), Revenue (US$ Million), Price (K USD/Unit) and Gross Margin (2018-2023)
Table 80. Reimers Systems, Inc. Hyperbaric Oxygen Therapy (HBOT) Devices & Equipment Product
Table 81. Reimers Systems, Inc. Recent Development
Table 82. Fink Engineering Company Information
Table 83. Fink Engineering Description and Business Overview
Table 84. Fink Engineering Hyperbaric Oxygen Therapy (HBOT) Devices & Equipment Sales (Units), Revenue (US$ Million), Price (K USD/Unit) and Gross Margin (2018-2023)
Table 85. Fink Engineering Hyperbaric Oxygen Therapy (HBOT) Devices & Equipment Product
Table 86. Fink Engineering Recent Development
Table 87. HiperTech Company Information
Table 88. HiperTech Description and Business Overview
Table 89. HiperTech Hyperbaric Oxygen Therapy (HBOT) Devices & Equipment Sales (Units), Revenue (US$ Million), Price (K USD/Unit) and Gross Margin (2018-2023)
Table 90. HiperTech Hyperbaric Oxygen Therapy (HBOT) Devices & Equipment Product
Table 91. HiperTech Recent Development
Table 92. SOS Group Company Information
Table 93. SOS Group Description and Business Overview
Table 94. SOS Group Hyperbaric Oxygen Therapy (HBOT) Devices & Equipment Sales (Units), Revenue (US$ Million), Price (K USD/Unit) and Gross Margin (2018-2023)
Table 95. SOS Group Hyperbaric Oxygen Therapy (HBOT) Devices & Equipment Product
Table 96. SOS Group Recent Development
Table 97. Moon Hyperbaric Company Information
Table 98. Moon Hyperbaric Description and Business Overview
Table 99. Moon Hyperbaric Hyperbaric Oxygen Therapy (HBOT) Devices & Equipment Sales (Units), Revenue (US$ Million), Price (K USD/Unit) and Gross Margin (2018-2023)
Table 100. Moon Hyperbaric Hyperbaric Oxygen Therapy (HBOT) Devices & Equipment Product
Table 101. Moon Hyperbaric Recent Development
Table 102. HEARMEC Company Information
Table 103. HEARMEC Description and Business Overview
Table 104. HEARMEC Hyperbaric Oxygen Therapy (HBOT) Devices & Equipment Sales (Units), Revenue (US$ Million), Price (K USD/Unit) and Gross Margin (2018-2023)
Table 105. HEARMEC Hyperbaric Oxygen Therapy (HBOT) Devices & Equipment Product
Table 106. HEARMEC Recent Development
Table 107. Royal IHC Company Information
Table 108. Royal IHC Description and Business Overview
Table 109. Royal IHC Hyperbaric Oxygen Therapy (HBOT) Devices & Equipment Sales (Units), Revenue (US$ Million), Price (K USD/Unit) and Gross Margin (2018-2023)
Table 110. Royal IHC Hyperbaric Oxygen Therapy (HBOT) Devices & Equipment Product
Table 111. Royal IHC Recent Development
Table 112. Yangcang Equipment Co., Ltd. Company Information
Table 113. Yangcang Equipment Co., Ltd. Description and Business Overview
Table 114. Yangcang Equipment Co., Ltd. Hyperbaric Oxygen Therapy (HBOT) Devices & Equipment Sales (Units), Revenue (US$ Million), Price (K USD/Unit) and Gross Margin (2018-2023)
Table 115. Yangcang Equipment Co., Ltd. Hyperbaric Oxygen Therapy (HBOT) Devices & Equipment Product
Table 116. Yangcang Equipment Co., Ltd. Recent Development
Table 117. Submarine Company Information
Table 118. Submarine Description and Business Overview
Table 119. Submarine Hyperbaric Oxygen Therapy (HBOT) Devices & Equipment Sales (Units), Revenue (US$ Million), Price (K USD/Unit) and Gross Margin (2018-2023)
Table 120. Submarine Hyperbaric Oxygen Therapy (HBOT) Devices & Equipment Product
Table 121. Submarine Recent Development
Table 122. Key Raw Materials Lists
Table 123. Raw Materials Key Suppliers Lists
Table 124. Hyperbaric Oxygen Therapy (HBOT) Devices & Equipment Customers List
Table 125. Hyperbaric Oxygen Therapy (HBOT) Devices & Equipment Distributors List
Table 126. Research Programs/Design for This Report
Table 127. Key Data Information from Secondary Sources
Table 128. Key Data Information from Primary Sources
List of Figures
Figure 1. Hyperbaric Oxygen Therapy (HBOT) Devices & Equipment Product Picture
Figure 2. Global Hyperbaric Oxygen Therapy (HBOT) Devices & Equipment Revenue, (US$ Million), 2018 VS 2022 VS 2029
Figure 3. Global Hyperbaric Oxygen Therapy (HBOT) Devices & Equipment Market Size 2018-2029 (US$ Million)
Figure 4. Global Hyperbaric Oxygen Therapy (HBOT) Devices & Equipment Sales 2018-2029 (Units)
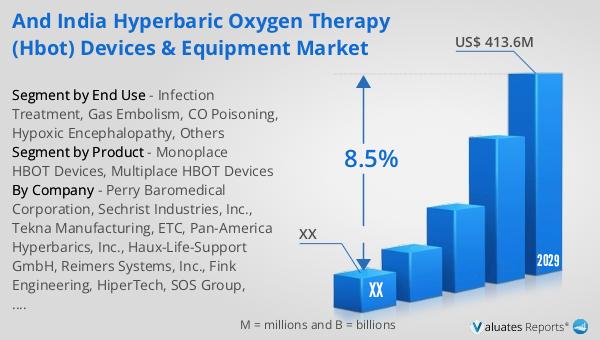
Figure 5. India Hyperbaric Oxygen Therapy (HBOT) Devices & Equipment Revenue, (US$ Million), 2018 VS 2022 VS 2029
Figure 6. India Hyperbaric Oxygen Therapy (HBOT) Devices & Equipment Market Size 2018-2029 (US$ Million)
Figure 7. India Hyperbaric Oxygen Therapy (HBOT) Devices & Equipment Sales 2018-2029 (Units)
Figure 8. India Hyperbaric Oxygen Therapy (HBOT) Devices & Equipment Market Share in Global, in Value (US$ Million) 2018-2029
Figure 9. India Hyperbaric Oxygen Therapy (HBOT) Devices & Equipment Market Share in Global, in Volume (Units) 2018-2029
Figure 10. Hyperbaric Oxygen Therapy (HBOT) Devices & Equipment Report Years Considered
Figure 11. Product Picture of Monoplace HBOT Devices
Figure 12. Product Picture of Multiplace HBOT Devices
Figure 13. Global Hyperbaric Oxygen Therapy (HBOT) Devices & Equipment Market Share by Product in 2022 & 2029
Figure 14. Global Hyperbaric Oxygen Therapy (HBOT) Devices & Equipment Sales in Value by Product (2018-2029) & (US$ Million)
Figure 15. Global Hyperbaric Oxygen Therapy (HBOT) Devices & Equipment Sales Market Share in Value by Product (2018-2029)
Figure 16. Global Hyperbaric Oxygen Therapy (HBOT) Devices & Equipment Sales by Product (2018-2029) & (Units)
Figure 17. Global Hyperbaric Oxygen Therapy (HBOT) Devices & Equipment Sales Market Share in Volume by Product (2018-2029)
Figure 18. Global Hyperbaric Oxygen Therapy (HBOT) Devices & Equipment Price by Product (2018-2029) & (K USD/Unit)
Figure 19. India Hyperbaric Oxygen Therapy (HBOT) Devices & Equipment Market Share by Product in 2022 & 2029
Figure 20. India Hyperbaric Oxygen Therapy (HBOT) Devices & Equipment Sales in Value by Product (2018-2029) & (US$ Million)
Figure 21. India Hyperbaric Oxygen Therapy (HBOT) Devices & Equipment Sales Market Share in Value by Product (2018-2029)
Figure 22. India Hyperbaric Oxygen Therapy (HBOT) Devices & Equipment Sales by Product (2018-2029) & (Units)
Figure 23. India Hyperbaric Oxygen Therapy (HBOT) Devices & Equipment Sales Market Share in Volume by Product (2018-2029)
Figure 24. India Hyperbaric Oxygen Therapy (HBOT) Devices & Equipment Price by Product (2018-2029) & (K USD/Unit)
Figure 25. Product Picture of Infection Treatment
Figure 26. Product Picture of Gas Embolism
Figure 27. Product Picture of CO Poisoning
Figure 28. Product Picture of Hypoxic Encephalopathy
Figure 29. Product Picture of Others
Figure 30. Global Hyperbaric Oxygen Therapy (HBOT) Devices & Equipment Market Share by End Use in 2022 & 2029
Figure 31. Global Hyperbaric Oxygen Therapy (HBOT) Devices & Equipment Sales in Value by End Use (2018-2029) & (US$ Million)
Figure 32. Global Hyperbaric Oxygen Therapy (HBOT) Devices & Equipment Sales Market Share in Value by End Use (2018-2029)
Figure 33. Global Hyperbaric Oxygen Therapy (HBOT) Devices & Equipment Sales by End Use (2018-2029) & (Units)
Figure 34. Global Hyperbaric Oxygen Therapy (HBOT) Devices & Equipment Sales Market Share in Volume by End Use (2018-2029)
Figure 35. Global Hyperbaric Oxygen Therapy (HBOT) Devices & Equipment Price by End Use (2018-2029) & (K USD/Unit)
Figure 36. India Hyperbaric Oxygen Therapy (HBOT) Devices & Equipment Market Share by End Use in 2022 & 2029
Figure 37. India Hyperbaric Oxygen Therapy (HBOT) Devices & Equipment Sales in Value by End Use (2018-2029) & (US$ Million)
Figure 38. India Hyperbaric Oxygen Therapy (HBOT) Devices & Equipment Sales Market Share in Value by End Use (2018-2029)
Figure 39. India Hyperbaric Oxygen Therapy (HBOT) Devices & Equipment Sales by End Use (2018-2029) & (Units)
Figure 40. India Hyperbaric Oxygen Therapy (HBOT) Devices & Equipment Sales Market Share in Volume by End Use (2018-2029)
Figure 41. India Hyperbaric Oxygen Therapy (HBOT) Devices & Equipment Price by End Use (2018-2029) & (K USD/Unit)
Figure 42. Americas Hyperbaric Oxygen Therapy (HBOT) Devices & Equipment Sales in Volume Growth Rate 2018-2029 (Units)
Figure 43. Americas Hyperbaric Oxygen Therapy (HBOT) Devices & Equipment Sales in Value Growth Rate 2018-2029 (US$ Million)
Figure 44. Americas Hyperbaric Oxygen Therapy (HBOT) Devices & Equipment Sales by Product (2018-2029) & (Units)
Figure 45. Americas Hyperbaric Oxygen Therapy (HBOT) Devices & Equipment Sales Market Share in Volume by Product (2018-2029)
Figure 46. Americas Hyperbaric Oxygen Therapy (HBOT) Devices & Equipment Sales by End Use (2018-2029) & (Units)
Figure 47. Americas Hyperbaric Oxygen Therapy (HBOT) Devices & Equipment Sales Market Share in Volume by End Use (2018-2029)
Figure 48. United States Hyperbaric Oxygen Therapy (HBOT) Devices & Equipment Sales in Value Growth Rate (2018-2029) & (US$ Million)
Figure 49. Canada Hyperbaric Oxygen Therapy (HBOT) Devices & Equipment Sales in Value Growth Rate (2018-2029) & (US$ Million)
Figure 50. Mexico Hyperbaric Oxygen Therapy (HBOT) Devices & Equipment Sales in Value Growth Rate (2018-2029) & (US$ Million)
Figure 51. Brazil Hyperbaric Oxygen Therapy (HBOT) Devices & Equipment Sales in Value Growth Rate (2018-2029) & (US$ Million)
Figure 52. EMEA Hyperbaric Oxygen Therapy (HBOT) Devices & Equipment Sales in Volume Growth Rate 2018-2029 (Units)
Figure 53. EMEA Hyperbaric Oxygen Therapy (HBOT) Devices & Equipment Sales in Value Growth Rate 2018-2029 (US$ Million)
Figure 54. EMEA Hyperbaric Oxygen Therapy (HBOT) Devices & Equipment Sales by Product (2018-2029) & (Units)
Figure 55. EMEA Hyperbaric Oxygen Therapy (HBOT) Devices & Equipment Sales Market Share in Volume by Product (2018-2029)
Figure 56. EMEA Hyperbaric Oxygen Therapy (HBOT) Devices & Equipment Sales by End Use (2018-2029) & (Units)
Figure 57. EMEA Hyperbaric Oxygen Therapy (HBOT) Devices & Equipment Sales Market Share in Volume by End Use (2018-2029)
Figure 58. Europe Hyperbaric Oxygen Therapy (HBOT) Devices & Equipment Sales in Value Growth Rate (2018-2029) & (US$ Million)
Figure 59. Middle East Hyperbaric Oxygen Therapy (HBOT) Devices & Equipment Sales in Value Growth Rate (2018-2029) & (US$ Million)
Figure 60. Africa Hyperbaric Oxygen Therapy (HBOT) Devices & Equipment Sales in Value Growth Rate (2018-2029) & (US$ Million)
Figure 61. China Hyperbaric Oxygen Therapy (HBOT) Devices & Equipment Sales in Volume Growth Rate 2018-2029 (Units)
Figure 62. China Hyperbaric Oxygen Therapy (HBOT) Devices & Equipment Sales in Value Growth Rate 2018-2029 (US$ Million)
Figure 63. China Hyperbaric Oxygen Therapy (HBOT) Devices & Equipment Sales by Product (2018-2029) & (Units)
Figure 64. China Hyperbaric Oxygen Therapy (HBOT) Devices & Equipment Sales Market Share in Volume by Product (2018-2029)
Figure 65. China Hyperbaric Oxygen Therapy (HBOT) Devices & Equipment Sales by End Use (2018-2029) & (Units)
Figure 66. China Hyperbaric Oxygen Therapy (HBOT) Devices & Equipment Sales Market Share in Volume by End Use (2018-2029)
Figure 67. APAC Hyperbaric Oxygen Therapy (HBOT) Devices & Equipment Sales in Volume Growth Rate 2018-2029 (Units)
Figure 68. APAC Hyperbaric Oxygen Therapy (HBOT) Devices & Equipment Sales in Value Growth Rate 2018-2029 (US$ Million)
Figure 69. APAC Hyperbaric Oxygen Therapy (HBOT) Devices & Equipment Sales by Product (2018-2029) & (Units)
Figure 70. APAC Hyperbaric Oxygen Therapy (HBOT) Devices & Equipment Sales Market Share in Volume by Product (2018-2029)
Figure 71. APAC Hyperbaric Oxygen Therapy (HBOT) Devices & Equipment Sales by End Use (2018-2029) & (Units)
Figure 72. APAC Hyperbaric Oxygen Therapy (HBOT) Devices & Equipment Sales Market Share in Volume by End Use (2018-2029)
Figure 73. Japan Hyperbaric Oxygen Therapy (HBOT) Devices & Equipment Sales in Value Growth Rate (2018-2029) & (US$ Million)
Figure 74. South Korea Hyperbaric Oxygen Therapy (HBOT) Devices & Equipment Sales in Value Growth Rate (2018-2029) & (US$ Million)
Figure 75. China Taiwan Hyperbaric Oxygen Therapy (HBOT) Devices & Equipment Sales in Value Growth Rate (2018-2029) & (US$ Million)
Figure 76. Southeast Asia Hyperbaric Oxygen Therapy (HBOT) Devices & Equipment Sales in Value Growth Rate (2018-2029) & (US$ Million)
Figure 77. India Hyperbaric Oxygen Therapy (HBOT) Devices & Equipment Sales in Value Growth Rate (2018-2029) & (US$ Million)
Figure 78. Hyperbaric Oxygen Therapy (HBOT) Devices & Equipment Value Chain
Figure 79. Hyperbaric Oxygen Therapy (HBOT) Devices & Equipment Production Process
Figure 80. Channels of Distribution
Figure 81. Distributors Profiles
Figure 82. Bottom-up and Top-down Approaches for This Report
Figure 83. Data Triangulation
Figure 84. Key Executives Interviewed