FEATURED COMPANIES
Hubbard-Hall
Chemours Company
Quaker Chemical Corporation
Dow Chemical Company
Eastman Chemical Company
Lincoln Chemical Corporation
Stepan Company
Spartan Chemical Company
Kyzen Corp
PCC Chemax
Elmer Wallace Ltd
Luster-On Products
Crest Chemicals
Houghton International Inc.
ZAVENIR DAUBERT
DST-Chemicals
Solvents Metal Cleaning Chemicals Market Size
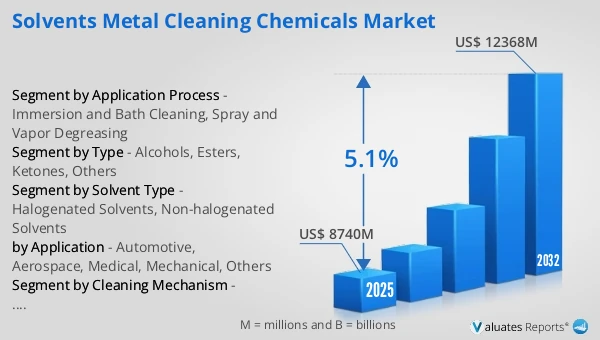
The global Solvents Metal Cleaning Chemicals market was valued at US$ 8740 million in 2025 and is anticipated to reach US$ 12368 million by 2032, at a CAGR of 5.1% from 2026 to 2032.
Solvents Metal Cleaning Chemicals Market
The 2025 U.S. tariff policies introduce profound uncertainty into the global economic landscape. This report critically examines the implications of recent tariff adjustments and international strategic countermeasures on Solvents Metal Cleaning Chemicals competitive dynamics, regional economic interdependencies, and supply chain reconfigurations.
In 2025, global output of solvents metal cleaning chemicals reached 3,800,000 tons, with an average selling price of USD 2,300 per ton, production capacity of 4,600,000 tons, and a gross margin of 34%.
Solvents metal cleaning chemicals are industrial cleaning agents primarily based on organic solvents, designed to remove oils, cutting fluid residues, waxes, rust preventives, and other organic contaminants from metal surfaces. These products achieve effective degreasing and cleaning through dissolution, dispersion, or contaminant carry-off mechanisms, offering high cleaning efficiency, fast drying, and strong adaptability to complex geometries and precision components. They are widely used in metal machining, automotive manufacturing, electronics and precision components, aerospace, and metal surface treatment applications.
The solvents metal cleaning chemicals market remains relatively stable, with demand mainly supported by ongoing production activities in traditional industrial sectors such as automotive, metal machining, and electronics manufacturing. At the same time, tightening environmental regulations are reshaping the market structure, leading to a gradual decline in halogenated solvent usage and accelerating substitution by non-halogenated, low-VOC, and recyclable solvent systems. End users increasingly prioritize cleaning efficiency, material compatibility, equipment adaptability, and regulatory compliance costs, driving a shift from single-solvent products toward customized formulations and integrated cleaning solutions. Regionally, Asia-Pacific remains the largest consumption market, while North America and Europe are characterized by regulation-driven product upgrades and replacement demand.
This report delivers a comprehensive overview of the global Solvents Metal Cleaning Chemicals market, with both quantitative and qualitative analyses, to help readers develop growth strategies, assess the competitive landscape, evaluate their position in the current market, and make informed business decisions regarding Solvents Metal Cleaning Chemicals. The Solvents Metal Cleaning Chemicals market size, estimates, and forecasts are provided in terms of output/shipments (Kiloton) and revenue (US$ millions), with 2025 as the base year and historical and forecast data for 2021–2032.
The report segments the global Solvents Metal Cleaning Chemicals market comprehensively. Regional market sizes by Type, by Application, by Solvent Type, and by company are also provided. For deeper insight, the report profiles the competitive landscape, key competitors, and their respective market rankings, and discusses technological trends and new product developments.
This report will assist Solvents Metal Cleaning Chemicals manufacturers, new entrants, and companies across the industry value chain with information on revenues, production, and average prices for the overall market and its sub-segments, by company, by Type, by Application, and by region.
Market Segmentation
Scope of Solvents Metal Cleaning Chemicals Market Report
| Report Metric |
Details |
| Report Name |
Solvents Metal Cleaning Chemicals Market |
| Accounted market size in 2025 |
US$ 8740 million |
| Forecasted market size in 2032 |
US$ 12368 million |
| CAGR |
5.1% |
| Base Year |
2025 |
| Forecasted years |
2026 - 2032 |
| Segment by Type |
- Alcohols
- Esters
- Ketones
- Others
|
| Segment by Solvent Type |
- Halogenated Solvents
- Non-halogenated Solvents
|
| Segment by Cleaning Mechanism |
- Dissolving-based Cleaning
- Chemical Reaction-based Cleaning
|
| Segment by Application Process |
- Immersion and Bath Cleaning
- Spray and Vapor Degreasing
|
| by Application |
- Automotive
- Aerospace
- Medical
- Mechanical
- Others
|
| Production by Region |
- North America
- Europe
- China
- Japan
|
| Consumption by Region |
- North America (United States, Canada)
- Europe (Germany, France, UK, Italy, Russia)
- Asia-Pacific (China, Japan, South Korea, Taiwan)
- Southeast Asia (India)
- Latin America (Mexico, Brazil)
|
| By Company |
Hubbard-Hall, Chemours Company, Quaker Chemical Corporation, Dow Chemical Company, Eastman Chemical Company, Lincoln Chemical Corporation, Stepan Company, Spartan Chemical Company, Kyzen Corp, PCC Chemax, Elmer Wallace Ltd, Luster-On Products, Crest Chemicals, Houghton International Inc, Zavenir Daubert, DST-Chemicals, Enviro Tech |
| Forecast units |
USD million in value |
| Report coverage |
Revenue and volume forecast, company share, competitive landscape, growth factors and trends |
Chapter Outline
- Chapter 1: Defines the scope of the report and presents an executive summary of market segments (by Type, by Application, by Solvent Type, etc.), including the size of each segment and its future growth potential. It offers a high-level view of the current market and its likely evolution in the short, medium, and long term.
- Chapter 2: Provides a detailed analysis of the competitive landscape for Solvents Metal Cleaning Chemicals manufacturers, including prices, production, value-based market shares, latest development plans, and information on mergers and acquisitions.
- Chapter 3: Examines Solvents Metal Cleaning Chemicals production/output and value by region and country, providing a quantitative assessment of market size and growth potential for each region over the next six years.
- Chapter 4: Analyzes Solvents Metal Cleaning Chemicals consumption at the regional and country levels. It quantifies market size and growth potential for each region and its key countries, and outlines market development, outlook, addressable space, and national production.
- Chapter 5: Analyzes market segments by Type, covering the size and growth potential of each segment to help readers identify “blue ocean” opportunities.
- Chapter 6: Analyzes market segments by Application, covering the size and growth potential of each segment to help readers identify “blue ocean” opportunities in downstream markets.
- Chapter 7: Profiles key players, detailing the fundamentals of major companies, including product production/output, value, price, gross margin, product portfolio/introductions, and recent developments.
- Chapter 8: Reviews the industry value chain, including upstream and downstream segments.
- Chapter 9: Discusses market dynamics and recent developments, including drivers, restraints, challenges and risks for manufacturers, U.S. Tariffs and relevant policy analysis.
- Chapter 10: Summarizes the key findings and conclusions of the report.
FAQ for this report
How fast is Solvents Metal Cleaning Chemicals Market growing?
Ans: The Solvents Metal Cleaning Chemicals Market witnessing a CAGR of 5.1% during the forecast period 2026-2032.
What is the Solvents Metal Cleaning Chemicals Market size in 2032?
Ans: The Solvents Metal Cleaning Chemicals Market size in 2032 will be US$ 12368 million.
Who are the main players in the Solvents Metal Cleaning Chemicals Market report?
Ans: The main players in the Solvents Metal Cleaning Chemicals Market are Hubbard-Hall, Chemours Company, Quaker Chemical Corporation, Dow Chemical Company, Eastman Chemical Company, Lincoln Chemical Corporation, Stepan Company, Spartan Chemical Company, Kyzen Corp, PCC Chemax, Elmer Wallace Ltd, Luster-On Products, Crest Chemicals, Houghton International Inc, Zavenir Daubert, DST-Chemicals, Enviro Tech
What are the Application segmentation covered in the Solvents Metal Cleaning Chemicals Market report?
Ans: The Applications covered in the Solvents Metal Cleaning Chemicals Market report are Automotive, Aerospace, Medical, Mechanical, Others
What are the Type segmentation covered in the Solvents Metal Cleaning Chemicals Market report?
Ans: The Types covered in the Solvents Metal Cleaning Chemicals Market report are Halogenated Solvents, Non-halogenated Solvents
FEATURED COMPANIES
Hubbard-Hall
Chemours Company
Quaker Chemical Corporation
Dow Chemical Company
Eastman Chemical Company
Lincoln Chemical Corporation
Stepan Company
Spartan Chemical Company
Kyzen Corp
PCC Chemax
Elmer Wallace Ltd
Luster-On Products
Crest Chemicals
Houghton International Inc.
ZAVENIR DAUBERT
DST-Chemicals

