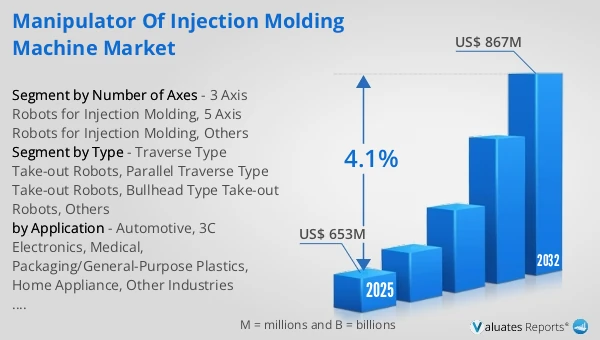
The global Manipulator of Injection Molding Machine market was valued at US$ 653 million in 2025 and is anticipated to reach US$ 867 million by 2032, at a CAGR of 4.1% from 2026 to 2032.
Manipulator of Injection Molding Machine Market
The 2025 U.S. tariff policies introduce profound uncertainty into the global economic landscape. This report critically examines the implications of recent tariff adjustments and international strategic countermeasures on Manipulator of Injection Molding Machine competitive dynamics, regional economic interdependencies, and supply chain reconfigurations.
Manipulator/robots for Injection Molding Machine (Take-out robots) are highly specialized automation equipment designed to efficiently and precisely remove molded parts or runners from the mold cavity immediately after the injection process. These robots play a critical role in improving cycle time, yield rate, and overall production consistency. Product types are generally classified based on axis configuration and control systems, including single-axis, three-axis, five-axis, and multi-degree-of-freedom servo robots. Advanced models increasingly incorporate vision systems, AI algorithms, and adaptive gripping technologies to handle complex geometries and multi-product lines. Application fields span a wide range of industries such as consumer electronics (smartphone housings, laptop casings), automotive components (bumpers, interior parts, connectors), medical devices (syringes, surgical consumables), home appliances, optical lenses, and precision engineering parts. In high-precision sectors with strict cleanliness and dimensional requirements, take-out robots have become an indispensable part of fully automated injection molding production lines.
From the consumption perspective, China is currently the world's largest consumer market, accounting for a 61.72% market share in 2025, followed by Europe and Japan with 13.11% and 6.79% respectively. It is expected that in the coming years, regions such as India and Southeast Asia will maintain the fastest growth, with their respective CAGRs reaching approximately 4.54% and 4.49% during the period of 2026-2032.
From the production perspective, China, Japan and Europe are the three major manufacturing regions, holding 49.9%, 24.8% and 20.0% of the market share in 2025 respectively. It is projected that China-manufactured robots will still register the fastest growth in the next few years.
In terms of manufacturers, the key global manufacturers in the Robots for Injection Molding Machine (Take-out robots) market mainly include Yushin Company, Alfa Industrial, Star Seiki, Wittmann, Topstar, ENGEL AUSTRIA GmbH and Haitian International, among others. The world's top five manufacturers in aggregate held a 49.47% market share in 2025.
The current development status of the global Take-out Robots industry (including special robots for injection molding machines, part removal robots, linear robots, high-speed side-entry robots, etc.) can be summarized as: "sustained rise in automation penetration, upgrading of product structure towards servo-driven and cell-based solutions, and parallel competition between injection molding machine OEMs and professional automation manufacturers". On the one hand, the robotization of the macro manufacturing industry remains at a high level: statistics from the International Federation of Robotics (IFR) show that the annual new installations of industrial robots worldwide reached approximately 542,000 units in 2024, maintaining a level of over 500,000 units for consecutive years, with Asia accounting for the largest share. This provides a sustained capital expenditure backdrop for the automation of "on-machine part removal - transfer - post-process line connection" in injection molding workshops. On the other hand, the collaboration between injection molding machines and robots is evolving from "signal interlocking" to "data interface + control coordination". EUROMAP 79 explicitly defines the data exchange interface (OPC UA information model) between injection molding machines (IMM) and robots, reflecting that the industry is adopting standardized interconnection to reduce cross-brand integration costs and improve cell delivery efficiency. In terms of competitive landscape, injection molding machine OEMs such as ENGEL and ARBURG place greater emphasis on the system delivery of "injection molding machines + automation + processes/data"; in contrast, professional automation manufacturers including Sepro, Wittmann, Yushin Company, Star Seiki, as well as leading domestic and regional Chinese manufacturers, participate in market share competition through more flexible model coverage and localized services. Overall, the market presents a parallel pattern where international brands dominate high-end system solutions, while domestic/regional brands are accelerating their penetration in the large-scale popularization and cost-effective segments.
The main line of industry trends and demand-side drivers is: "upgrading from single-machine part removal to standardized work cells, with three differentiated upgrading routes of high speed, clean production and flexibility emerging for different application scenarios". For fast-cycle scenarios such as packaging and thin-wall molding, the focus is on high-speed side-entry and high-speed top-entry robots (the core goal is to shorten mold opening waiting time and part removal paths); for the production of large and structural parts for the automotive and home appliance industries, heavy-load and long-stroke top-entry Cartesian robots are preferred (with 5-axis, dual-arm and composite end-effectors enabling stacking, sorting, inspection docking and assembly); for the 3C and medical industries, greater attention is paid to cleanliness, scratch-resistant surface finish, traceability and in-line inspection, thus driving up the supporting demand for high-precision servo control, as well as integrated vision, weighing, barcode scanning and data collection systems. In line with this trend, industry-wide interconnection standards (e.g., EUROMAP 79) are transforming robots from a single executive device into production nodes manageable by MES/ production line platforms, pushing suppliers to increase the proportion of investment in software, data, remote diagnosis and quick changeover (fixture quick change/ recipe-based parameter setting). At the same time, the high automation density in Asia, especially East Asia, is enhancing demand resilience. For example, South Korea's official investment promotion agency disclosed that its manufacturing industry has one of the highest robot densities in the world. Such structural factors will continue to underpin the medium and long-term investment intensity in injection molding automation.
In terms of risks and policy environment, the key uncertainties facing the industry mainly include: fluctuations in downstream market prosperity and capital expenditure cycles (order fluctuations in the automotive, consumer electronics, home appliance and packaging industries will quickly transmit to the expansion and transformation pace of injection molding plants); price pressure and channel inventory risks caused by intensified competition (homogenization is more prominent in the mid-to-low end segment); supply and cost fluctuations of key components (changes in delivery lead times and prices of servo systems, control units, electrical components and precision transmission parts affect production delivery); and escalating compliance and cybersecurity requirements (covering equipment safety, functional safety, data interfaces and industrial cybersecurity). On the policy front, the EU’s Machinery Regulation (EU) 2023/1230 has been issued and will take effect on 20 January 2027. It imposes more systematic compliance and technical documentation requirements on robots and automation cells entering the EU market, which objectively raises the market access threshold for low-end products and increases manufacturers' compliance costs. South Korea provides financial support (including a high proportion of cost subsidies in official terms) for enterprises' digital and automation transformation through policies such as "Smart Factory Construction Support", directly stimulating small and medium-sized manufacturing enterprises to adopt robots and automation equipment. In China, the guiding principles of the 14th Five-Year Plan for the Development of the Robot Industry emphasize high-end and intelligent development, expanding application scenarios and improving the industrial ecosystem, which provides a favorable policy environment and project opportunities for local injection molding robot manufacturers to deepen their domestic market penetration and upgrade to the mid-to-high end segments.
This report delivers a comprehensive overview of the global Manipulator of Injection Molding Machine market, with both quantitative and qualitative analyses, to help readers develop growth strategies, assess the competitive landscape, evaluate their position in the current market, and make informed business decisions regarding Manipulator of Injection Molding Machine. The Manipulator of Injection Molding Machine market size, estimates, and forecasts are provided in terms of output/shipments (Units) and revenue (US$ millions), with 2025 as the base year and historical and forecast data for 2021–2032.
The report segments the global Manipulator of Injection Molding Machine market comprehensively. Regional market sizes by Type, by Application, by Number of Axes, and by company are also provided. For deeper insight, the report profiles the competitive landscape, key competitors, and their respective market rankings, and discusses technological trends and new product developments.
This report will assist Manipulator of Injection Molding Machine manufacturers, new entrants, and companies across the industry value chain with information on revenues, production, and average prices for the overall market and its sub-segments, by company, by Type, by Application, and by region.
Market Segmentation
Scope of Manipulator of Injection Molding Machine Market Report
| Report Metric |
Details |
| Report Name |
Manipulator of Injection Molding Machine Market |
| Accounted market size in 2025 |
US$ 653 million |
| Forecasted market size in 2032 |
US$ 867 million |
| CAGR |
4.1% |
| Base Year |
2025 |
| Forecasted years |
2026 - 2032 |
| Segment by Type |
- Traverse Type Take-out Robots
- Parallel Traverse Type Take-out Robots
- Bullhead Type Take-out Robots
- Others
|
| Segment by Number of Axes |
- 3 Axis Robots for Injection Molding
- 5 Axis Robots for Injection Molding
- Others
|
| by Application |
- Automotive
- 3C Electronics
- Medical
- Packaging/General-Purpose Plastics
- Home Appliance
- Other Industries
|
| Production by Region |
|
| Consumption by Region |
- North America (United States, Canada)
- Europe (Germany, France, UK, Italy, Russia)
- Asia-Pacific (China, Japan, South Korea, Taiwan)
- Southeast Asia (India)
- Latin America (Mexico, Brazil)
|
| By Company |
Yushin Company, Alfa Industrial, Star Seiki, Wittmann, Guangdong Topstar Technology, ENGEL AUSTRIA GmbH, Haitian International, Sepro, Welllih Robot, Guangdong Dingju Intelligent Technology Co., Ltd, KEMANS, HARMO Co., Ltd., Guangdong Bo Langte intelligent equipment, Guangdong Switek Technology Co.,Ltd., Ivat Robotics Equipment Manufacturing, KraussMaffei, ARBURG GmbH, Guangdong Heeexii Robot Technology, Wemo Automation, Wetec, Hanyang Robotics |
| Forecast units |
USD million in value |
| Report coverage |
Revenue and volume forecast, company share, competitive landscape, growth factors and trends |
Chapter Outline
- Chapter 1: Defines the scope of the report and presents an executive summary of market segments (by Type, by Application, by Number of Axes, etc.), including the size of each segment and its future growth potential. It offers a high-level view of the current market and its likely evolution in the short, medium, and long term.
- Chapter 2: Provides a detailed analysis of the competitive landscape for Manipulator of Injection Molding Machine manufacturers, including prices, production, value-based market shares, latest development plans, and information on mergers and acquisitions.
- Chapter 3: Examines Manipulator of Injection Molding Machine production/output and value by region and country, providing a quantitative assessment of market size and growth potential for each region over the next six years.
- Chapter 4: Analyzes Manipulator of Injection Molding Machine consumption at the regional and country levels. It quantifies market size and growth potential for each region and its key countries, and outlines market development, outlook, addressable space, and national production.
- Chapter 5: Analyzes market segments by Type, covering the size and growth potential of each segment to help readers identify “blue ocean” opportunities.
- Chapter 6: Analyzes market segments by Application, covering the size and growth potential of each segment to help readers identify “blue ocean” opportunities in downstream markets.
- Chapter 7: Profiles key players, detailing the fundamentals of major companies, including product production/output, value, price, gross margin, product portfolio/introductions, and recent developments.
- Chapter 8: Reviews the industry value chain, including upstream and downstream segments.
- Chapter 9: Discusses market dynamics and recent developments, including drivers, restraints, challenges and risks for manufacturers, U.S. Tariffs and relevant policy analysis.
- Chapter 10: Summarizes the key findings and conclusions of the report.
Ans: From the consumption perspective, China is currently the world's largest consumer market, accounting for a 61.72% market share in 2025, followed by Europe and Japan with 13.11% and 6.79% respectively. It is expected that in the coming years, regions such as India and Southeast Asia will maintain the fastest growth, with their respective CAGRs reaching approximately 4.54% and 4.49% during the period of 2026-2032.
Ans: From the production perspective, China, Japan and Europe are the three major manufacturing regions, holding 49.9%, 24.8% and 20.0% of the market share in 2025 respectively.
Ans: The main players in the Manipulator of Injection Molding Machine Market are Yushin Company, Alfa Industrial, Star Seiki, Wittmann, Guangdong Topstar Technology, ENGEL AUSTRIA GmbH, Haitian International, Sepro, Welllih Robot, Guangdong Dingju Intelligent Technology Co., Ltd, KEMANS, HARMO Co., Ltd., Guangdong Bo Langte intelligent equipment, Guangdong Switek Technology Co.,Ltd., Ivat Robotics Equipment Manufacturing, KraussMaffei, ARBURG GmbH, Guangdong Heeexii Robot Technology, Wemo Automation, Wetec, Hanyang Robotics
Ans: The Applications covered in the Manipulator of Injection Molding Machine Market report are Automotive, 3C Electronics, Medical, Packaging/General-Purpose Plastics, Home Appliance, Other Industries
Ans: The Types covered in the Manipulator of Injection Molding Machine Market report are Traverse Type Take-out Robots, Parallel Traverse Type Take-out Robots, Bullhead Type Take-out Robots, Others