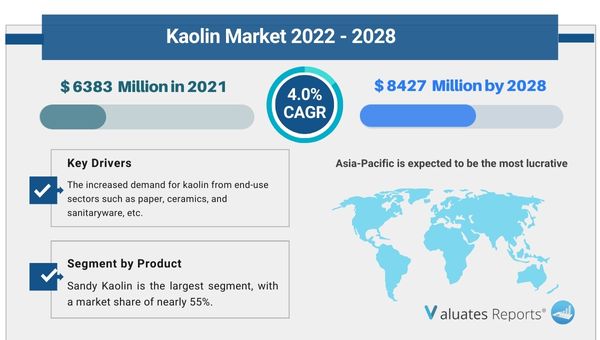
Due to the COVID-19 pandemic, the global Kaolin market size is estimated to be worth US$ 6383 million in 2021 and is forecast to a readjusted size of US$ 8427 million by 2028 with a CAGR of 4.0% during the forecast period 2022-2028. Key drivers of the kaolin market include its growing application in the paper industry.
The growing adoption of kaolin in the ceramics industry will boost the kaolin market forward in the coming years.
Kaolin has several advantageous properties making it suitable for use in the paints and coatings industry which will directly surge the demand for the market during the forecast period. The rubber industry will fuel the growth of the market in the forthcoming period. The application of kaolin in plastics will propel the growth of the market in the subsequent years.
Using kaolin in refractories will spur the market's growth in the subsequent years.
The gradual use of kaolin in cosmetics and pharmaceuticals will surge the market ahead during the forecast period.
Paper application
Kaolin is used in the manufacturing process of paper. Its particles are very fine, smooth, and have less abrasion. Kaolin is a pure color pigment that provides a smooth coating on the surface. The paper looks bright, shiny, and glossy. Printing becomes easier as ink adherence to the paper surface becomes smooth. Lint formation is decreased drastically. Moreover, it acts as a filler material for paper production. The higher the filler volume is lower the requirement for pulp. This ultimately reduces the need for extra resources like tree cutting. Kaolin is non-toxic and does not contribute in any way to environmental degradation. The clay material enhances the printable quality, light scattering characteristics, dispersion, and opacity or brightness level. These factors will bolster the growth of the kaolin market during the forecast period.
Ceramics industry
The main ingredient in ceramic applications is kaolin. As it has high consistency, and reliability the material is a crucial raw material for sanitaryware, tableware, tiles, large surfaces, electrical porcelain, or fiberglass. Specially engineered kaolins have superior rheology, casting rate, deflocculent demand, particle packing, and good production strength. Tablewares are made with the material for higher whiteness and mechanical strength along with durability. Kaolin can also be modified as per the shaping methods like intense workability, mechanical strength, lower deformation, and finer particles with low alkali content. This in turn will boost the growth of the kaolin market in the forthcoming period.
Paints
Kaolin clay is a sought-after material in the paints and coatings industry. It is used for industrial, architectural, inks, and automotive coatings. Kaolinite increases weather resistance, and film formation along with decreasing moisture release. It improves the paint quality, and performance thereby ensuring uniformity in particle distribution. This creates a glossy white finish. Furthermore, the material is a cheaper viable alternative to Titanium Dioxide. Kaolin is used extensively in machinery, equipment, metal finishing, wooden furniture, and for providing resistance against scrubs, stains, etc. Tank stability, corrosion, and film uniformity are achieved through the coating process in automobiles. The material is harmless as people can easily breathe in the powdered form of the substance without any complications or worries. Such factors will augment the growth of the kaolin market in the subsequent years.
Rubber use
Black carbon and silica were considered desirable filler materials in the rubber industry. However, they are way too expensive and have difficult structural chemical components. Kaolin comes in as a breakthrough substance as there are numerous benefits attached to it. It offers stiffness, abrasion resistance, and mechanical strength to the rubber material. Excess moisture absorption is eliminated with rising electrical insulation conductivity and heat resistance. Hydrous kaolin makes the extrusion process strong, enhances rigidity, and is an excellent filler material for rubber production. The curing time is shortened with no issue whatsoever to the strength or stretchiness of the final product. As other filler substances become unreliable and costly the demand for kaolin will rise significantly ultimately surging the growth of the kaolin market in the upcoming years.
Plastics industry
The plastic market continues to deploy kaolin in massive ways. As an anti-blocker in polyethylene or infrared absorbers in agricultural film components. Kaolin is also used for laser marking in molded packaging material. It imparts a smooth surface, dimensional stability, and chemical attack resistance. Due to having advanced rheological modifying and functional filler properties kaolin hides the fibe reinforcement patterns and avoids any shrinkage or cracks in polymer compounding or shape forming. This in turn will boost the expansion of the kaolin market during the forecast period.
Refractories
Kaolin is one of the materials used for manufacturing refractories. It is used in combination with alumina, bauxite, magnesium, and chromite. Calcified kaolin is a highly used substance as it is the perfect binder in industrial production. With high alumina content and lower cost. These factors will boost the growth of the kaolin market in the upcoming years.
Cosmetics and pharmaceuticals
The beauty industry uses kaolin clay as a skin cleanser, deodorant, in toothpaste and hair products, etc. The clay has certain beneficial properties as it is softer on the skin, and has anti-inflammatory, antibacterial, and healing properties. It sucks away excess oil, sebum, contaminants, dirt, and pollution from oily acne-prone skin. The substance detoxifies the scalp by preventing excess yeast growth and helps in neutralizing bad body odor. The pharmaceutical industry utilizes kaolin as a pelletizer, granular, disintegrant, emulsifier, particle film coating, and suspending agent. It can be used for treating certain gastrointestinal problems or to detoxify the body. However further research is required to back these properties. These factors will surge the growth of the kaolin market during the forthcoming period.
Based on product type, sandy kaolin is expected to dominate in the kaolin market share with 55% penetration.
Based on application, the ceramic segment is expected to dominate the kaolin market share due to its numerous applications owing to high chemical inertness, mechanical strength, rheology, less deformation, and finer particle size.
Based on region, Asia-pacific is expected to witness considerable growth in the kaolin market share with 40% due to improving economic conditions, high urbanization, and demand from several end-user industry verticals along with the presence of kaolin reserves and key players. It is followed by Europe and North America with a total share of 40%.
|
Report Metric |
Details |
|
Report Name |
Kaolin Market |
|
The market size in 2021 |
USD 6383 Million |
|
The revenue forecast in 2028 |
USD 8427 Million |
|
Growth Rate |
Compound Annual Growth Rate (CAGR) of 4.0% from 2022 to 2028 |
|
Market size available for years |
2022-2028 |
|
Forecast units |
Value (USD) |
|
Segments covered |
By Type, Application, and Region |
|
Report coverage |
Revenue & volume forecast, company share, competitive landscape, growth factors, and trends |
|
Geographic regions covered |
North America, Europe, Asia Pacific, Latin America, Middle East & Africa |
Ans. The global Kaolin market size is estimated to be worth US$ 6383 million in 2021 and is forecast to a readjusted size of US$ 8427 million by 2028.
Ans. The global Kaolin market size is expected to grow at a compound annual growth rate of 4.0% from 2022 to 2028.
Ans. Global Kaolin key players include Imerys S.A., kaMin, BASF, Thiele Kaolin Company, etc.Global top four manufacturers hold a share over 20%.
table of content:
1 Kaolin Market Overview
1.1 Kaolin Product Overview
1.2 Kaolin Market Segment by Type
1.2.1 Hard Kaolin
1.2.2 Soft Kaolin
1.2.3 Sandy Kaolin
1.3 Global Kaolin Market Size by Type
1.3.1 Global Kaolin Market Size Overview by Type (2017-2028)
1.3.2 Global Kaolin Historic Market Size Review by Type (2017-2022)
1.3.2.1 Global Kaolin Sales Breakdown in Volume by Type (2017-2022)
1.3.2.2 Global Kaolin Sales Breakdown in Value by Type (2017-2022)
1.3.2.3 Global Kaolin Average Selling Price (ASP) by Type (2017-2022)
1.3.3 Global Kaolin Forecasted Market Size by Type (2023-2028)
1.3.3.1 Global Kaolin Sales Breakdown in Volume by Type (2023-2028)
1.3.3.2 Global Kaolin Sales Breakdown in Value by Type (2023-2028)
1.3.3.3 Global Kaolin Average Selling Price (ASP) by Type (2023-2028)
1.4 Key Regions Market Size Segment by Type
1.4.1 North America Kaolin Sales Breakdown by Type (2017-2022)
1.4.2 Europe Kaolin Sales Breakdown by Type (2017-2022)
1.4.3 Asia-Pacific Kaolin Sales Breakdown by Type (2017-2022)
1.4.4 Latin America Kaolin Sales Breakdown by Type (2017-2022)
1.4.5 Middle East and Africa Kaolin Sales Breakdown by Type (2017-2022)
2 Global Kaolin Market Competition by Company
2.1 Global Top Players by Kaolin Sales (2017-2022)
2.2 Global Top Players by Kaolin Revenue (2017-2022)
2.3 Global Top Players Kaolin Price (2017-2022)
2.4 Global Top Manufacturers Kaolin Manufacturing Base Distribution, Sales Area, Product Type
2.5 Kaolin Market Competitive Situation and Trends
2.5.1 Kaolin Market Concentration Rate (2017-2022)
2.5.2 Global 5 and 10 Largest Manufacturers by Kaolin Sales and Revenue in 2021
2.6 Global Top Manufacturers by Company Type (Tier 1, Tier 2 and Tier 3) & (based on the Revenue in Kaolin as of 2021)
2.7 Date of Key Manufacturers Enter into Kaolin Market
2.8 Key Manufacturers Kaolin Product Offered
2.9 Mergers & Acquisitions, Expansion
3 Kaolin Status and Outlook by Region
3.1 Global Kaolin Market Size and CAGR by Region: 2017 VS 2021 VS 2028
3.2 Global Kaolin Historic Market Size by Region
3.2.1 Global Kaolin Sales in Volume by Region (2017-2022)
3.2.2 Global Kaolin Sales in Value by Region (2017-2022)
3.2.3 Global Kaolin Sales (Volume & Value) Price and Gross Margin (2017-2022)
3.3 Global Kaolin Forecasted Market Size by Region
3.3.1 Global Kaolin Sales in Volume by Region (2023-2028)
3.3.2 Global Kaolin Sales in Value by Region (2023-2028)
3.3.3 Global Kaolin Sales (Volume & Value), Price and Gross Margin (2023-2028)
4 Global Kaolin by Application
4.1 Kaolin Market Segment by Application
4.1.1 Paper
4.1.2 Ceramics
4.1.3 Paint
4.1.4 Rubber
4.1.5 Plastics
4.1.6 Refractories
4.1.7 Cosmetics and Pharmaceuticals
4.1.8 Others
4.2 Global Kaolin Market Size by Application
4.2.1 Global Kaolin Market Size Overview by Application (2017-2028)
4.2.2 Global Kaolin Historic Market Size Review by Application (2017-2022)
4.2.2.1 Global Kaolin Sales Breakdown in Volume, by Application (2017-2022)
4.2.2.2 Global Kaolin Sales Breakdown in Value, by Application (2017-2022)
4.2.2.3 Global Kaolin Average Selling Price (ASP) by Application (2017-2022)
4.2.3 Global Kaolin Forecasted Market Size by Application (2023-2028)
4.2.3.1 Global Kaolin Sales Breakdown in Volume, by Application (2023-2028)
4.2.3.2 Global Kaolin Sales Breakdown in Value, by Application (2023-2028)
4.2.3.3 Global Kaolin Average Selling Price (ASP) by Application (2023-2028)
4.3 Key Regions Market Size Segment by Application
4.3.1 North America Kaolin Sales Breakdown by Application (2017-2022)
4.3.2 Europe Kaolin Sales Breakdown by Application (2017-2022)
4.3.3 Asia-Pacific Kaolin Sales Breakdown by Application (2017-2022)
4.3.4 Latin America Kaolin Sales Breakdown by Application (2017-2022)
4.3.5 Middle East and Africa Kaolin Sales Breakdown by Application (2017-2022)
5 North America Kaolin by Country
5.1 North America Kaolin Historic Market Size by Country
5.1.1 North America Kaolin Sales in Volume by Country (2017-2022)
5.1.2 North America Kaolin Sales in Value by Country (2017-2022)
5.2 North America Kaolin Forecasted Market Size by Country
5.2.1 North America Kaolin Sales in Volume by Country (2023-2028)
5.2.2 North America Kaolin Sales in Value by Country (2023-2028)
6 Europe Kaolin by Country
6.1 Europe Kaolin Historic Market Size by Country
6.1.1 Europe Kaolin Sales in Volume by Country (2017-2022)
6.1.2 Europe Kaolin Sales in Value by Country (2017-2022)
6.2 Europe Kaolin Forecasted Market Size by Country
6.2.1 Europe Kaolin Sales in Volume by Country (2023-2028)
6.2.2 Europe Kaolin Sales in Value by Country (2023-2028)
7 Asia-Pacific Kaolin by Region
7.1 Asia-Pacific Kaolin Historic Market Size by Region
7.1.1 Asia-Pacific Kaolin Sales in Volume by Region (2017-2022)
7.1.2 Asia-Pacific Kaolin Sales in Value by Region (2017-2022)
7.2 Asia-Pacific Kaolin Forecasted Market Size by Region
7.2.1 Asia-Pacific Kaolin Sales in Volume by Region (2023-2028)
7.2.2 Asia-Pacific Kaolin Sales in Value by Region (2023-2028)
8 Latin America Kaolin by Country
8.1 Latin America Kaolin Historic Market Size by Country
8.1.1 Latin America Kaolin Sales in Volume by Country (2017-2022)
8.1.2 Latin America Kaolin Sales in Value by Country (2017-2022)
8.2 Latin America Kaolin Forecasted Market Size by Country
8.2.1 Latin America Kaolin Sales in Volume by Country (2023-2028)
8.2.2 Latin America Kaolin Sales in Value by Country (2023-2028)
9 Middle East and Africa Kaolin by Country
9.1 Middle East and Africa Kaolin Historic Market Size by Country
9.1.1 Middle East and Africa Kaolin Sales in Volume by Country (2017-2022)
9.1.2 Middle East and Africa Kaolin Sales in Value by Country (2017-2022)
9.2 Middle East and Africa Kaolin Forecasted Market Size by Country
9.2.1 Middle East and Africa Kaolin Sales in Volume by Country (2023-2028)
9.2.2 Middle East and Africa Kaolin Sales in Value by Country (2023-2028)
10 Company Profiles and Key Figures in Kaolin Business
10.1 Imerys S.A.
10.1.1 Imerys S.A. Corporation Information
10.1.2 Imerys S.A. Introduction and Business Overview
10.1.3 Imerys S.A. Kaolin Sales, Revenue and Gross Margin (2017-2022)
10.1.4 Imerys S.A. Kaolin Products Offered
10.1.5 Imerys S.A. Recent Development
10.2 KaMin LLC and CADAM SA
10.2.1 KaMin LLC and CADAM SA Corporation Information
10.2.2 KaMin LLC and CADAM SA Introduction and Business Overview
10.2.3 KaMin LLC and CADAM SA Kaolin Sales, Revenue and Gross Margin (2017-2022)
10.2.4 KaMin LLC and CADAM SA Kaolin Products Offered
10.2.5 KaMin LLC and CADAM SA Recent Development
10.3 BASF
10.3.1 BASF Corporation Information
10.3.2 BASF Introduction and Business Overview
10.3.3 BASF Kaolin Sales, Revenue and Gross Margin (2017-2022)
10.3.4 BASF Kaolin Products Offered
10.3.5 BASF Recent Development
10.4 Thiele Kaolin Company
10.4.1 Thiele Kaolin Company Corporation Information
10.4.2 Thiele Kaolin Company Introduction and Business Overview
10.4.3 Thiele Kaolin Company Kaolin Sales, Revenue and Gross Margin (2017-2022)
10.4.4 Thiele Kaolin Company Kaolin Products Offered
10.4.5 Thiele Kaolin Company Recent Development
10.5 Sibelco
10.5.1 Sibelco Corporation Information
10.5.2 Sibelco Introduction and Business Overview
10.5.3 Sibelco Kaolin Sales, Revenue and Gross Margin (2017-2022)
10.5.4 Sibelco Kaolin Products Offered
10.5.5 Sibelco Recent Development
10.6 Quarzwerke Gruppe
10.6.1 Quarzwerke Gruppe Corporation Information
10.6.2 Quarzwerke Gruppe Introduction and Business Overview
10.6.3 Quarzwerke Gruppe Kaolin Sales, Revenue and Gross Margin (2017-2022)
10.6.4 Quarzwerke Gruppe Kaolin Products Offered
10.6.5 Quarzwerke Gruppe Recent Development
10.7 I-Minerals
10.7.1 I-Minerals Corporation Information
10.7.2 I-Minerals Introduction and Business Overview
10.7.3 I-Minerals Kaolin Sales, Revenue and Gross Margin (2017-2022)
10.7.4 I-Minerals Kaolin Products Offered
10.7.5 I-Minerals Recent Development
10.8 Burgess
10.8.1 Burgess Corporation Information
10.8.2 Burgess Introduction and Business Overview
10.8.3 Burgess Kaolin Sales, Revenue and Gross Margin (2017-2022)
10.8.4 Burgess Kaolin Products Offered
10.8.5 Burgess Recent Development
10.9 China kaolin
10.9.1 China kaolin Corporation Information
10.9.2 China kaolin Introduction and Business Overview
10.9.3 China kaolin Kaolin Sales, Revenue and Gross Margin (2017-2022)
10.9.4 China kaolin Kaolin Products Offered
10.9.5 China kaolin Recent Development
10.10 China Mineral Processing
10.10.1 China Mineral Processing Corporation Information
10.10.2 China Mineral Processing Introduction and Business Overview
10.10.3 China Mineral Processing Kaolin Sales, Revenue and Gross Margin (2017-2022)
10.10.4 China Mineral Processing Kaolin Products Offered
10.10.5 China Mineral Processing Recent Development
10.11 Long Yan Kaolin clay
10.11.1 Long Yan Kaolin clay Corporation Information
10.11.2 Long Yan Kaolin clay Introduction and Business Overview
10.11.3 Long Yan Kaolin clay Kaolin Sales, Revenue and Gross Margin (2017-2022)
10.11.4 Long Yan Kaolin clay Kaolin Products Offered
10.11.5 Long Yan Kaolin clay Recent Development
10.12 Bright Industrial
10.12.1 Bright Industrial Corporation Information
10.12.2 Bright Industrial Introduction and Business Overview
10.12.3 Bright Industrial Kaolin Sales, Revenue and Gross Margin (2017-2022)
10.12.4 Bright Industrial Kaolin Products Offered
10.12.5 Bright Industrial Recent Development
10.13 LB Minerals
10.13.1 LB Minerals Corporation Information
10.13.2 LB Minerals Introduction and Business Overview
10.13.3 LB Minerals Kaolin Sales, Revenue and Gross Margin (2017-2022)
10.13.4 LB Minerals Kaolin Products Offered
10.13.5 LB Minerals Recent Development
11 Upstream, Opportunities, Challenges, Risks and Influences Factors Analysis
11.1 Kaolin Key Raw Materials
11.1.1 Key Raw Materials
11.1.2 Key Raw Materials Price
11.1.3 Raw Materials Key Suppliers
11.2 Manufacturing Cost Structure
11.2.1 Raw Materials
11.2.2 Labor Cost
11.2.3 Manufacturing Expenses
11.3 Kaolin Industrial Chain Analysis
11.4 Kaolin Market Dynamics
11.4.1 Kaolin Industry Trends
11.4.2 Kaolin Market Drivers
11.4.3 Kaolin Market Challenges
11.4.4 Kaolin Market Restraints
12 Market Strategy Analysis, Distributors
12.1 Sales Channel
12.2 Kaolin Distributors
12.3 Kaolin Downstream Customers
13 Research Findings and Conclusion
14 Appendix
14.1 Research Methodology
14.1.1 Methodology/Research Approach
14.1.1.1 Research Programs/Design
14.1.1.2 Market Size Estimation
14.1.1.3 Market Breakdown and Data Triangulation
14.1.2 Data Source
14.1.2.1 Secondary Sources
14.1.2.2 Primary Sources
14.2 Author Details
14.3 Disclaimer
Table of Figures:
List of Tables
Table 1. Major Company of Hard Kaolin
Table 2. Major Company of Soft Kaolin
Table 3. Major Company of Sandy Kaolin
Table 4. Global Kaolin Sales by Type 2017 VS 2021 VS 2028 (US$ Million)
Table 5. Global Kaolin Sales by Type (2017-2022) & (K MT)
Table 6. Global Kaolin Sales Market Share in Volume by Type (2017-2022)
Table 7. Global Kaolin Sales by Type (2017-2022) & (US& Million)
Table 8. Global Kaolin Market Share in Value by Type (2017-2022)
Table 9. Global Kaolin Price by Type (2017-2022) & (USD/MT)
Table 10. Global Kaolin Sales by Type (2023-2028) & (K MT)
Table 11. Global Kaolin Sales Market Share in Volume by Type (2023-2028)
Table 12. Global Kaolin Sales by Type (2023-2028) & (US$ Million)
Table 13. Global Kaolin Sales Market Share in Value by Type (2023-2028)
Table 14. Global Kaolin Price by Type (2023-2028) & (USD/MT)
Table 15. North America Kaolin Sales by Type (2017-2022) & (K MT)
Table 16. North America Kaolin Sales by Type (2017-2022) & (US$ Million)
Table 17. Europe Kaolin Sales (K MT) by Type (2017-2022)
Table 18. Europe Kaolin Sales by Type (2017-2022) & (US$ Million)
Table 19. Asia-Pacific Kaolin Sales (K MT) by Type (2017-2022)
Table 20. Asia-Pacific Kaolin Sales by Type (2017-2022) & (US$ Million)
Table 21. Latin America Kaolin Sales (K MT) by Type (2017-2022)
Table 22. Latin America Kaolin Sales by Type (2017-2022) & (US$ Million)
Table 23. Middle East and Africa Kaolin Sales (K MT) by Type (2017-2022)
Table 24. Middle East and Africa Kaolin Sales by Type (2017-2022) & (US$ Million)
Table 25. Global Kaolin Sales by Company (2017-2022) & (K MT)
Table 26. Global Kaolin Sales Share by Company (2017-2022)
Table 27. Global Kaolin Revenue by Company (2017-2022) & (US$ Million)
Table 28. Global Kaolin Revenue Share by Company (2017-2022)
Table 29. Global Market Kaolin Price by Company (2017-2022) & (USD/MT)
Table 30. Global Kaolin Top Manufacturers Manufacturing Base Distribution and Sales Area
Table 31. Global Kaolin Manufacturers Market Concentration Ratio (CR5 and HHI)
Table 32. Global Top Manufacturers Market Share by Company Type (Tier 1, Tier 2 and Tier 3) & (based on the Revenue in Kaolin as of 2021)
Table 33. Date of Key Manufacturers Enter into Kaolin Market
Table 34. Key Manufacturers Kaolin Product Type
Table 35. Mergers & Acquisitions, Expansion Plans
Table 36. Global Kaolin Market Size Comparison by Region (US$ Million): 2017 VS 2021 VS 2028
Table 37. Global Kaolin Sales by Region (2017-2022) & (K MT)
Table 38. Global Kaolin Sales Market Share in Volume by Region (2017-2022)
Table 39. Global Kaolin Sales by Region (2017-2022) & (US$ Million)
Table 40. Global Kaolin Sales Market Share in Value by Region (2017-2022)
Table 41. Global Kaolin Sales (K MT), Revenue (US$ Million), Price (USD/MT) and Gross Margin (2017-2022)
Table 42. Global Kaolin Sales by Region (2023-2028) & (K MT)
Table 43. Global Kaolin Sales Market Share in Volume by Region (2023-2028)
Table 44. Global Kaolin Sales by Region (2023-2028) & (US$ Million)
Table 45. Global Kaolin Sales Market Share in Value by Region (2023-2028)
Table 46. Global Kaolin Sales (K MT), Revenue (US$ Million), Price (USD/MT) and Gross Margin (2023-2028)
Table 47. Global Kaolin Sales by Application: 2017 VS 2021 VS 2028 (US$ Million)
Table 48. Global Kaolin Sales by Application (2017-2022) & (K MT)
Table 49. Global Kaolin Sales Market Share in Volume by Application (2017-2022)
Table 50. Global Kaolin Sales by Application (2017-2022) & (US$ Million)
Table 51. Global Kaolin Sales Market Share in Value by Application (2017-2022)
Table 52. Global Kaolin Price by Application (2017-2022) & (USD/MT)
Table 53. Global Kaolin Sales by Application (2023-2028) & (K MT)
Table 54. Global Kaolin Sales Market Share in Volume by Application (2023-2028)
Table 55. Global Kaolin Sales by Application (2023-2028) & (US$ Million)
Table 56. Global Kaolin Sales Market Share in Value by Application (2023-2028)
Table 57. Global Kaolin Price by Application (2023-2028) & (USD/MT)
Table 58. North America Kaolin Sales by Application (2017-2022) (K MT)
Table 59. North America Kaolin Sales by Application (2017-2022) & (US$ Million)
Table 60. North America Kaolin Sales Market Share in Value by Application in 2021
Table 61. Europe Kaolin Sales by Application (2017-2022) (K MT)
Table 62. Europe Kaolin Sales by Application (2017-2022) & (US$ Million)
Table 63. Europe Kaolin Sales Market Share in Value by Application in 2021
Table 64. Asia-Pacific Kaolin Sales by Application (2017-2022) (K MT)
Table 65. Asia-Pacific Kaolin Sales by Application (2017-2022) & (US$ Million)
Table 66. Asia-Pacific Kaolin Sales Market Share in Value by Application in 2021
Table 67. Latin America Kaolin Sales by Application (2017-2022) (K MT)
Table 68. Latin America Kaolin Sales by Application (2017-2022) & (US$ Million)
Table 69. Latin America Kaolin Sales Market Share in Value by Application in 2021
Table 70. Middle East and Africa Kaolin Sales by Application (2017-2022) (K MT)
Table 71. Middle East and Africa Kaolin Sales by Application (2017-2022) & (US$ Million)
Table 72. Middle East and Africa Kaolin Sales Market Share in Value by Application in 2021
Table 73. North America Kaolin Sales by Country (2017-2022) & (K MT)
Table 74. North America Kaolin Sales Market Share in Volume by Country (2017-2022)
Table 75. North America Kaolin Sales by Country (2017-2022) & (US$ Million)
Table 76. North America Kaolin Sales Market Share in Value by Country (2017-2022)
Table 77. North America Kaolin Sales by Country (2023-2028) & (K MT)
Table 78. North America Kaolin Sales Market Share in Volume by Country (2023-2028)
Table 79. North America Kaolin Sales by Country (2023-2028) & (US$ Million)
Table 80. North America Kaolin Sales Market Share in Value by Country (2023-2028)
Table 81. Europe Kaolin Sales by Country (2017-2022) & (K MT)
Table 82. Europe Kaolin Sales Market Share in Volume by Country (2017-2022)
Table 83. Europe Kaolin Sales by Country (2017-2022) & (US$ Million)
Table 84. Europe Kaolin Sales Market Share in Value by Country (2017-2022)
Table 85. Europe Kaolin Sales by Country (2023-2028) & (K MT)
Table 86. Europe Kaolin Sales Market Share in Volume by Country (2023-2028)
Table 87. Europe Kaolin Sales by Country (2023-2028) & (US$ Million)
Table 88. Europe Kaolin Sales Market Share in Value by Country (2023-2028)
Table 89. Asia-Pacific Kaolin Sales by Region (2017-2022) & (K MT)
Table 90. Asia-Pacific Kaolin Sales Market Share in Volume by Region (2017-2022)
Table 91. Asia-Pacific Kaolin Sales by Region (2017-2022) & (US$ Million)
Table 92. Asia-Pacific Kaolin Sales Market Share in Value by Region (2017-2022)
Table 93. Asia-Pacific Kaolin Sales by Region (2023-2028) & (K MT)
Table 94. Asia-Pacific Kaolin Sales Market Share in Volume by Region (2023-2028)
Table 95. Asia-Pacific Kaolin Sales by Region (2023-2028) & (US$ Million)
Table 96. Asia-Pacific Kaolin Sales Market Share in Value by Region (2023-2028)
Table 97. Latin America Kaolin Sales by Country (2017-2022) & (K MT)
Table 98. Latin America Kaolin Sales Market Share in Volume by Country (2017-2022)
Table 99. Latin America Kaolin Sales by Country (2017-2022) & (US$ Million)
Table 100. Latin America Kaolin Sales Market Share in Value by Country (2017-2022)
Table 101. Latin America Kaolin Sales by Country (2023-2028) & (K MT)
Table 102. Latin America Kaolin Sales Market Share in Volume by Country (2023-2028)
Table 103. Latin America Kaolin Sales by Country (2023-2028) & (US$ Million)
Table 104. Latin America Kaolin Sales Market Share in Value by Country (2023-2028)
Table 105. Middle East and Africa Kaolin Sales by Country (2017-2022) & (K MT)
Table 106. Middle East and Africa Kaolin Sales Market Share in Volume by Country (2017-2022)
Table 107. Middle East and Africa Kaolin Sales by Country (2017-2022) & (US$ Million)
Table 108. Middle East and Africa Kaolin Sales Market Share in Value by Country (2017-2022)
Table 109. Middle East and Africa Kaolin Sales by Country (2023-2028) & (K MT)
Table 110. Middle East and Africa Kaolin Sales Market Share in Volume by Country (2023-2028)
Table 111. Middle East and Africa Kaolin Sales by Country (2023-2028) & (US$ Million)
Table 112. Middle East and Africa Kaolin Sales Market Share in Value by Country (2023-2028)
Table 113. Imerys S.A. Corporation Information
Table 114. Imerys S.A. Introduction and Business Overview
Table 115. Imerys S.A. Kaolin Sales (K MT), Revenue (Million USD), Price (USD/MT) and Gross Margin (2017-2022)
Table 116. Imerys S.A. Kaolin Product
Table 117. Imerys S.A. Recent Development
Table 118. KaMin LLC and CADAM SA Corporation Information
Table 119. KaMin LLC and CADAM SA Introduction and Business Overview
Table 120. KaMin LLC and CADAM SA Kaolin Sales (K MT), Revenue (Million USD), Price (USD/MT) and Gross Margin (2017-2022)
Table 121. KaMin LLC and CADAM SA Kaolin Product
Table 122. KaMin LLC and CADAM SA Recent Development
Table 123. BASF Corporation Information
Table 124. BASF Introduction and Business Overview
Table 125. BASF Kaolin Sales (K MT), Revenue (Million USD), Price (USD/MT) and Gross Margin (2017-2022)
Table 126. BASF Kaolin Product
Table 127. BASF Recent Development
Table 128. Thiele Kaolin Company Corporation Information
Table 129. Thiele Kaolin Company Introduction and Business Overview
Table 130. Thiele Kaolin Company Kaolin Sales (K MT), Revenue (Million USD), Price (USD/MT) and Gross Margin (2017-2022)
Table 131. Thiele Kaolin Company Kaolin Product
Table 132. Thiele Kaolin Company Recent Development
Table 133. Sibelco Corporation Information
Table 134. Sibelco Introduction and Business Overview
Table 135. Sibelco Kaolin Sales (K MT), Revenue (Million USD), Price (USD/MT) and Gross Margin (2017-2022)
Table 136. Sibelco Kaolin Product
Table 137. Sibelco Recent Development
Table 138. Quarzwerke Gruppe Corporation Information
Table 139. Quarzwerke Gruppe Introduction and Business Overview
Table 140. Quarzwerke Gruppe Kaolin Sales (K MT), Revenue (Million USD), Price (USD/MT) and Gross Margin (2017-2022)
Table 141. Quarzwerke Gruppe Kaolin Product
Table 142. Quarzwerke Gruppe Recent Development
Table 143. I-Minerals Corporation Information
Table 144. I-Minerals Introduction and Business Overview
Table 145. I-Minerals Kaolin Sales (K MT), Revenue (Million USD), Price (USD/MT) and Gross Margin (2017-2022)
Table 146. I-Minerals Kaolin Product
Table 147. I-Minerals Recent Development
Table 148. Burgess Corporation Information
Table 149. Burgess Introduction and Business Overview
Table 150. Burgess Kaolin Sales (K MT), Revenue (Million USD), Price (USD/MT) and Gross Margin (2017-2022)
Table 151. Burgess Kaolin Product
Table 152. Burgess Recent Development
Table 153. China kaolin Corporation Information
Table 154. China kaolin Introduction and Business Overview
Table 155. China kaolin Kaolin Sales (K MT), Revenue (Million USD), Price (USD/MT) and Gross Margin (2017-2022)
Table 156. China kaolin Kaolin Product
Table 157. China kaolin Recent Development
Table 158. China Mineral Processing Corporation Information
Table 159. China Mineral Processing Introduction and Business Overview
Table 160. China Mineral Processing Kaolin Sales (K MT), Revenue (Million USD), Price (USD/MT) and Gross Margin (2017-2022)
Table 161. China Mineral Processing Kaolin Product
Table 162. China Mineral Processing Recent Development
Table 163. Long Yan Kaolin clay Corporation Information
Table 164. Long Yan Kaolin clay Introduction and Business Overview
Table 165. Long Yan Kaolin clay Kaolin Sales (K MT), Revenue (Million USD), Price (USD/MT) and Gross Margin (2017-2022)
Table 166. Long Yan Kaolin clay Kaolin Product
Table 167. Long Yan Kaolin clay Recent Development
Table 168. Bright Industrial Corporation Information
Table 169. Bright Industrial Introduction and Business Overview
Table 170. Bright Industrial Kaolin Sales (K MT), Revenue (Million USD), Price (USD/MT) and Gross Margin (2017-2022)
Table 171. Bright Industrial Kaolin Product
Table 172. Bright Industrial Recent Development
Table 173. LB Minerals Corporation Information
Table 174. LB Minerals Introduction and Business Overview
Table 175. LB Minerals Kaolin Sales (K MT), Revenue (Million USD), Price (USD/MT) and Gross Margin (2017-2022)
Table 176. LB Minerals Kaolin Product
Table 177. LB Minerals Recent Development
Table 178. Key Raw Materials Lists
Table 179. Raw Materials Key Suppliers Lists
Table 180. Kaolin Market Trends
Table 181. Kaolin Market Drivers
Table 182. Kaolin Market Challenges
Table 183. Kaolin Market Restraints
Table 184. Kaolin Distributors List
Table 185. Kaolin Downstream Customers
Table 186. Research Programs/Design for This Report
Table 187. Key Data Information from Secondary Sources
Table 188. Key Data Information from Primary Sources
List of Figures
Figure 1. Kaolin Product Picture
Figure 2. Global Kaolin Market Size, 2017 VS 2021 VS 2028 (US$ Million)
Figure 3. Global Kaolin Market Size Status and Outlook (2017-2028) & (US$ Million)
Figure 4. Global Kaolin Sales Status and Outlook (2017-2028) & (K MT)
Figure 5. Product Picture of Hard Kaolin
Figure 6. Global Hard Kaolin Sales YoY Growth (2017-2028) & (K MT)
Figure 7. Product Picture of Soft Kaolin
Figure 8. Global Soft Kaolin Sales YoY Growth (2017-2028) & (K MT)
Figure 9. Product Picture of Sandy Kaolin
Figure 10. Global Sandy Kaolin Sales YoY Growth (2017-2028) & (K MT)
Figure 11. Global Kaolin Sales by Type (2017-2028) & (US$ Million)
Figure 12. Global Kaolin Sales Market Share in Volume by Type (2017-2022)
Figure 13. Global Kaolin Sales Market Share in Value by Type (2017-2022)
Figure 14. Global Kaolin Sales Market Share in Volume by Type (2023-2028)
Figure 15. Global Kaolin Sales Market Share in Value by Type (2023-2028)
Figure 16. North America Kaolin Sales Market Share in Volume by Type in 2021
Figure 17. North America Kaolin Sales Market Share in Value by Type in 2021
Figure 18. Europe Kaolin Sales Market Share in Volume by Type in 2021
Figure 19. Europe Kaolin Sales Market Share in Value by Type in 2021
Figure 20. Asia-Pacific Kaolin Sales Market Share in Volume by Type in 2021
Figure 21. Asia-Pacific Kaolin Sales Market Share in Value by Type in 2021
Figure 22. Latin America Kaolin Sales Market Share in Volume by Type in 2021
Figure 23. Latin America Kaolin Sales Market Share in Value by Type in 2021
Figure 24. Middle East and Africa Kaolin Sales Market Share in Volume by Type in 2021
Figure 25. Middle East and Africa Kaolin Sales Market Share in Value by Type in 2021
Figure 26. The 5 and 10 Largest Manufacturers in the World: Market Share by Kaolin Sales in 2021
Figure 27. The 5 and 10 Largest Manufacturers in the World: Market Share by Kaolin Revenue in 2021
Figure 28. Kaolin Market Share by Company Type (Tier 1, Tier 2, and Tier 3): 2017 VS 2021
Figure 29. Product Picture of Paper
Figure 30. Global Paper Sales YoY Growth (2017-2028) & (K MT)
Figure 31. Product Picture of Ceramics
Figure 32. Global Ceramics Sales YoY Growth (2017-2028) & (K MT)
Figure 33. Product Picture of Paint
Figure 34. Global Paint Sales YoY Growth (2017-2028) & (K MT)
Figure 35. Product Picture of Rubber
Figure 36. Global Rubber Sales YoY Growth (2017-2028) & (K MT)
Figure 37. Product Picture of Plastics
Figure 38. Global Plastics Sales YoY Growth (2017-2028) & (K MT)
Figure 39. Product Picture of Refractories
Figure 40. Global Refractories Sales YoY Growth (2017-2028) & (K MT)
Figure 41. Product Picture of Cosmetics and Pharmaceuticals
Figure 42. Global Cosmetics and Pharmaceuticals Sales YoY Growth (2017-2028) & (K MT)
Figure 43. Product Picture of Others
Figure 44. Global Others Sales YoY Growth (2017-2028) & (K MT)
Figure 45. Global Kaolin Sales by Application (2017-2028) & (US$ Million)
Figure 46. Global Kaolin Sales Market Share by Application in 2021 & 2028
Figure 47. North America Kaolin Sales Market Share in Volume by Application in 2021
Figure 48. Latin America Kaolin Sales Market Share in Value by Application in 2021
Figure 49. Middle East and Africa Kaolin Sales Market Share in Value by Application in 2021
Figure 50. Key Raw Materials Price
Figure 51. Kaolin Manufacturing Cost Structure
Figure 52. Kaolin Industrial Chain Analysis
Figure 53. Channels of Distribution
Figure 54. Distributors Profiles
Figure 55. Bottom-up and Top-down Approaches for This Report
Figure 56. Data Triangulation
Figure 57. Key Executives Interviewed
$3350
$6700