
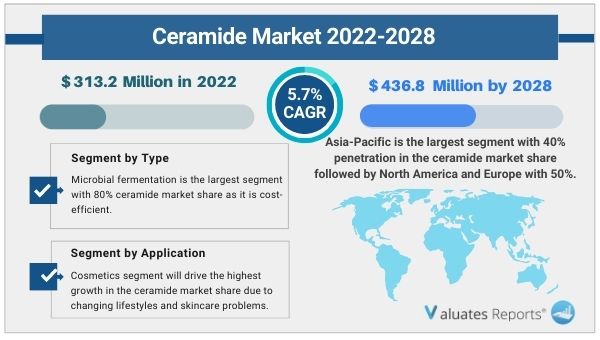
Due to the COVID-19 pandemic, the global Ceramide market size is estimated to be worth US$ 313.2 million in 2022 and is forecast to a readjusted size of US$ 436.8 million by 2028 with a CAGR of 5.7% during the review period. Key drivers of the ceramide market include the growing antiaging problems, the rise in the geriatric population, and an increase in spending on skincare and cosmetic products. The heavy use in the pharmaceutical industry and healthcare dietary supplements will fuel the market demand in the subsequent years. The growing trend of vegan cosmetics and the development of plant-based ceramides will propel the ceramide market.
Rise in skin related problems
The increasing attention of the youth and the rise in the aging population have encouraged consumers to spend more on ceramide cosmetic products for enhancing their skin. These products make the skin tighter and form a protective layer that restricts moisture loss. They also help in treating certain problems such as eczema or psoriasis. With unhealthy lifestyles, drinking and minimal sleeping skin issues have become widespread. Moreover, with the rising income levels, people are splurging on personal care products for boosting their self-confidence and positive self-image. This in turn is driving the growth of the ceramide market during the broadcasted period.
Medical industry
Several studies have shown that ceramides aid in treating dry skin and solidifying the skin barrier system. On the other hand, the compound has been shown to provide significant resistance to diabetes mellitus by releasing pancreatic B cell apoptosis, insulin resistance, and reduction in gene expression. They are also used as dietary supplements. The gradual R&D into its potential use cases will create huge opportunities for the ceramide market expansion in the coming years.
Widespread development of plant-based ceramides
Ceramides occur naturally in the outer epidermis layer of our skin. However, the production of plant-derived or Phyto ceramides is ongoing. They are affordable ad extracted from rice, yeast, sweet potatoes, and wheat germ oil. Furthermore, the growing trend of vegan cosmetics with natural ingredients is expected to increase its preference in the coming decades. These solid developments will ultimately accelerate the ceramide market during the review period. There is a growing shift from bovine-made products to natural ingredients.
Based on application, the cosmetics segment will drive the highest growth in the ceramide market share due to changing lifestyles and skincare problems driving consumers to spend more on personal care products.
Based on region, Asia-Pacific is the largest segment with 40% penetration in the ceramide market share followed by North America and Europe with 50% total. Asia-Pacific will grow owing to the huge aging population and demand for anti-aging natural products.
Based on type, Microbial fermentation is the largest segment with 80% ceramide market share as it is cost-efficient in comparison to extraction-based production.
Ceramide Market By Type
|
Report Metric |
Details |
|
Report Name |
Ceramide Market |
|
The market size in 2022 |
USD 313.2 Million |
|
The revenue forecast in 2028 |
USD 436.8 Million |
|
Growth Rate |
Compound Annual Growth Rate (CAGR) of 5.7% from 2022 to 2028 |
|
Market size available for years |
2022-2028 |
|
Forecast units |
Value (USD) |
|
Segments covered |
By Type, Application, and Region |
|
Report coverage |
Revenue & volume forecast, company share, competitive landscape, growth factors, and trends |
|
Geographic regions covered |
North America, Europe, Asia Pacific, Latin America, Middle East & Africa |
Ans. The global Ceramide market size is estimated to be worth US$ 313.2 million in 2022 and is forecast to a readjusted size of US$ 436.8 million by 2028.
Ans. The global Ceramide market is expected to grow at a compound annual growth rate of 5.7% from 2022 to 2028.
Ans. Some of the major companies are Evonik, Croda, Doosan, Vantage, Toyobo, Macrocare, Unitika, Ashland.
Table of Contents
1 Study Coverage
1.1 Ceramide Product Introduction
1.2 Market by Type
1.2.1 Global Ceramide Market Size Growth Rate by Type, 2017 VS 2021 VS 2028
1.2.2 Microbial Fermentation
1.2.3 Chemical Synthesis
1.2.4 Plant Extraction
1.3 Market by Application
1.3.1 Global Ceramide Market Size Growth Rate by Application, 2017 VS 2021 VS 2028
1.3.2 Cosmetics
1.3.3 Food
1.3.4 Health Products
1.3.5 Other
1.4 Study Objectives
1.5 Years Considered
2 Executive Summary
2.1 Global Ceramide Sales Estimates and Forecasts 2017-2028
2.2 Global Ceramide Revenue Estimates and Forecasts 2017-2028
2.3 Global Ceramide Revenue by Region: 2017 VS 2021 VS 2028
2.4 Global Ceramide Sales by Region
2.4.1 Global Ceramide Sales by Region (2017-2022)
2.4.2 Global Sales Ceramide by Region (2023-2028)
2.5 Global Ceramide Revenue by Region
2.5.1 Global Ceramide Revenue by Region (2017-2022)
2.5.2 Global Ceramide Revenue by Region (2023-2028)
2.6 North America
2.7 Europe
2.8 Asia-Pacific
2.9 Latin America
2.10 Middle East & Africa
3 Competition by Manufacturers
3.1 Global Ceramide Sales by Manufacturers
3.1.1 Global Top Ceramide Manufacturers by Sales (2017-2022)
3.1.2 Global Ceramide Sales Market Share by Manufacturers (2017-2022)
3.1.3 Global Top 10 and Top 5 Largest Manufacturers of Ceramide in 2021
3.2 Global Ceramide Revenue by Manufacturers
3.2.1 Global Ceramide Revenue by Manufacturers (2017-2022)
3.2.2 Global Ceramide Revenue Market Share by Manufacturers (2017-2022)
3.2.3 Global Top 10 and Top 5 Companies by Ceramide Revenue in 2021
3.3 Global Ceramide Sales Price by Manufacturers (2017-2022)
3.4 Analysis of Competitive Landscape
3.4.1 Manufacturers Market Concentration Ratio (CR5 and HHI)
3.4.2 Global Ceramide Market Share by Company Type (Tier 1, Tier 2, and Tier 3)
3.4.3 Global Ceramide Manufacturers Geographical Distribution
3.5 Mergers & Acquisitions, Expansion Plans
4 Market Size by Type
4.1 Global Ceramide Sales by Type
4.1.1 Global Ceramide Historical Sales by Type (2017-2022)
4.1.2 Global Ceramide Forecasted Sales by Type (2023-2028)
4.1.3 Global Ceramide Sales Market Share by Type (2017-2028)
4.2 Global Ceramide Revenue by Type
4.2.1 Global Ceramide Historical Revenue by Type (2017-2022)
4.2.2 Global Ceramide Forecasted Revenue by Type (2023-2028)
4.2.3 Global Ceramide Revenue Market Share by Type (2017-2028)
4.3 Global Ceramide Price by Type
4.3.1 Global Ceramide Price by Type (2017-2022)
4.3.2 Global Ceramide Price Forecast by Type (2023-2028)
5 Market Size by Application
5.1 Global Ceramide Sales by Application
5.1.1 Global Ceramide Historical Sales by Application (2017-2022)
5.1.2 Global Ceramide Forecasted Sales by Application (2023-2028)
5.1.3 Global Ceramide Sales Market Share by Application (2017-2028)
5.2 Global Ceramide Revenue by Application
5.2.1 Global Ceramide Historical Revenue by Application (2017-2022)
5.2.2 Global Ceramide Forecasted Revenue by Application (2023-2028)
5.2.3 Global Ceramide Revenue Market Share by Application (2017-2028)
5.3 Global Ceramide Price by Application
5.3.1 Global Ceramide Price by Application (2017-2022)
5.3.2 Global Ceramide Price Forecast by Application (2023-2028)
6 North America
6.1 North America Ceramide Market Size by Type
6.1.1 North America Ceramide Sales by Type (2017-2028)
6.1.2 North America Ceramide Revenue by Type (2017-2028)
6.2 North America Ceramide Market Size by Application
6.2.1 North America Ceramide Sales by Application (2017-2028)
6.2.2 North America Ceramide Revenue by Application (2017-2028)
6.3 North America Ceramide Market Size by Country
6.3.1 North America Ceramide Sales by Country (2017-2028)
6.3.2 North America Ceramide Revenue by Country (2017-2028)
6.3.3 U.S.
6.3.4 Canada
7 Europe
7.1 Europe Ceramide Market Size by Type
7.1.1 Europe Ceramide Sales by Type (2017-2028)
7.1.2 Europe Ceramide Revenue by Type (2017-2028)
7.2 Europe Ceramide Market Size by Application
7.2.1 Europe Ceramide Sales by Application (2017-2028)
7.2.2 Europe Ceramide Revenue by Application (2017-2028)
7.3 Europe Ceramide Market Size by Country
7.3.1 Europe Ceramide Sales by Country (2017-2028)
7.3.2 Europe Ceramide Revenue by Country (2017-2028)
7.3.3 Germany
7.3.4 France
7.3.5 U.K.
7.3.6 Italy
7.3.7 Russia
8 Asia Pacific
8.1 Asia Pacific Ceramide Market Size by Type
8.1.1 Asia Pacific Ceramide Sales by Type (2017-2028)
8.1.2 Asia Pacific Ceramide Revenue by Type (2017-2028)
8.2 Asia Pacific Ceramide Market Size by Application
8.2.1 Asia Pacific Ceramide Sales by Application (2017-2028)
8.2.2 Asia Pacific Ceramide Revenue by Application (2017-2028)
8.3 Asia Pacific Ceramide Market Size by Region
8.3.1 Asia Pacific Ceramide Sales by Region (2017-2028)
8.3.2 Asia Pacific Ceramide Revenue by Region (2017-2028)
8.3.3 China
8.3.4 Japan
8.3.5 South Korea
8.3.6 India
8.3.7 Australia
8.3.8 Taiwan
8.3.9 Indonesia
8.3.10 Thailand
8.3.11 Malaysia
8.3.12 Philippines
9 Latin America
9.1 Latin America Ceramide Market Size by Type
9.1.1 Latin America Ceramide Sales by Type (2017-2028)
9.1.2 Latin America Ceramide Revenue by Type (2017-2028)
9.2 Latin America Ceramide Market Size by Application
9.2.1 Latin America Ceramide Sales by Application (2017-2028)
9.2.2 Latin America Ceramide Revenue by Application (2017-2028)
9.3 Latin America Ceramide Market Size by Country
9.3.1 Latin America Ceramide Sales by Country (2017-2028)
9.3.2 Latin America Ceramide Revenue by Country (2017-2028)
9.3.3 Mexico
9.3.4 Brazil
9.3.5 Argentina
10 Middle East and Africa
10.1 Middle East and Africa Ceramide Market Size by Type
10.1.1 Middle East and Africa Ceramide Sales by Type (2017-2028)
10.1.2 Middle East and Africa Ceramide Revenue by Type (2017-2028)
10.2 Middle East and Africa Ceramide Market Size by Application
10.2.1 Middle East and Africa Ceramide Sales by Application (2017-2028)
10.2.2 Middle East and Africa Ceramide Revenue by Application (2017-2028)
10.3 Middle East and Africa Ceramide Market Size by Country
10.3.1 Middle East and Africa Ceramide Sales by Country (2017-2028)
10.3.2 Middle East and Africa Ceramide Revenue by Country (2017-2028)
10.3.3 Turkey
10.3.4 Saudi Arabia
11 Company Profiles
11.1 Evonik
11.1.1 Evonik Corporation Information
11.1.2 Evonik Overview
11.1.3 Evonik Ceramide Sales, Price, Revenue and Gross Margin (2017-2022)
11.1.4 Evonik Ceramide Product Model Numbers, Pictures, Descriptions and Specifications
11.1.5 Evonik Recent Developments
11.2 Croda
11.2.1 Croda Corporation Information
11.2.2 Croda Overview
11.2.3 Croda Ceramide Sales, Price, Revenue and Gross Margin (2017-2022)
11.2.4 Croda Ceramide Product Model Numbers, Pictures, Descriptions and Specifications
11.2.5 Croda Recent Developments
11.3 Doosan
11.3.1 Doosan Corporation Information
11.3.2 Doosan Overview
11.3.3 Doosan Ceramide Sales, Price, Revenue and Gross Margin (2017-2022)
11.3.4 Doosan Ceramide Product Model Numbers, Pictures, Descriptions and Specifications
11.3.5 Doosan Recent Developments
11.4 Vantage
11.4.1 Vantage Corporation Information
11.4.2 Vantage Overview
11.4.3 Vantage Ceramide Sales, Price, Revenue and Gross Margin (2017-2022)
11.4.4 Vantage Ceramide Product Model Numbers, Pictures, Descriptions and Specifications
11.4.5 Vantage Recent Developments
11.5 Toyobo
11.5.1 Toyobo Corporation Information
11.5.2 Toyobo Overview
11.5.3 Toyobo Ceramide Sales, Price, Revenue and Gross Margin (2017-2022)
11.5.4 Toyobo Ceramide Product Model Numbers, Pictures, Descriptions and Specifications
11.5.5 Toyobo Recent Developments
11.6 Macrocare
11.6.1 Macrocare Corporation Information
11.6.2 Macrocare Overview
11.6.3 Macrocare Ceramide Sales, Price, Revenue and Gross Margin (2017-2022)
11.6.4 Macrocare Ceramide Product Model Numbers, Pictures, Descriptions and Specifications
11.6.5 Macrocare Recent Developments
11.7 Unitika
11.7.1 Unitika Corporation Information
11.7.2 Unitika Overview
11.7.3 Unitika Ceramide Sales, Price, Revenue and Gross Margin (2017-2022)
11.7.4 Unitika Ceramide Product Model Numbers, Pictures, Descriptions and Specifications
11.7.5 Unitika Recent Developments
11.8 Ashland
11.8.1 Ashland Corporation Information
11.8.2 Ashland Overview
11.8.3 Ashland Ceramide Sales, Price, Revenue and Gross Margin (2017-2022)
11.8.4 Ashland Ceramide Product Model Numbers, Pictures, Descriptions and Specifications
11.8.5 Ashland Recent Developments
12 Industry Chain and Sales Channels Analysis
12.1 Ceramide Industry Chain Analysis
12.2 Ceramide Key Raw Materials
12.2.1 Key Raw Materials
12.2.2 Raw Materials Key Suppliers
12.3 Ceramide Production Mode & Process
12.4 Ceramide Sales and Marketing
12.4.1 Ceramide Sales Channels
12.4.2 Ceramide Distributors
12.5 Ceramide Customers
13 Market Drivers, Opportunities, Challenges and Risks Factors Analysis
13.1 Ceramide Industry Trends
13.2 Ceramide Market Drivers
13.3 Ceramide Market Challenges
13.4 Ceramide Market Restraints
14 Key Findings in The Global Ceramide Study
15 Appendix
15.1 Research Methodology
15.1.1 Methodology/Research Approach
15.1.2 Data Source
15.2 Author Details
15.3 Disclaimer
List of Tables
Table 1. Global Ceramide Market Size Growth Rate by Type, 2017 VS 2021 VS 2028 (US$ Million)
Table 2. Major Manufacturers of Microbial Fermentation
Table 3. Major Manufacturers of Chemical Synthesis
Table 4. Major Manufacturers of Plant Extraction
Table 5. Global Ceramide Market Size Growth Rate by Application, 2017 VS 2021 VS 2028 (US$ Million)
Table 6. Global Ceramide Revenue by Region: 2017 VS 2021 VS 2028 (US$ Million)
Table 7. Global Ceramide Sales by Region (2017-2022) & (Kg)
Table 8. Global Ceramide Sales Market Share by Region (2017-2022)
Table 9. Global Ceramide Sales by Region (2023-2028) & (Kg)
Table 10. Global Ceramide Sales Market Share by Region (2023-2028)
Table 11. Global Ceramide Revenue by Region (2017-2022) & (US$ Million)
Table 12. Global Ceramide Revenue Market Share by Region (2017-2022)
Table 13. Global Ceramide Revenue by Region (2023-2028) & (US$ Million)
Table 14. Global Ceramide Revenue Market Share by Region (2023-2028)
Table 15. Global Ceramide Sales by Manufacturers (2017-2022) & (Kg)
Table 16. Global Ceramide Sales Share by Manufacturers (2017-2022)
Table 17. Global Ceramide Revenue by Manufacturers (2017-2022) & (US$ Million)
Table 18. Global Ceramide Revenue Share by Manufacturers (2017-2022)
Table 19. Ceramide Price by Manufacturers (2017-2022) &(USD/Kg)
Table 20. Global Ceramide Manufacturers Market Concentration Ratio (CR5 and HHI)
Table 21. Global Ceramide by Company Type (Tier 1, Tier 2, and Tier 3) & (based on the Revenue in Ceramide as of 2021)
Table 22. Ceramide Manufacturing Base Distribution and Headquarters
Table 23. Manufacturers Ceramide Product Offered
Table 24. Date of Manufacturers Enter into Ceramide Market
Table 25. Mergers & Acquisitions, Expansion Plans
Table 26. Global Ceramide Sales by Type (2017-2022) & (Kg)
Table 27. Global Ceramide Sales by Type (2023-2028) & (Kg)
Table 28. Global Ceramide Sales Share by Type (2017-2022)
Table 29. Global Ceramide Sales Share by Type (2023-2028)
Table 30. Global Ceramide Revenue by Type (2017-2022) & (US$ Million)
Table 31. Global Ceramide Revenue by Type (2023-2028) & (US$ Million)
Table 32. Global Ceramide Revenue Share by Type (2017-2022)
Table 33. Global Ceramide Revenue Share by Type (2023-2028)
Table 34. Ceramide Price by Type (2017-2022) & (USD/Kg)
Table 35. Global Ceramide Price Forecast by Type (2023-2028) & (USD/Kg)
Table 36. Global Ceramide Sales by Application (2017-2022) & (Kg)
Table 37. Global Ceramide Sales by Application (2023-2028) & (Kg)
Table 38. Global Ceramide Sales Share by Application (2017-2022)
Table 39. Global Ceramide Sales Share by Application (2023-2028)
Table 40. Global Ceramide Revenue by Application (2017-2022) & (US$ Million)
Table 41. Global Ceramide Revenue by Application (2023-2028) & (US$ Million)
Table 42. Global Ceramide Revenue Share by Application (2017-2022)
Table 43. Global Ceramide Revenue Share by Application (2023-2028)
Table 44. Ceramide Price by Application (2017-2022) & (USD/Kg)
Table 45. Global Ceramide Price Forecast by Application (2023-2028) & (USD/Kg)
Table 46. North America Ceramide Sales by Type (2017-2022) & (Kg)
Table 47. North America Ceramide Sales by Type (2023-2028) & (Kg)
Table 48. North America Ceramide Revenue by Type (2017-2022) & (US$ Million)
Table 49. North America Ceramide Revenue by Type (2023-2028) & (US$ Million)
Table 50. North America Ceramide Sales by Application (2017-2022) & (Kg)
Table 51. North America Ceramide Sales by Application (2023-2028) & (Kg)
Table 52. North America Ceramide Revenue by Application (2017-2022) & (US$ Million)
Table 53. North America Ceramide Revenue by Application (2023-2028) & (US$ Million)
Table 54. North America Ceramide Sales by Country (2017-2022) & (Kg)
Table 55. North America Ceramide Sales by Country (2023-2028) & (Kg)
Table 56. North America Ceramide Revenue by Country (2017-2022) & (US$ Million)
Table 57. North America Ceramide Revenue by Country (2023-2028) & (US$ Million)
Table 58. Europe Ceramide Sales by Type (2017-2022) & (Kg)
Table 59. Europe Ceramide Sales by Type (2023-2028) & (Kg)
Table 60. Europe Ceramide Revenue by Type (2017-2022) & (US$ Million)
Table 61. Europe Ceramide Revenue by Type (2023-2028) & (US$ Million)
Table 62. Europe Ceramide Sales by Application (2017-2022) & (Kg)
Table 63. Europe Ceramide Sales by Application (2023-2028) & (Kg)
Table 64. Europe Ceramide Revenue by Application (2017-2022) & (US$ Million)
Table 65. Europe Ceramide Revenue by Application (2023-2028) & (US$ Million)
Table 66. Europe Ceramide Sales by Country (2017-2022) & (Kg)
Table 67. Europe Ceramide Sales by Country (2023-2028) & (Kg)
Table 68. Europe Ceramide Revenue by Country (2017-2022) & (US$ Million)
Table 69. Europe Ceramide Revenue by Country (2023-2028) & (US$ Million)
Table 70. Asia Pacific Ceramide Sales by Type (2017-2022) & (Kg)
Table 71. Asia Pacific Ceramide Sales by Type (2023-2028) & (Kg)
Table 72. Asia Pacific Ceramide Revenue by Type (2017-2022) & (US$ Million)
Table 73. Asia Pacific Ceramide Revenue by Type (2023-2028) & (US$ Million)
Table 74. Asia Pacific Ceramide Sales by Application (2017-2022) & (Kg)
Table 75. Asia Pacific Ceramide Sales by Application (2023-2028) & (Kg)
Table 76. Asia Pacific Ceramide Revenue by Application (2017-2022) & (US$ Million)
Table 77. Asia Pacific Ceramide Revenue by Application (2023-2028) & (US$ Million)
Table 78. Asia Pacific Ceramide Sales by Region (2017-2022) & (Kg)
Table 79. Asia Pacific Ceramide Sales by Region (2023-2028) & (Kg)
Table 80. Asia Pacific Ceramide Revenue by Region (2017-2022) & (US$ Million)
Table 81. Asia Pacific Ceramide Revenue by Region (2023-2028) & (US$ Million)
Table 82. Latin America Ceramide Sales by Type (2017-2022) & (Kg)
Table 83. Latin America Ceramide Sales by Type (2023-2028) & (Kg)
Table 84. Latin America Ceramide Revenue by Type (2017-2022) & (US$ Million)
Table 85. Latin America Ceramide Revenue by Type (2023-2028) & (US$ Million)
Table 86. Latin America Ceramide Sales by Application (2017-2022) & (Kg)
Table 87. Latin America Ceramide Sales by Application (2023-2028) & (Kg)
Table 88. Latin America Ceramide Revenue by Application (2017-2022) & (US$ Million)
Table 89. Latin America Ceramide Revenue by Application (2023-2028) & (US$ Million)
Table 90. Latin America Ceramide Sales by Country (2017-2022) & (Kg)
Table 91. Latin America Ceramide Sales by Country (2023-2028) & (Kg)
Table 92. Latin America Ceramide Revenue by Country (2017-2022) & (US$ Million)
Table 93. Latin America Ceramide Revenue by Country (2023-2028) & (US$ Million)
Table 94. Middle East and Africa Ceramide Sales by Type (2017-2022) & (Kg)
Table 95. Middle East and Africa Ceramide Sales by Type (2023-2028) & (Kg)
Table 96. Middle East and Africa Ceramide Revenue by Type (2017-2022) & (US$ Million)
Table 97. Middle East and Africa Ceramide Revenue by Type (2023-2028) & (US$ Million)
Table 98. Middle East and Africa Ceramide Sales by Application (2017-2022) & (Kg)
Table 99. Middle East and Africa Ceramide Sales by Application (2023-2028) & (Kg)
Table 100. Middle East and Africa Ceramide Revenue by Application (2017-2022) & (US$ Million)
Table 101. Middle East and Africa Ceramide Revenue by Application (2023-2028) & (US$ Million)
Table 102. Middle East and Africa Ceramide Sales by Country (2017-2022) & (Kg)
Table 103. Middle East and Africa Ceramide Sales by Country (2023-2028) & (Kg)
Table 104. Middle East and Africa Ceramide Revenue by Country (2017-2022) & (US$ Million)
Table 105. Middle East and Africa Ceramide Revenue by Country (2023-2028) & (US$ Million)
Table 106. Evonik Corporation Information
Table 107. Evonik Description and Major Businesses
Table 108. Evonik Ceramide Sales (Kg), Revenue (US$ Million), Price (USD/Kg) and Gross Margin (2017-2022)
Table 109. Evonik Ceramide Product Model Numbers, Pictures, Descriptions and Specifications
Table 110. Evonik Recent Developments
Table 111. Croda Corporation Information
Table 112. Croda Description and Major Businesses
Table 113. Croda Ceramide Sales (Kg), Revenue (US$ Million), Price (USD/Kg) and Gross Margin (2017-2022)
Table 114. Croda Ceramide Product Model Numbers, Pictures, Descriptions and Specifications
Table 115. Croda Recent Developments
Table 116. Doosan Corporation Information
Table 117. Doosan Description and Major Businesses
Table 118. Doosan Ceramide Sales (Kg), Revenue (US$ Million), Price (USD/Kg) and Gross Margin (2017-2022)
Table 119. Doosan Ceramide Product Model Numbers, Pictures, Descriptions and Specifications
Table 120. Doosan Recent Developments
Table 121. Vantage Corporation Information
Table 122. Vantage Description and Major Businesses
Table 123. Vantage Ceramide Sales (Kg), Revenue (US$ Million), Price (USD/Kg) and Gross Margin (2017-2022)
Table 124. Vantage Ceramide Product Model Numbers, Pictures, Descriptions and Specifications
Table 125. Vantage Recent Developments
Table 126. Toyobo Corporation Information
Table 127. Toyobo Description and Major Businesses
Table 128. Toyobo Ceramide Sales (Kg), Revenue (US$ Million), Price (USD/Kg) and Gross Margin (2017-2022)
Table 129. Toyobo Ceramide Product Model Numbers, Pictures, Descriptions and Specifications
Table 130. Toyobo Recent Developments
Table 131. Macrocare Corporation Information
Table 132. Macrocare Description and Major Businesses
Table 133. Macrocare Ceramide Sales (Kg), Revenue (US$ Million), Price (USD/Kg) and Gross Margin (2017-2022)
Table 134. Macrocare Ceramide Product Model Numbers, Pictures, Descriptions and Specifications
Table 135. Macrocare Recent Developments
Table 136. Unitika Corporation Information
Table 137. Unitika Description and Major Businesses
Table 138. Unitika Ceramide Sales (Kg), Revenue (US$ Million), Price (USD/Kg) and Gross Margin (2017-2022)
Table 139. Unitika Ceramide Product Model Numbers, Pictures, Descriptions and Specifications
Table 140. Unitika Recent Developments
Table 141. Ashland Corporation Information
Table 142. Ashland Description and Major Businesses
Table 143. Ashland Ceramide Sales (Kg), Revenue (US$ Million), Price (USD/Kg) and Gross Margin (2017-2022)
Table 144. Ashland Ceramide Product Model Numbers, Pictures, Descriptions and Specifications
Table 145. Ashland Recent Developments
Table 146. Key Raw Materials Lists
Table 147. Raw Materials Key Suppliers Lists
Table 148. Ceramide Distributors List
Table 149. Ceramide Customers List
Table 150. Ceramide Market Trends
Table 151. Ceramide Market Drivers
Table 152. Ceramide Market Challenges
Table 153. Ceramide Market Restraints
Table 154. Research Programs/Design for This Report
Table 155. Key Data Information from Secondary Sources
Table 156. Key Data Information from Primary Sources
List of Figures
Figure 1. Ceramide Product Picture
Figure 3. Global Ceramide Market Share by Type in 2021 & 2028
Figure 3. Microbial Fermentation Product Picture
Figure 4. Chemical Synthesis Product Picture
Figure 5. Plant Extraction Product Picture
Figure 6. Global Ceramide Market Share by Application in 2021 & 2028
Figure 7. Cosmetics
Figure 8. Food
Figure 9. Health Products
Figure 10. Other
Figure 11. Ceramide Report Years Considered
Figure 12. Global Ceramide Sales 2017-2028 (Kg)
Figure 13. Global Ceramide Revenue, (US$ Million), 2017 VS 2021 VS 2028
Figure 14. Global Ceramide Revenue 2017-2028 (US$ Million)
Figure 15. Global Ceramide Revenue Market Share by Region in Percentage: 2021 Versus 2028
Figure 16. Global Ceramide Sales Market Share by Region (2017-2022)
Figure 17. Global Ceramide Sales Market Share by Region (2023-2028)
Figure 18. North America Ceramide Sales YoY (2017-2028) & (Kg)
Figure 19. North America Ceramide Revenue YoY (2017-2028) & (US$ Million)
Figure 20. Europe Ceramide Sales YoY (2017-2028) & (Kg)
Figure 21. Europe Ceramide Revenue YoY (2017-2028) & (US$ Million)
Figure 22. Asia-Pacific Ceramide Sales YoY (2017-2028) & (Kg)
Figure 23. Asia-Pacific Ceramide Revenue YoY (2017-2028) & (US$ Million)
Figure 24. Latin America Ceramide Sales YoY (2017-2028) & (Kg)
Figure 25. Latin America Ceramide Revenue YoY (2017-2028) & (US$ Million)
Figure 26. Middle East & Africa Ceramide Sales YoY (2017-2028) & (Kg)
Figure 27. Middle East & Africa Ceramide Revenue YoY (2017-2028) & (US$ Million)
Figure 28. The Ceramide Market Share of Top 10 and Top 5 Largest Manufacturers Around the World in 2021
Figure 29. The Top 5 and 10 Largest Manufacturers of Ceramide in the World: Market Share by Ceramide Revenue in 2021
Figure 30. Global Ceramide Market Share by Company Type (Tier 1, Tier 2, and Tier 3): 2017 VS 2021
Figure 31. Global Ceramide Sales Market Share by Type (2017-2028)
Figure 32. Global Ceramide Revenue Market Share by Type (2017-2028)
Figure 33. Global Ceramide Sales Market Share by Application (2017-2028)
Figure 34. Global Ceramide Revenue Market Share by Application (2017-2028)
Figure 35. North America Ceramide Sales Market Share by Type (2017-2028)
Figure 36. North America Ceramide Revenue Market Share by Type (2017-2028)
Figure 37. North America Ceramide Sales Market Share by Application (2017-2028)
Figure 38. North America Ceramide Revenue Market Share by Application (2017-2028)
Figure 39. North America Ceramide Sales Share by Country (2017-2028)
Figure 40. North America Ceramide Revenue Share by Country (2017-2028)
Figure 41. U.S. Ceramide Revenue (2017-2028) & (US$ Million)
Figure 42. Canada Ceramide Revenue (2017-2028) & (US$ Million)
Figure 43. Europe Ceramide Sales Market Share by Type (2017-2028)
Figure 44. Europe Ceramide Revenue Market Share by Type (2017-2028)
Figure 45. Europe Ceramide Sales Market Share by Application (2017-2028)
Figure 46. Europe Ceramide Revenue Market Share by Application (2017-2028)
Figure 47. Europe Ceramide Sales Share by Country (2017-2028)
Figure 48. Europe Ceramide Revenue Share by Country (2017-2028)
Figure 49. Germany Ceramide Revenue (2017-2028) & (US$ Million)
Figure 50. France Ceramide Revenue (2017-2028) & (US$ Million)
Figure 51. U.K. Ceramide Revenue (2017-2028) & (US$ Million)
Figure 52. Italy Ceramide Revenue (2017-2028) & (US$ Million)
Figure 53. Russia Ceramide Revenue (2017-2028) & (US$ Million)
Figure 54. Asia Pacific Ceramide Sales Market Share by Type (2017-2028)
Figure 55. Asia Pacific Ceramide Revenue Market Share by Type (2017-2028)
Figure 56. Asia Pacific Ceramide Sales Market Share by Application (2017-2028)
Figure 57. Asia Pacific Ceramide Revenue Market Share by Application (2017-2028)
Figure 58. Asia Pacific Ceramide Sales Share by Region (2017-2028)
Figure 59. Asia Pacific Ceramide Revenue Share by Region (2017-2028)
Figure 60. China Ceramide Revenue (2017-2028) & (US$ Million)
Figure 61. Japan Ceramide Revenue (2017-2028) & (US$ Million)
Figure 62. South Korea Ceramide Revenue (2017-2028) & (US$ Million)
Figure 63. India Ceramide Revenue (2017-2028) & (US$ Million)
Figure 64. Australia Ceramide Revenue (2017-2028) & (US$ Million)
Figure 65. Taiwan Ceramide Revenue (2017-2028) & (US$ Million)
Figure 66. Indonesia Ceramide Revenue (2017-2028) & (US$ Million)
Figure 67. Thailand Ceramide Revenue (2017-2028) & (US$ Million)
Figure 68. Malaysia Ceramide Revenue (2017-2028) & (US$ Million)
Figure 69. Philippines Ceramide Revenue (2017-2028) & (US$ Million)
Figure 70. Latin America Ceramide Sales Market Share by Type (2017-2028)
Figure 71. Latin America Ceramide Revenue Market Share by Type (2017-2028)
Figure 72. Latin America Ceramide Sales Market Share by Application (2017-2028)
Figure 73. Latin America Ceramide Revenue Market Share by Application (2017-2028)
Figure 74. Latin America Ceramide Sales Share by Country (2017-2028)
Figure 75. Latin America Ceramide Revenue Share by Country (2017-2028)
Figure 76. Mexico Ceramide Revenue (2017-2028) & (US$ Million)
Figure 77. Brazil Ceramide Revenue (2017-2028) & (US$ Million)
Figure 78. Argentina Ceramide Revenue (2017-2028) & (US$ Million)
Figure 79. Middle East and Africa Ceramide Sales Market Share by Type (2017-2028)
Figure 80. Middle East and Africa Ceramide Revenue Market Share by Type (2017-2028)
Figure 81. Middle East and Africa Ceramide Sales Market Share by Application (2017-2028)
Figure 82. Middle East and Africa Ceramide Revenue Market Share by Application (2017-2028)
Figure 83. Middle East and Africa Ceramide Sales Share by Country (2017-2028)
Figure 84. Middle East and Africa Ceramide Revenue Share by Country (2017-2028)
Figure 85. Turkey Ceramide Revenue (2017-2028) & (US$ Million)
Figure 86. Saudi Arabia Ceramide Revenue (2017-2028) & (US$ Million)
Figure 87. U.A.E Ceramide Revenue (2017-2028) & (US$ Million)
Figure 88. Ceramide Value Chain
Figure 89. Ceramide Production Process
Figure 90. Channels of Distribution
Figure 91. Distributors Profiles
Figure 92. Bottom-up and Top-down Approaches for This Report
Figure 93. Data Triangulation
Figure 94. Key Executives Interviewed
$4900
$9800
