0
U.S. (TOLL FREE)
+1 (315) 215-3225
Automative

0
U.S. (TOLL FREE)
+1 (315) 215-3225
Global Asset Integrity Management Market Research Report 2023
Published Date: March 2023
|
Report Code: QYRE-Auto-4I6275
Home | Market Reports | Computers & Electronics| Software
Global Asset Integrity Management Market Insights and Forecast to 2028
BUY CHAPTERS

Global Asset Integrity Management Market Research Report 2023

Code: QYRE-Auto-4I6275
Report
March 2023
Pages:103
QYResearch
DESCRIPTION
TABLE OF CONTENT
TABLES & FIGURES

Global Asset Integrity Management Market

The global Asset Integrity Management market was valued at US$ 20480 million in 2022 and is anticipated to reach US$ 27280 million by 2029, witnessing a CAGR of 4.9% during the forecast period 2023-2029. The influence of COVID-19 and the Russia-Ukraine War were considered while estimating market sizes.
North American market for Asset Integrity Management is estimated to increase from $ million in 2023 to reach $ million by 2029, at a CAGR of % during the forecast period of 2023 through 2029.
Asia-Pacific market for Asset Integrity Management is estimated to increase from $ million in 2023 to reach $ million by 2029, at a CAGR of % during the forecast period of 2023 through 2029.
The global market for Asset Integrity Management in Oil and Gas is estimated to increase from $ million in 2023 to $ million by 2029, at a CAGR of % during the forecast period of 2023 through 2029.
The key global companies of Asset Integrity Management include ABB, Applus+, Bureau Veritas, Fluor, General Electric, Intertek, Aker Solutions, Asset Integrity Engineering and Element Materials Technology, etc. In 2022, the world's top three vendors accounted for approximately % of the revenue.

Report Scope

This report aims to provide a comprehensive presentation of the global market for Asset Integrity Management, with both quantitative and qualitative analysis, to help readers develop business/growth strategies, assess the market competitive situation, analyze their position in the current marketplace, and make informed business decisions regarding Asset Integrity Management.
The Asset Integrity Management market size, estimations, and forecasts are provided in terms of and revenue ($ millions), considering 2022 as the base year, with history and forecast data for the period from 2018 to 2029. This report segments the global Asset Integrity Management market comprehensively. Regional market sizes, concerning products by type, by application, and by players, are also provided.
For a more in-depth understanding of the market, the report provides profiles of the competitive landscape, key competitors, and their respective market ranks. The report also discusses technological trends and new product developments.
The report will help the Asset Integrity Management companies, new entrants, and industry chain related companies in this market with information on the revenues for the overall market and the sub-segments across the different segments, by company, by type, by application, and by regions.

Key Segmentations

By Company

  • ABB
  • Applus+
  • Bureau Veritas
  • Fluor
  • General Electric
  • Intertek
  • Aker Solutions
  • Asset Integrity Engineering
  • Element Materials Technology
  • EMandI
  • Factory IQ
  • Geanti Marine Limited
  • Oceaneering International
  • Penspen
  • SGS
  • STAT Marine
  • Viper Innovations

Segment by Type

  • Risk-Based Inspection (RBI)
  • Reliability, Availability, and Maintainability (RAM) Study
  • Corrosion Management
  • Pipeline Integrity Management
  • Hazard Identification (HAZID) Study
  • Structural Integrity Management
  • Nondestructive Testing (NDT) Inspection
  • Others

Segment by Application

  • Oil and Gas
  • Power
  • Mining
  • Aerospace
  • Others

By Region

  • North America
  • United States
  • Canada
  • Europe
  • Germany
  • France
  • UK
  • Italy
  • Russia
  • Nordic Countries
  • Rest of Europe
  • Asia-Pacific
  • China
  • Japan
  • South Korea
  • Southeast Asia
  • India
  • Australia
  • Rest of Asia
  • Latin America
  • Mexico
  • Brazil
  • Rest of Latin America
  • Middle East & Africa
  • Turkey
  • Saudi Arabia
  • UAE
  • Rest of MEA

Core Chapters

  • Chapter 1: Introduces the report scope of the report, executive summary of different market segments (by type, application, etc), including the market size of each market segment, future development potential, and so on. It offers a high-level view of the current state of the market and its likely evolution in the short to mid-term, and long term.
  • Chapter 2: Introduces executive summary of global market size, regional market size, this section also introduces the market dynamics, latest developments of the market, the driving factors and restrictive factors of the market, the challenges and risks faced by companies in the industry, and the analysis of relevant policies in the industry.
  • Chapter 3: Detailed analysis of Asset Integrity Management companies’ competitive landscape, revenue market share, latest development plan, merger, and acquisition information, etc.
  • Chapter 4: Provides the analysis of various market segments by type, covering the market size and development potential of each market segment, to help readers find the blue ocean market in different market segments.
  • Chapter 5: Provides the analysis of various market segments by application, covering the market size and development potential of each market segment, to help readers find the blue ocean market in different downstream markets.
  • Chapter 6, 7, 8, 9, 10: North America, Europe, Asia Pacific, Latin America, Middle East and Africa segment by country. It provides a quantitative analysis of the market size and development potential of each region and its main countries and introduces the market development, future development prospects, market space, and capacity of each country in the world.
  • Chapter 11: Provides profiles of key players, introducing the basic situation of the key companies in the market in detail, including product revenue, gross margin, product introduction, recent development, etc.
  • Chapter 12: The main points and conclusions of the report.

Scope of Global Asset Integrity Management Market Report

Report MetricDetails
Report NameGlobal Asset Integrity Management Market
Base Year2022
Forecasted years2023-2029
Forecast unitsUSD
Report coverageRevenue and volume forecast, company share, competitive landscape, growth factors and trends
Geographic regions coveredNorth America, Europe, Asia Pacific, Latin America, Middle East & Africa
1 Report Overview
1.1 Study Scope
1.2 Market Analysis by Type
1.2.1 Global Asset Integrity Management Market Size Growth Rate by Type: 2018 VS 2022 VS 2029
1.2.2 Risk-Based Inspection (RBI)
1.2.3 Reliability, Availability, and Maintainability (RAM) Study
1.2.4 Corrosion Management
1.2.5 Pipeline Integrity Management
1.2.6 Hazard Identification (HAZID) Study
1.2.7 Structural Integrity Management
1.2.8 Nondestructive Testing (NDT) Inspection
1.2.9 Others
1.3 Market by Application
1.3.1 Global Asset Integrity Management Market Growth by Application: 2018 VS 2022 VS 2029
1.3.2 Oil and Gas
1.3.3 Power
1.3.4 Mining
1.3.5 Aerospace
1.3.6 Others
1.4 Study Objectives
1.5 Years Considered
1.6 Years Considered
2 Global Growth Trends
2.1 Global Asset Integrity Management Market Perspective (2018-2029)
2.2 Asset Integrity Management Growth Trends by Region
2.2.1 Global Asset Integrity Management Market Size by Region: 2018 VS 2022 VS 2029
2.2.2 Asset Integrity Management Historic Market Size by Region (2018-2023)
2.2.3 Asset Integrity Management Forecasted Market Size by Region (2024-2029)
2.3 Asset Integrity Management Market Dynamics
2.3.1 Asset Integrity Management Industry Trends
2.3.2 Asset Integrity Management Market Drivers
2.3.3 Asset Integrity Management Market Challenges
2.3.4 Asset Integrity Management Market Restraints
3 Competition Landscape by Key Players
3.1 Global Top Asset Integrity Management Players by Revenue
3.1.1 Global Top Asset Integrity Management Players by Revenue (2018-2023)
3.1.2 Global Asset Integrity Management Revenue Market Share by Players (2018-2023)
3.2 Global Asset Integrity Management Market Share by Company Type (Tier 1, Tier 2, and Tier 3)
3.3 Players Covered: Ranking by Asset Integrity Management Revenue
3.4 Global Asset Integrity Management Market Concentration Ratio
3.4.1 Global Asset Integrity Management Market Concentration Ratio (CR5 and HHI)
3.4.2 Global Top 10 and Top 5 Companies by Asset Integrity Management Revenue in 2022
3.5 Asset Integrity Management Key Players Head office and Area Served
3.6 Key Players Asset Integrity Management Product Solution and Service
3.7 Date of Enter into Asset Integrity Management Market
3.8 Mergers & Acquisitions, Expansion Plans
4 Asset Integrity Management Breakdown Data by Type
4.1 Global Asset Integrity Management Historic Market Size by Type (2018-2023)
4.2 Global Asset Integrity Management Forecasted Market Size by Type (2024-2029)
5 Asset Integrity Management Breakdown Data by Application
5.1 Global Asset Integrity Management Historic Market Size by Application (2018-2023)
5.2 Global Asset Integrity Management Forecasted Market Size by Application (2024-2029)
6 North America
6.1 North America Asset Integrity Management Market Size (2018-2029)
6.2 North America Asset Integrity Management Market Growth Rate by Country: 2018 VS 2022 VS 2029
6.3 North America Asset Integrity Management Market Size by Country (2018-2023)
6.4 North America Asset Integrity Management Market Size by Country (2024-2029)
6.5 United States
6.6 Canada
7 Europe
7.1 Europe Asset Integrity Management Market Size (2018-2029)
7.2 Europe Asset Integrity Management Market Growth Rate by Country: 2018 VS 2022 VS 2029
7.3 Europe Asset Integrity Management Market Size by Country (2018-2023)
7.4 Europe Asset Integrity Management Market Size by Country (2024-2029)
7.5 Germany
7.6 France
7.7 U.K.
7.8 Italy
7.9 Russia
7.10 Nordic Countries
8 Asia-Pacific
8.1 Asia-Pacific Asset Integrity Management Market Size (2018-2029)
8.2 Asia-Pacific Asset Integrity Management Market Growth Rate by Region: 2018 VS 2022 VS 2029
8.3 Asia-Pacific Asset Integrity Management Market Size by Region (2018-2023)
8.4 Asia-Pacific Asset Integrity Management Market Size by Region (2024-2029)
8.5 China
8.6 Japan
8.7 South Korea
8.8 Southeast Asia
8.9 India
8.10 Australia
9 Latin America
9.1 Latin America Asset Integrity Management Market Size (2018-2029)
9.2 Latin America Asset Integrity Management Market Growth Rate by Country: 2018 VS 2022 VS 2029
9.3 Latin America Asset Integrity Management Market Size by Country (2018-2023)
9.4 Latin America Asset Integrity Management Market Size by Country (2024-2029)
9.5 Mexico
9.6 Brazil
10 Middle East & Africa
10.1 Middle East & Africa Asset Integrity Management Market Size (2018-2029)
10.2 Middle East & Africa Asset Integrity Management Market Growth Rate by Country: 2018 VS 2022 VS 2029
10.3 Middle East & Africa Asset Integrity Management Market Size by Country (2018-2023)
10.4 Middle East & Africa Asset Integrity Management Market Size by Country (2024-2029)
10.5 Turkey
10.6 Saudi Arabia
10.7 UAE
11 Key Players Profiles
11.1 ABB
11.1.1 ABB Company Detail
11.1.2 ABB Business Overview
11.1.3 ABB Asset Integrity Management Introduction
11.1.4 ABB Revenue in Asset Integrity Management Business (2018-2023)
11.1.5 ABB Recent Development
11.2 Applus+
11.2.1 Applus+ Company Detail
11.2.2 Applus+ Business Overview
11.2.3 Applus+ Asset Integrity Management Introduction
11.2.4 Applus+ Revenue in Asset Integrity Management Business (2018-2023)
11.2.5 Applus+ Recent Development
11.3 Bureau Veritas
11.3.1 Bureau Veritas Company Detail
11.3.2 Bureau Veritas Business Overview
11.3.3 Bureau Veritas Asset Integrity Management Introduction
11.3.4 Bureau Veritas Revenue in Asset Integrity Management Business (2018-2023)
11.3.5 Bureau Veritas Recent Development
11.4 Fluor
11.4.1 Fluor Company Detail
11.4.2 Fluor Business Overview
11.4.3 Fluor Asset Integrity Management Introduction
11.4.4 Fluor Revenue in Asset Integrity Management Business (2018-2023)
11.4.5 Fluor Recent Development
11.5 General Electric
11.5.1 General Electric Company Detail
11.5.2 General Electric Business Overview
11.5.3 General Electric Asset Integrity Management Introduction
11.5.4 General Electric Revenue in Asset Integrity Management Business (2018-2023)
11.5.5 General Electric Recent Development
11.6 Intertek
11.6.1 Intertek Company Detail
11.6.2 Intertek Business Overview
11.6.3 Intertek Asset Integrity Management Introduction
11.6.4 Intertek Revenue in Asset Integrity Management Business (2018-2023)
11.6.5 Intertek Recent Development
11.7 Aker Solutions
11.7.1 Aker Solutions Company Detail
11.7.2 Aker Solutions Business Overview
11.7.3 Aker Solutions Asset Integrity Management Introduction
11.7.4 Aker Solutions Revenue in Asset Integrity Management Business (2018-2023)
11.7.5 Aker Solutions Recent Development
11.8 Asset Integrity Engineering
11.8.1 Asset Integrity Engineering Company Detail
11.8.2 Asset Integrity Engineering Business Overview
11.8.3 Asset Integrity Engineering Asset Integrity Management Introduction
11.8.4 Asset Integrity Engineering Revenue in Asset Integrity Management Business (2018-2023)
11.8.5 Asset Integrity Engineering Recent Development
11.9 Element Materials Technology
11.9.1 Element Materials Technology Company Detail
11.9.2 Element Materials Technology Business Overview
11.9.3 Element Materials Technology Asset Integrity Management Introduction
11.9.4 Element Materials Technology Revenue in Asset Integrity Management Business (2018-2023)
11.9.5 Element Materials Technology Recent Development
11.10 EMandI
11.10.1 EMandI Company Detail
11.10.2 EMandI Business Overview
11.10.3 EMandI Asset Integrity Management Introduction
11.10.4 EMandI Revenue in Asset Integrity Management Business (2018-2023)
11.10.5 EMandI Recent Development
11.11 Factory IQ
11.11.1 Factory IQ Company Detail
11.11.2 Factory IQ Business Overview
11.11.3 Factory IQ Asset Integrity Management Introduction
11.11.4 Factory IQ Revenue in Asset Integrity Management Business (2018-2023)
11.11.5 Factory IQ Recent Development
11.12 Geanti Marine Limited
11.12.1 Geanti Marine Limited Company Detail
11.12.2 Geanti Marine Limited Business Overview
11.12.3 Geanti Marine Limited Asset Integrity Management Introduction
11.12.4 Geanti Marine Limited Revenue in Asset Integrity Management Business (2018-2023)
11.12.5 Geanti Marine Limited Recent Development
11.13 Oceaneering International
11.13.1 Oceaneering International Company Detail
11.13.2 Oceaneering International Business Overview
11.13.3 Oceaneering International Asset Integrity Management Introduction
11.13.4 Oceaneering International Revenue in Asset Integrity Management Business (2018-2023)
11.13.5 Oceaneering International Recent Development
11.14 Penspen
11.14.1 Penspen Company Detail
11.14.2 Penspen Business Overview
11.14.3 Penspen Asset Integrity Management Introduction
11.14.4 Penspen Revenue in Asset Integrity Management Business (2018-2023)
11.14.5 Penspen Recent Development
11.15 SGS
11.15.1 SGS Company Detail
11.15.2 SGS Business Overview
11.15.3 SGS Asset Integrity Management Introduction
11.15.4 SGS Revenue in Asset Integrity Management Business (2018-2023)
11.15.5 SGS Recent Development
11.16 STAT Marine
11.16.1 STAT Marine Company Detail
11.16.2 STAT Marine Business Overview
11.16.3 STAT Marine Asset Integrity Management Introduction
11.16.4 STAT Marine Revenue in Asset Integrity Management Business (2018-2023)
11.16.5 STAT Marine Recent Development
11.17 Viper Innovations
11.17.1 Viper Innovations Company Detail
11.17.2 Viper Innovations Business Overview
11.17.3 Viper Innovations Asset Integrity Management Introduction
11.17.4 Viper Innovations Revenue in Asset Integrity Management Business (2018-2023)
11.17.5 Viper Innovations Recent Development
12 Analyst's Viewpoints/Conclusions
13 Appendix
13.1 Research Methodology
13.1.1 Methodology/Research Approach
13.1.2 Data Source
13.2 Disclaimer
13.3 Author Details
List of Tables
    Table 1. Global Asset Integrity Management Market Size Growth Rate by Type (US$ Million): 2018 VS 2022 VS 2029
    Table 2. Key Players of Risk-Based Inspection (RBI)
    Table 3. Key Players of Reliability, Availability, and Maintainability (RAM) Study
    Table 4. Key Players of Corrosion Management
    Table 5. Key Players of Pipeline Integrity Management
    Table 6. Key Players of Hazard Identification (HAZID) Study
    Table 7. Key Players of Structural Integrity Management
    Table 8. Key Players of Nondestructive Testing (NDT) Inspection
    Table 9. Key Players of Others
    Table 10. Global Asset Integrity Management Market Size Growth by Application (US$ Million): 2018 VS 2022 VS 2029
    Table 11. Global Asset Integrity Management Market Size by Region (US$ Million): 2018 VS 2022 VS 2029
    Table 12. Global Asset Integrity Management Market Size by Region (2018-2023) & (US$ Million)
    Table 13. Global Asset Integrity Management Market Share by Region (2018-2023)
    Table 14. Global Asset Integrity Management Forecasted Market Size by Region (2024-2029) & (US$ Million)
    Table 15. Global Asset Integrity Management Market Share by Region (2024-2029)
    Table 16. Asset Integrity Management Market Trends
    Table 17. Asset Integrity Management Market Drivers
    Table 18. Asset Integrity Management Market Challenges
    Table 19. Asset Integrity Management Market Restraints
    Table 20. Global Asset Integrity Management Revenue by Players (2018-2023) & (US$ Million)
    Table 21. Global Asset Integrity Management Market Share by Players (2018-2023)
    Table 22. Global Top Asset Integrity Management Players by Company Type (Tier 1, Tier 2, and Tier 3) & (based on the Revenue in Asset Integrity Management as of 2022)
    Table 23. Ranking of Global Top Asset Integrity Management Companies by Revenue (US$ Million) in 2022
    Table 24. Global 5 Largest Players Market Share by Asset Integrity Management Revenue (CR5 and HHI) & (2018-2023)
    Table 25. Key Players Headquarters and Area Served
    Table 26. Key Players Asset Integrity Management Product Solution and Service
    Table 27. Date of Enter into Asset Integrity Management Market
    Table 28. Mergers & Acquisitions, Expansion Plans
    Table 29. Global Asset Integrity Management Market Size by Type (2018-2023) & (US$ Million)
    Table 30. Global Asset Integrity Management Revenue Market Share by Type (2018-2023)
    Table 31. Global Asset Integrity Management Forecasted Market Size by Type (2024-2029) & (US$ Million)
    Table 32. Global Asset Integrity Management Revenue Market Share by Type (2024-2029)
    Table 33. Global Asset Integrity Management Market Size by Application (2018-2023) & (US$ Million)
    Table 34. Global Asset Integrity Management Revenue Market Share by Application (2018-2023)
    Table 35. Global Asset Integrity Management Forecasted Market Size by Application (2024-2029) & (US$ Million)
    Table 36. Global Asset Integrity Management Revenue Market Share by Application (2024-2029)
    Table 37. North America Asset Integrity Management Market Size Growth Rate by Country (US$ Million): 2018 VS 2022 VS 2029
    Table 38. North America Asset Integrity Management Market Size by Country (2018-2023) & (US$ Million)
    Table 39. North America Asset Integrity Management Market Size by Country (2024-2029) & (US$ Million)
    Table 40. Europe Asset Integrity Management Market Size Growth Rate by Country (US$ Million): 2018 VS 2022 VS 2029
    Table 41. Europe Asset Integrity Management Market Size by Country (2018-2023) & (US$ Million)
    Table 42. Europe Asset Integrity Management Market Size by Country (2024-2029) & (US$ Million)
    Table 43. Asia-Pacific Asset Integrity Management Market Size Growth Rate by Region (US$ Million): 2018 VS 2022 VS 2029
    Table 44. Asia-Pacific Asset Integrity Management Market Size by Region (2018-2023) & (US$ Million)
    Table 45. Asia-Pacific Asset Integrity Management Market Size by Region (2024-2029) & (US$ Million)
    Table 46. Latin America Asset Integrity Management Market Size Growth Rate by Country (US$ Million): 2018 VS 2022 VS 2029
    Table 47. Latin America Asset Integrity Management Market Size by Country (2018-2023) & (US$ Million)
    Table 48. Latin America Asset Integrity Management Market Size by Country (2024-2029) & (US$ Million)
    Table 49. Middle East & Africa Asset Integrity Management Market Size Growth Rate by Country (US$ Million): 2018 VS 2022 VS 2029
    Table 50. Middle East & Africa Asset Integrity Management Market Size by Country (2018-2023) & (US$ Million)
    Table 51. Middle East & Africa Asset Integrity Management Market Size by Country (2024-2029) & (US$ Million)
    Table 52. ABB Company Detail
    Table 53. ABB Business Overview
    Table 54. ABB Asset Integrity Management Product
    Table 55. ABB Revenue in Asset Integrity Management Business (2018-2023) & (US$ Million)
    Table 56. ABB Recent Development
    Table 57. Applus+ Company Detail
    Table 58. Applus+ Business Overview
    Table 59. Applus+ Asset Integrity Management Product
    Table 60. Applus+ Revenue in Asset Integrity Management Business (2018-2023) & (US$ Million)
    Table 61. Applus+ Recent Development
    Table 62. Bureau Veritas Company Detail
    Table 63. Bureau Veritas Business Overview
    Table 64. Bureau Veritas Asset Integrity Management Product
    Table 65. Bureau Veritas Revenue in Asset Integrity Management Business (2018-2023) & (US$ Million)
    Table 66. Bureau Veritas Recent Development
    Table 67. Fluor Company Detail
    Table 68. Fluor Business Overview
    Table 69. Fluor Asset Integrity Management Product
    Table 70. Fluor Revenue in Asset Integrity Management Business (2018-2023) & (US$ Million)
    Table 71. Fluor Recent Development
    Table 72. General Electric Company Detail
    Table 73. General Electric Business Overview
    Table 74. General Electric Asset Integrity Management Product
    Table 75. General Electric Revenue in Asset Integrity Management Business (2018-2023) & (US$ Million)
    Table 76. General Electric Recent Development
    Table 77. Intertek Company Detail
    Table 78. Intertek Business Overview
    Table 79. Intertek Asset Integrity Management Product
    Table 80. Intertek Revenue in Asset Integrity Management Business (2018-2023) & (US$ Million)
    Table 81. Intertek Recent Development
    Table 82. Aker Solutions Company Detail
    Table 83. Aker Solutions Business Overview
    Table 84. Aker Solutions Asset Integrity Management Product
    Table 85. Aker Solutions Revenue in Asset Integrity Management Business (2018-2023) & (US$ Million)
    Table 86. Aker Solutions Recent Development
    Table 87. Asset Integrity Engineering Company Detail
    Table 88. Asset Integrity Engineering Business Overview
    Table 89. Asset Integrity Engineering Asset Integrity Management Product
    Table 90. Asset Integrity Engineering Revenue in Asset Integrity Management Business (2018-2023) & (US$ Million)
    Table 91. Asset Integrity Engineering Recent Development
    Table 92. Element Materials Technology Company Detail
    Table 93. Element Materials Technology Business Overview
    Table 94. Element Materials Technology Asset Integrity Management Product
    Table 95. Element Materials Technology Revenue in Asset Integrity Management Business (2018-2023) & (US$ Million)
    Table 96. Element Materials Technology Recent Development
    Table 97. EMandI Company Detail
    Table 98. EMandI Business Overview
    Table 99. EMandI Asset Integrity Management Product
    Table 100. EMandI Revenue in Asset Integrity Management Business (2018-2023) & (US$ Million)
    Table 101. EMandI Recent Development
    Table 102. Factory IQ Company Detail
    Table 103. Factory IQ Business Overview
    Table 104. Factory IQ Asset Integrity Management Product
    Table 105. Factory IQ Revenue in Asset Integrity Management Business (2018-2023) & (US$ Million)
    Table 106. Factory IQ Recent Development
    Table 107. Geanti Marine Limited Company Detail
    Table 108. Geanti Marine Limited Business Overview
    Table 109. Geanti Marine Limited Asset Integrity Management Product
    Table 110. Geanti Marine Limited Revenue in Asset Integrity Management Business (2018-2023) & (US$ Million)
    Table 111. Geanti Marine Limited Recent Development
    Table 112. Oceaneering International Company Detail
    Table 113. Oceaneering International Business Overview
    Table 114. Oceaneering International Asset Integrity Management Product
    Table 115. Oceaneering International Revenue in Asset Integrity Management Business (2018-2023) & (US$ Million)
    Table 116. Oceaneering International Recent Development
    Table 117. Penspen Company Detail
    Table 118. Penspen Business Overview
    Table 119. Penspen Asset Integrity Management Product
    Table 120. Penspen Revenue in Asset Integrity Management Business (2018-2023) & (US$ Million)
    Table 121. Penspen Recent Development
    Table 122. SGS Company Detail
    Table 123. SGS Business Overview
    Table 124. SGS Asset Integrity Management Product
    Table 125. SGS Revenue in Asset Integrity Management Business (2018-2023) & (US$ Million)
    Table 126. SGS Recent Development
    Table 127. STAT Marine Company Detail
    Table 128. STAT Marine Business Overview
    Table 129. STAT Marine Asset Integrity Management Product
    Table 130. STAT Marine Revenue in Asset Integrity Management Business (2018-2023) & (US$ Million)
    Table 131. STAT Marine Recent Development
    Table 132. Viper Innovations Company Detail
    Table 133. Viper Innovations Business Overview
    Table 134. Viper Innovations Asset Integrity Management Product
    Table 135. Viper Innovations Revenue in Asset Integrity Management Business (2018-2023) & (US$ Million)
    Table 136. Viper Innovations Recent Development
    Table 137. Research Programs/Design for This Report
    Table 138. Key Data Information from Secondary Sources
    Table 139. Key Data Information from Primary Sources
List of Figures
    Figure 1. Global Asset Integrity Management Market Size Comparison by Type (2023-2029) & (US$ Million)
    Figure 2. Global Asset Integrity Management Market Share by Type: 2022 VS 2029
    Figure 3. Risk-Based Inspection (RBI) Features
    Figure 4. Reliability, Availability, and Maintainability (RAM) Study Features
    Figure 5. Corrosion Management Features
    Figure 6. Pipeline Integrity Management Features
    Figure 7. Hazard Identification (HAZID) Study Features
    Figure 8. Structural Integrity Management Features
    Figure 9. Nondestructive Testing (NDT) Inspection Features
    Figure 10. Others Features
    Figure 11. Global Asset Integrity Management Market Size Comparison by Application (2023-2029) & (US$ Million)
    Figure 12. Global Asset Integrity Management Market Share by Application: 2022 VS 2029
    Figure 13. Oil and Gas Case Studies
    Figure 14. Power Case Studies
    Figure 15. Mining Case Studies
    Figure 16. Aerospace Case Studies
    Figure 17. Others Case Studies
    Figure 18. Asset Integrity Management Report Years Considered
    Figure 19. Global Asset Integrity Management Market Size (US$ Million), Year-over-Year: 2018-2029
    Figure 20. Global Asset Integrity Management Market Size, (US$ Million), 2018 VS 2022 VS 2029
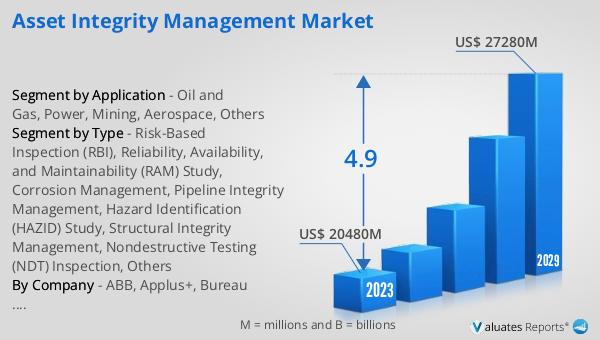
    Figure 21. Global Asset Integrity Management Market Share by Region: 2022 VS 2029
    Figure 22. Global Asset Integrity Management Market Share by Players in 2022
    Figure 23. Global Top Asset Integrity Management Players by Company Type (Tier 1, Tier 2, and Tier 3) & (based on the Revenue in Asset Integrity Management as of 2022)
    Figure 24. The Top 10 and 5 Players Market Share by Asset Integrity Management Revenue in 2022
    Figure 25. North America Asset Integrity Management Market Size YoY Growth (2018-2029) & (US$ Million)
    Figure 26. North America Asset Integrity Management Market Share by Country (2018-2029)
    Figure 27. United States Asset Integrity Management Market Size YoY Growth (2018-2029) & (US$ Million)
    Figure 28. Canada Asset Integrity Management Market Size YoY Growth (2018-2029) & (US$ Million)
    Figure 29. Europe Asset Integrity Management Market Size YoY Growth (2018-2029) & (US$ Million)
    Figure 30. Europe Asset Integrity Management Market Share by Country (2018-2029)
    Figure 31. Germany Asset Integrity Management Market Size YoY Growth (2018-2029) & (US$ Million)
    Figure 32. France Asset Integrity Management Market Size YoY Growth (2018-2029) & (US$ Million)
    Figure 33. U.K. Asset Integrity Management Market Size YoY Growth (2018-2029) & (US$ Million)
    Figure 34. Italy Asset Integrity Management Market Size YoY Growth (2018-2029) & (US$ Million)
    Figure 35. Russia Asset Integrity Management Market Size YoY Growth (2018-2029) & (US$ Million)
    Figure 36. Nordic Countries Asset Integrity Management Market Size YoY Growth (2018-2029) & (US$ Million)
    Figure 37. Asia-Pacific Asset Integrity Management Market Size YoY Growth (2018-2029) & (US$ Million)
    Figure 38. Asia-Pacific Asset Integrity Management Market Share by Region (2018-2029)
    Figure 39. China Asset Integrity Management Market Size YoY Growth (2018-2029) & (US$ Million)
    Figure 40. Japan Asset Integrity Management Market Size YoY Growth (2018-2029) & (US$ Million)
    Figure 41. South Korea Asset Integrity Management Market Size YoY Growth (2018-2029) & (US$ Million)
    Figure 42. Southeast Asia Asset Integrity Management Market Size YoY Growth (2018-2029) & (US$ Million)
    Figure 43. India Asset Integrity Management Market Size YoY Growth (2018-2029) & (US$ Million)
    Figure 44. Australia Asset Integrity Management Market Size YoY Growth (2018-2029) & (US$ Million)
    Figure 45. Latin America Asset Integrity Management Market Size YoY Growth (2018-2029) & (US$ Million)
    Figure 46. Latin America Asset Integrity Management Market Share by Country (2018-2029)
    Figure 47. Mexico Asset Integrity Management Market Size YoY Growth (2018-2029) & (US$ Million)
    Figure 48. Brazil Asset Integrity Management Market Size YoY Growth (2018-2029) & (US$ Million)
    Figure 49. Middle East & Africa Asset Integrity Management Market Size YoY Growth (2018-2029) & (US$ Million)
    Figure 50. Middle East & Africa Asset Integrity Management Market Share by Country (2018-2029)
    Figure 51. Turkey Asset Integrity Management Market Size YoY Growth (2018-2029) & (US$ Million)
    Figure 52. Saudi Arabia Asset Integrity Management Market Size YoY Growth (2018-2029) & (US$ Million)
    Figure 53. ABB Revenue Growth Rate in Asset Integrity Management Business (2018-2023)
    Figure 54. Applus+ Revenue Growth Rate in Asset Integrity Management Business (2018-2023)
    Figure 55. Bureau Veritas Revenue Growth Rate in Asset Integrity Management Business (2018-2023)
    Figure 56. Fluor Revenue Growth Rate in Asset Integrity Management Business (2018-2023)
    Figure 57. General Electric Revenue Growth Rate in Asset Integrity Management Business (2018-2023)
    Figure 58. Intertek Revenue Growth Rate in Asset Integrity Management Business (2018-2023)
    Figure 59. Aker Solutions Revenue Growth Rate in Asset Integrity Management Business (2018-2023)
    Figure 60. Asset Integrity Engineering Revenue Growth Rate in Asset Integrity Management Business (2018-2023)
    Figure 61. Element Materials Technology Revenue Growth Rate in Asset Integrity Management Business (2018-2023)
    Figure 62. EMandI Revenue Growth Rate in Asset Integrity Management Business (2018-2023)
    Figure 63. Factory IQ Revenue Growth Rate in Asset Integrity Management Business (2018-2023)
    Figure 64. Geanti Marine Limited Revenue Growth Rate in Asset Integrity Management Business (2018-2023)
    Figure 65. Oceaneering International Revenue Growth Rate in Asset Integrity Management Business (2018-2023)
    Figure 66. Penspen Revenue Growth Rate in Asset Integrity Management Business (2018-2023)
    Figure 67. SGS Revenue Growth Rate in Asset Integrity Management Business (2018-2023)
    Figure 68. STAT Marine Revenue Growth Rate in Asset Integrity Management Business (2018-2023)
    Figure 69. Viper Innovations Revenue Growth Rate in Asset Integrity Management Business (2018-2023)
    Figure 70. Bottom-up and Top-down Approaches for This Report
    Figure 71. Data Triangulation
    Figure 72. Key Executives Interviewed
SELECT A FORMAT
Added to Cart
Electronic (PDF)

$2900

This license allows only one user to access the PDF.
Electronic (PDF)

$4350

This license allows 1 - 5 user to access the PDF, license is suitable for small groups of 5 users working together
Electronic (PDF)

$5800

This license allows users/teams in a same Enterprise to use this report, various departments within an enterpise can use this report
Add to Cart
Buy Now (10% Discount)

OUR CUSTOMER

Nano Dimension

SIMILAR REPORTS


RELATED REPORTS

Global Floating Offices Market Research Report 2023

120 Pages
Type: Report
Code: QYRE-Auto-12Z2788
Fri Apr 28 00:00:00 UTC 2023

Add to Cart

Global Floating Houses Market Research Report 2023

120 Pages
Type: Report
Code: QYRE-Auto-11M2931
Fri Apr 28 00:00:00 UTC 2023

Add to Cart

Global MEMS Design Service Market Research Report 2023

120 Pages
Type: Report
Code: QYRE-Auto-16R5977
Fri Apr 28 00:00:00 UTC 2023

Add to Cart

Global ASIC Design Service Market Research Report 2023

120 Pages
Type: Report
Code: QYRE-Auto-27R5718
Fri Apr 28 00:00:00 UTC 2023

Add to Cart