List of Tables
Table 1. Global Contract Mining Services Market Size Growth Rate By Mining Method (US$ Million): 2020 VS 2024 VS 2031
Table 2. Key Players of Surface Mining
Table 3. Key Players of Underground Mining
Table 4. Global Contract Mining Services Market Size Growth by Application (US$ Million): 2020 VS 2024 VS 2031
Table 5. Global Contract Mining Services Market Size by Region (US$ Million): 2020 VS 2024 VS 2031
Table 6. Global Contract Mining Services Market Size by Region (2020-2025) & (US$ Million)
Table 7. Global Contract Mining Services Market Share by Region (2020-2025)
Table 8. Global Contract Mining Services Forecasted Market Size by Region (2026-2031) & (US$ Million)
Table 9. Global Contract Mining Services Market Share by Region (2026-2031)
Table 10. Contract Mining Services Market Trends
Table 11. Contract Mining Services Market Drivers
Table 12. Contract Mining Services Market Challenges
Table 13. Contract Mining Services Market Restraints
Table 14. Global Contract Mining Services Revenue by Players (2020-2025) & (US$ Million)
Table 15. Global Contract Mining Services Market Share by Players (2020-2025)
Table 16. Global Top Contract Mining Services Players by Company Type (Tier 1, Tier 2, and Tier 3) & (based on the Revenue in Contract Mining Services as of 2024)
Table 17. Ranking of Global Top Contract Mining Services Companies by Revenue (US$ Million) in 2024
Table 18. Global 5 Largest Players Market Share by Contract Mining Services Revenue (CR5 and HHI) & (2020-2025)
Table 19. Global Key Players of Contract Mining Services, Headquarters and Area Served
Table 20. Global Key Players of Contract Mining Services, Product and Application
Table 21. Global Key Players of Contract Mining Services, Date of Enter into This Industry
Table 22. Mergers & Acquisitions, Expansion Plans
Table 23. Global Contract Mining Services Market Size By Mining Method (2020-2025) & (US$ Million)
Table 24. Global Contract Mining Services Revenue Market Share By Mining Method (2020-2025)
Table 25. Global Contract Mining Services Forecasted Market Size By Mining Method (2026-2031) & (US$ Million)
Table 26. Global Contract Mining Services Revenue Market Share By Mining Method (2026-2031)
Table 27. Global Contract Mining Services Market Size by Application (2020-2025) & (US$ Million)
Table 28. Global Contract Mining Services Revenue Market Share by Application (2020-2025)
Table 29. Global Contract Mining Services Forecasted Market Size by Application (2026-2031) & (US$ Million)
Table 30. Global Contract Mining Services Revenue Market Share by Application (2026-2031)
Table 31. North America Contract Mining Services Market Size Growth Rate by Country (US$ Million): 2020 VS 2024 VS 2031
Table 32. North America Contract Mining Services Market Size by Country (2020-2025) & (US$ Million)
Table 33. North America Contract Mining Services Market Size by Country (2026-2031) & (US$ Million)
Table 34. Europe Contract Mining Services Market Size Growth Rate by Country (US$ Million): 2020 VS 2024 VS 2031
Table 35. Europe Contract Mining Services Market Size by Country (2020-2025) & (US$ Million)
Table 36. Europe Contract Mining Services Market Size by Country (2026-2031) & (US$ Million)
Table 37. Asia-Pacific Contract Mining Services Market Size Growth Rate by Region (US$ Million): 2020 VS 2024 VS 2031
Table 38. Asia-Pacific Contract Mining Services Market Size by Region (2020-2025) & (US$ Million)
Table 39. Asia-Pacific Contract Mining Services Market Size by Region (2026-2031) & (US$ Million)
Table 40. Latin America Contract Mining Services Market Size Growth Rate by Country (US$ Million): 2020 VS 2024 VS 2031
Table 41. Latin America Contract Mining Services Market Size by Country (2020-2025) & (US$ Million)
Table 42. Latin America Contract Mining Services Market Size by Country (2026-2031) & (US$ Million)
Table 43. Middle East & Africa Contract Mining Services Market Size Growth Rate by Country (US$ Million): 2020 VS 2024 VS 2031
Table 44. Middle East & Africa Contract Mining Services Market Size by Country (2020-2025) & (US$ Million)
Table 45. Middle East & Africa Contract Mining Services Market Size by Country (2026-2031) & (US$ Million)
Table 46. Teichmann Group Company Details
Table 47. Teichmann Group Business Overview
Table 48. Teichmann Group Contract Mining Services Product
Table 49. Teichmann Group Revenue in Contract Mining Services Business (2020-2025) & (US$ Million)
Table 50. Teichmann Group Recent Development
Table 51. Contract Mining Services Pty Ltd (CMS) Company Details
Table 52. Contract Mining Services Pty Ltd (CMS) Business Overview
Table 53. Contract Mining Services Pty Ltd (CMS) Contract Mining Services Product
Table 54. Contract Mining Services Pty Ltd (CMS) Revenue in Contract Mining Services Business (2020-2025) & (US$ Million)
Table 55. Contract Mining Services Pty Ltd (CMS) Recent Development
Table 56. Laxyo Group Company Details
Table 57. Laxyo Group Business Overview
Table 58. Laxyo Group Contract Mining Services Product
Table 59. Laxyo Group Revenue in Contract Mining Services Business (2020-2025) & (US$ Million)
Table 60. Laxyo Group Recent Development
Table 61. PT Delta Dunia Makmur Tbk Company Details
Table 62. PT Delta Dunia Makmur Tbk Business Overview
Table 63. PT Delta Dunia Makmur Tbk Contract Mining Services Product
Table 64. PT Delta Dunia Makmur Tbk Revenue in Contract Mining Services Business (2020-2025) & (US$ Million)
Table 65. PT Delta Dunia Makmur Tbk Recent Development
Table 66. PYBAR Mining Services Company Details
Table 67. PYBAR Mining Services Business Overview
Table 68. PYBAR Mining Services Contract Mining Services Product
Table 69. PYBAR Mining Services Revenue in Contract Mining Services Business (2020-2025) & (US$ Million)
Table 70. PYBAR Mining Services Recent Development
Table 71. Exact Mining Group Company Details
Table 72. Exact Mining Group Business Overview
Table 73. Exact Mining Group Contract Mining Services Product
Table 74. Exact Mining Group Revenue in Contract Mining Services Business (2020-2025) & (US$ Million)
Table 75. Exact Mining Group Recent Development
Table 76. NRW Holdings Limited Company Details
Table 77. NRW Holdings Limited Business Overview
Table 78. NRW Holdings Limited Contract Mining Services Product
Table 79. NRW Holdings Limited Revenue in Contract Mining Services Business (2020-2025) & (US$ Million)
Table 80. NRW Holdings Limited Recent Development
Table 81. CIMIC Group Company Details
Table 82. CIMIC Group Business Overview
Table 83. CIMIC Group Contract Mining Services Product
Table 84. CIMIC Group Revenue in Contract Mining Services Business (2020-2025) & (US$ Million)
Table 85. CIMIC Group Recent Development
Table 86. Macmahon Company Details
Table 87. Macmahon Business Overview
Table 88. Macmahon Contract Mining Services Product
Table 89. Macmahon Revenue in Contract Mining Services Business (2020-2025) & (US$ Million)
Table 90. Macmahon Recent Development
Table 91. Perenti Group Company Details
Table 92. Perenti Group Business Overview
Table 93. Perenti Group Contract Mining Services Product
Table 94. Perenti Group Revenue in Contract Mining Services Business (2020-2025) & (US$ Million)
Table 95. Perenti Group Recent Development
Table 96. Ledcor Group Company Details
Table 97. Ledcor Group Business Overview
Table 98. Ledcor Group Contract Mining Services Product
Table 99. Ledcor Group Revenue in Contract Mining Services Business (2020-2025) & (US$ Million)
Table 100. Ledcor Group Recent Development
Table 101. SGS SA Company Details
Table 102. SGS SA Business Overview
Table 103. SGS SA Contract Mining Services Product
Table 104. SGS SA Revenue in Contract Mining Services Business (2020-2025) & (US$ Million)
Table 105. SGS SA Recent Development
Table 106. Redpath Company Details
Table 107. Redpath Business Overview
Table 108. Redpath Contract Mining Services Product
Table 109. Redpath Revenue in Contract Mining Services Business (2020-2025) & (US$ Million)
Table 110. Redpath Recent Development
Table 111. Mining Plus Company Details
Table 112. Mining Plus Business Overview
Table 113. Mining Plus Contract Mining Services Product
Table 114. Mining Plus Revenue in Contract Mining Services Business (2020-2025) & (US$ Million)
Table 115. Mining Plus Recent Development
Table 116. Jac Rijk Al-Rushaid Company Details
Table 117. Jac Rijk Al-Rushaid Business Overview
Table 118. Jac Rijk Al-Rushaid Contract Mining Services Product
Table 119. Jac Rijk Al-Rushaid Revenue in Contract Mining Services Business (2020-2025) & (US$ Million)
Table 120. Jac Rijk Al-Rushaid Recent Development
Table 121. Saudi Comedat Company Details
Table 122. Saudi Comedat Business Overview
Table 123. Saudi Comedat Contract Mining Services Product
Table 124. Saudi Comedat Revenue in Contract Mining Services Business (2020-2025) & (US$ Million)
Table 125. Saudi Comedat Recent Development
Table 126. Asamco Almarbaie Company Details
Table 127. Asamco Almarbaie Business Overview
Table 128. Asamco Almarbaie Contract Mining Services Product
Table 129. Asamco Almarbaie Revenue in Contract Mining Services Business (2020-2025) & (US$ Million)
Table 130. Asamco Almarbaie Recent Development
Table 131. Byrnecut Company Details
Table 132. Byrnecut Business Overview
Table 133. Byrnecut Contract Mining Services Product
Table 134. Byrnecut Revenue in Contract Mining Services Business (2020-2025) & (US$ Million)
Table 135. Byrnecut Recent Development
Table 136. SNC Lavalin Company Details
Table 137. SNC Lavalin Business Overview
Table 138. SNC Lavalin Contract Mining Services Product
Table 139. SNC Lavalin Revenue in Contract Mining Services Business (2020-2025) & (US$ Million)
Table 140. SNC Lavalin Recent Development
Table 141. Sinopec Engineering Group Company Details
Table 142. Sinopec Engineering Group Business Overview
Table 143. Sinopec Engineering Group Contract Mining Services Product
Table 144. Sinopec Engineering Group Revenue in Contract Mining Services Business (2020-2025) & (US$ Million)
Table 145. Sinopec Engineering Group Recent Development
Table 146. Hanwha E&C Company Details
Table 147. Hanwha E&C Business Overview
Table 148. Hanwha E&C Contract Mining Services Product
Table 149. Hanwha E&C Revenue in Contract Mining Services Business (2020-2025) & (US$ Million)
Table 150. Hanwha E&C Recent Development
Table 151. China Huanqiu (HQC) Company Details
Table 152. China Huanqiu (HQC) Business Overview
Table 153. China Huanqiu (HQC) Contract Mining Services Product
Table 154. China Huanqiu (HQC) Revenue in Contract Mining Services Business (2020-2025) & (US$ Million)
Table 155. China Huanqiu (HQC) Recent Development
Table 156. Fluor Company Details
Table 157. Fluor Business Overview
Table 158. Fluor Contract Mining Services Product
Table 159. Fluor Revenue in Contract Mining Services Business (2020-2025) & (US$ Million)
Table 160. Fluor Recent Development
Table 161. SENET Company Details
Table 162. SENET Business Overview
Table 163. SENET Contract Mining Services Product
Table 164. SENET Revenue in Contract Mining Services Business (2020-2025) & (US$ Million)
Table 165. SENET Recent Development
Table 166. China National Geological & Mining Corporation (CGM) Company Details
Table 167. China National Geological & Mining Corporation (CGM) Business Overview
Table 168. China National Geological & Mining Corporation (CGM) Contract Mining Services Product
Table 169. China National Geological & Mining Corporation (CGM) Revenue in Contract Mining Services Business (2020-2025) & (US$ Million)
Table 170. China National Geological & Mining Corporation (CGM) Recent Development
Table 171. Daelim Company Details
Table 172. Daelim Business Overview
Table 173. Daelim Contract Mining Services Product
Table 174. Daelim Revenue in Contract Mining Services Business (2020-2025) & (US$ Million)
Table 175. Daelim Recent Development
Table 176. Sinosteel Equipment & Engineering Company Details
Table 177. Sinosteel Equipment & Engineering Business Overview
Table 178. Sinosteel Equipment & Engineering Contract Mining Services Product
Table 179. Sinosteel Equipment & Engineering Revenue in Contract Mining Services Business (2020-2025) & (US$ Million)
Table 180. Sinosteel Equipment & Engineering Recent Development
Table 181. Intecsa Industrial Company Details
Table 182. Intecsa Industrial Business Overview
Table 183. Intecsa Industrial Contract Mining Services Product
Table 184. Intecsa Industrial Revenue in Contract Mining Services Business (2020-2025) & (US$ Million)
Table 185. Intecsa Industrial Recent Development
Table 186. Fives Solios Company Details
Table 187. Fives Solios Business Overview
Table 188. Fives Solios Contract Mining Services Product
Table 189. Fives Solios Revenue in Contract Mining Services Business (2020-2025) & (US$ Million)
Table 190. Fives Solios Recent Development
Table 191. Research Programs/Design for This Report
Table 192. Key Data Information from Secondary Sources
Table 193. Key Data Information from Primary Sources
Table 194. Authors List of This Report
List of Figures
Figure 1. Contract Mining Services Picture
Figure 2. Global Contract Mining Services Market Size Comparison By Mining Method (2020-2031) & (US$ Million)
Figure 3. Global Contract Mining Services Market Share By Mining Method: 2024 VS 2031
Figure 4. Surface Mining Features
Figure 5. Underground Mining Features
Figure 6. Global Contract Mining Services Market Size by Application (2020-2031) & (US$ Million)
Figure 7. Global Contract Mining Services Market Share by Application: 2024 VS 2031
Figure 8. Iron Ore Mining Case Studies
Figure 9. Coal Mining Case Studies
Figure 10. Gold Mining Case Studies
Figure 11. Phosphate Mining Case Studies
Figure 12. Aluminium Mining Case Studies
Figure 13. Copper-zinc Mine Case Studies
Figure 14. Others Case Studies
Figure 15. Contract Mining Services Report Years Considered
Figure 16. Global Contract Mining Services Market Size (US$ Million), Year-over-Year: 2020-2031
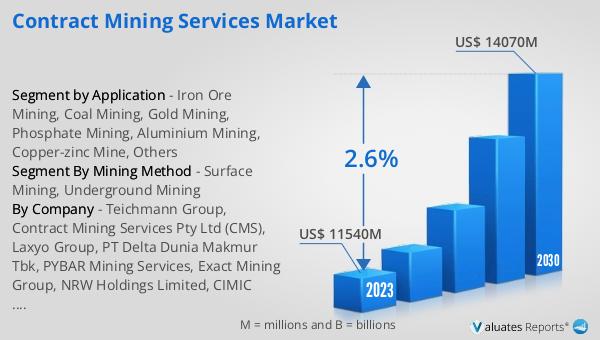
Figure 17. Global Contract Mining Services Market Size, (US$ Million), 2020 VS 2024 VS 2031
Figure 18. Global Contract Mining Services Market Share by Region: 2024 VS 2031
Figure 19. Global Contract Mining Services Market Share by Players in 2024
Figure 20. Global Top Contract Mining Services Players by Company Type (Tier 1, Tier 2, and Tier 3) & (based on the Revenue in Contract Mining Services as of 2024)
Figure 21. The Top 10 and 5 Players Market Share by Contract Mining Services Revenue in 2024
Figure 22. North America Contract Mining Services Market Size YoY Growth (2020-2031) & (US$ Million)
Figure 23. North America Contract Mining Services Market Share by Country (2020-2031)
Figure 24. United States Contract Mining Services Market Size YoY Growth (2020-2031) & (US$ Million)
Figure 25. Canada Contract Mining Services Market Size YoY Growth (2020-2031) & (US$ Million)
Figure 26. Europe Contract Mining Services Market Size YoY Growth (2020-2031) & (US$ Million)
Figure 27. Europe Contract Mining Services Market Share by Country (2020-2031)
Figure 28. Germany Contract Mining Services Market Size YoY Growth (2020-2031) & (US$ Million)
Figure 29. France Contract Mining Services Market Size YoY Growth (2020-2031) & (US$ Million)
Figure 30. U.K. Contract Mining Services Market Size YoY Growth (2020-2031) & (US$ Million)
Figure 31. Italy Contract Mining Services Market Size YoY Growth (2020-2031) & (US$ Million)
Figure 32. Russia Contract Mining Services Market Size YoY Growth (2020-2031) & (US$ Million)
Figure 33. Nordic Countries Contract Mining Services Market Size YoY Growth (2020-2031) & (US$ Million)
Figure 34. Asia-Pacific Contract Mining Services Market Size YoY Growth (2020-2031) & (US$ Million)
Figure 35. Asia-Pacific Contract Mining Services Market Share by Region (2020-2031)
Figure 36. China Contract Mining Services Market Size YoY Growth (2020-2031) & (US$ Million)
Figure 37. Japan Contract Mining Services Market Size YoY Growth (2020-2031) & (US$ Million)
Figure 38. South Korea Contract Mining Services Market Size YoY Growth (2020-2031) & (US$ Million)
Figure 39. Southeast Asia Contract Mining Services Market Size YoY Growth (2020-2031) & (US$ Million)
Figure 40. India Contract Mining Services Market Size YoY Growth (2020-2031) & (US$ Million)
Figure 41. Australia Contract Mining Services Market Size YoY Growth (2020-2031) & (US$ Million)
Figure 42. Latin America Contract Mining Services Market Size YoY Growth (2020-2031) & (US$ Million)
Figure 43. Latin America Contract Mining Services Market Share by Country (2020-2031)
Figure 44. Mexico Contract Mining Services Market Size YoY Growth (2020-2031) & (US$ Million)
Figure 45. Brazil Contract Mining Services Market Size YoY Growth (2020-2031) & (US$ Million)
Figure 46. Middle East & Africa Contract Mining Services Market Size YoY Growth (2020-2031) & (US$ Million)
Figure 47. Middle East & Africa Contract Mining Services Market Share by Country (2020-2031)
Figure 48. Turkey Contract Mining Services Market Size YoY Growth (2020-2031) & (US$ Million)
Figure 49. Saudi Arabia Contract Mining Services Market Size YoY Growth (2020-2031) & (US$ Million)
Figure 50. UAE Contract Mining Services Market Size YoY Growth (2020-2031) & (US$ Million)
Figure 51. Teichmann Group Revenue Growth Rate in Contract Mining Services Business (2020-2025)
Figure 52. Contract Mining Services Pty Ltd (CMS) Revenue Growth Rate in Contract Mining Services Business (2020-2025)
Figure 53. Laxyo Group Revenue Growth Rate in Contract Mining Services Business (2020-2025)
Figure 54. PT Delta Dunia Makmur Tbk Revenue Growth Rate in Contract Mining Services Business (2020-2025)
Figure 55. PYBAR Mining Services Revenue Growth Rate in Contract Mining Services Business (2020-2025)
Figure 56. Exact Mining Group Revenue Growth Rate in Contract Mining Services Business (2020-2025)
Figure 57. NRW Holdings Limited Revenue Growth Rate in Contract Mining Services Business (2020-2025)
Figure 58. CIMIC Group Revenue Growth Rate in Contract Mining Services Business (2020-2025)
Figure 59. Macmahon Revenue Growth Rate in Contract Mining Services Business (2020-2025)
Figure 60. Perenti Group Revenue Growth Rate in Contract Mining Services Business (2020-2025)
Figure 61. Ledcor Group Revenue Growth Rate in Contract Mining Services Business (2020-2025)
Figure 62. SGS SA Revenue Growth Rate in Contract Mining Services Business (2020-2025)
Figure 63. Redpath Revenue Growth Rate in Contract Mining Services Business (2020-2025)
Figure 64. Mining Plus Revenue Growth Rate in Contract Mining Services Business (2020-2025)
Figure 65. Jac Rijk Al-Rushaid Revenue Growth Rate in Contract Mining Services Business (2020-2025)
Figure 66. Saudi Comedat Revenue Growth Rate in Contract Mining Services Business (2020-2025)
Figure 67. Asamco Almarbaie Revenue Growth Rate in Contract Mining Services Business (2020-2025)
Figure 68. Byrnecut Revenue Growth Rate in Contract Mining Services Business (2020-2025)
Figure 69. SNC Lavalin Revenue Growth Rate in Contract Mining Services Business (2020-2025)
Figure 70. Sinopec Engineering Group Revenue Growth Rate in Contract Mining Services Business (2020-2025)
Figure 71. Hanwha E&C Revenue Growth Rate in Contract Mining Services Business (2020-2025)
Figure 72. China Huanqiu (HQC) Revenue Growth Rate in Contract Mining Services Business (2020-2025)
Figure 73. Fluor Revenue Growth Rate in Contract Mining Services Business (2020-2025)
Figure 74. SENET Revenue Growth Rate in Contract Mining Services Business (2020-2025)
Figure 75. China National Geological & Mining Corporation (CGM) Revenue Growth Rate in Contract Mining Services Business (2020-2025)
Figure 76. Daelim Revenue Growth Rate in Contract Mining Services Business (2020-2025)
Figure 77. Sinosteel Equipment & Engineering Revenue Growth Rate in Contract Mining Services Business (2020-2025)
Figure 78. Intecsa Industrial Revenue Growth Rate in Contract Mining Services Business (2020-2025)
Figure 79. Fives Solios Revenue Growth Rate in Contract Mining Services Business (2020-2025)
Figure 80. Bottom-up and Top-down Approaches for This Report
Figure 81. Data Triangulation
Figure 82. Key Executives Interviewed