List of Tables
Table 1. Global Autoclave Sterilizations Market Value Comparison by Type (2024 VS 2031) & (US$ Million)
Table 2. Global Autoclave Sterilizations Market Value by Application (2024 VS 2031) & (US$ Million)
Table 3. Global Autoclave Sterilizations Market Competitive Situation by Manufacturers in 2024
Table 4. Global Autoclave Sterilizations Sales (K Units) of Key Manufacturers (2020-2025)
Table 5. Global Autoclave Sterilizations Sales Market Share by Manufacturers (2020-2025)
Table 6. Global Autoclave Sterilizations Revenue (US$ Million) by Manufacturers (2020-2025)
Table 7. Global Autoclave Sterilizations Revenue Share by Manufacturers (2020-2025)
Table 8. Global Market Autoclave Sterilizations Average Price (US$/Unit) of Key Manufacturers (2020-2025)
Table 9. Global Key Players of Autoclave Sterilizations, Industry Ranking, 2022 VS 2023 VS 2024
Table 10. Global Key Manufacturers of Autoclave Sterilizations, Manufacturing Sites & Headquarters
Table 11. Global Key Manufacturers of Autoclave Sterilizations, Product Type & Application
Table 12. Global Key Manufacturers of Autoclave Sterilizations, Date of Enter into This Industry
Table 13. Global Manufacturers Market Concentration Ratio (CR5 and HHI)
Table 14. Global Autoclave Sterilizations by Company Type (Tier 1, Tier 2, and Tier 3) & (based on the Revenue in Autoclave Sterilizations as of 2024)
Table 15. Manufacturers Mergers & Acquisitions, Expansion Plans
Table 16. Global Autoclave Sterilizations Market Size by Region (US$ Million): 2020 VS 2024 VS 2031
Table 17. Global Autoclave Sterilizations Sales by Region (2020-2025) & (K Units)
Table 18. Global Autoclave Sterilizations Sales Market Share by Region (2020-2025)
Table 19. Global Autoclave Sterilizations Sales by Region (2026-2031) & (K Units)
Table 20. Global Autoclave Sterilizations Sales Market Share by Region (2026-2031)
Table 21. Global Autoclave Sterilizations Revenue by Region (2020-2025) & (US$ Million)
Table 22. Global Autoclave Sterilizations Revenue Market Share by Region (2020-2025)
Table 23. Global Autoclave Sterilizations Revenue by Region (2026-2031) & (US$ Million)
Table 24. Global Autoclave Sterilizations Revenue Market Share by Region (2026-2031)
Table 25. North America Autoclave Sterilizations Revenue by Country: 2020 VS 2024 VS 2031 (US$ Million)
Table 26. North America Autoclave Sterilizations Sales by Country (2020-2025) & (K Units)
Table 27. North America Autoclave Sterilizations Sales by Country (2026-2031) & (K Units)
Table 28. North America Autoclave Sterilizations Revenue by Country (2020-2025) & (US$ Million)
Table 29. North America Autoclave Sterilizations Revenue by Country (2026-2031) & (US$ Million)
Table 30. Europe Autoclave Sterilizations Revenue by Country: 2020 VS 2024 VS 2031 (US$ Million)
Table 31. Europe Autoclave Sterilizations Sales by Country (2020-2025) & (K Units)
Table 32. Europe Autoclave Sterilizations Sales by Country (2026-2031) & (K Units)
Table 33. Europe Autoclave Sterilizations Revenue by Country (2020-2025) & (US$ Million)
Table 34. Europe Autoclave Sterilizations Revenue by Country (2026-2031) & (US$ Million)
Table 35. Asia Pacific Autoclave Sterilizations Revenue by Region: 2020 VS 2024 VS 2031 (US$ Million)
Table 36. Asia Pacific Autoclave Sterilizations Sales by Region (2020-2025) & (K Units)
Table 37. Asia Pacific Autoclave Sterilizations Sales by Region (2026-2031) & (K Units)
Table 38. Asia Pacific Autoclave Sterilizations Revenue by Region (2020-2025) & (US$ Million)
Table 39. Asia Pacific Autoclave Sterilizations Revenue by Region (2026-2031) & (US$ Million)
Table 40. Latin America Autoclave Sterilizations Revenue by Country: 2020 VS 2024 VS 2031 (US$ Million)
Table 41. Latin America Autoclave Sterilizations Sales by Country (2020-2025) & (K Units)
Table 42. Latin America Autoclave Sterilizations Sales by Country (2026-2031) & (K Units)
Table 43. Latin America Autoclave Sterilizations Revenue by Country (2020-2025) & (US$ Million)
Table 44. Latin America Autoclave Sterilizations Revenue by Country (2026-2031) & (US$ Million)
Table 45. Middle East and Africa Autoclave Sterilizations Revenue by Country: 2020 VS 2024 VS 2031 (US$ Million)
Table 46. Middle East and Africa Autoclave Sterilizations Sales by Country (2020-2025) & (K Units)
Table 47. Middle East and Africa Autoclave Sterilizations Sales by Country (2026-2031) & (K Units)
Table 48. Middle East and Africa Autoclave Sterilizations Revenue by Country (2020-2025) & (US$ Million)
Table 49. Middle East and Africa Autoclave Sterilizations Revenue by Country (2026-2031) & (US$ Million)
Table 50. Global Autoclave Sterilizations Sales (K Units) by Type (2020-2025)
Table 51. Global Autoclave Sterilizations Sales (K Units) by Type (2026-2031)
Table 52. Global Autoclave Sterilizations Sales Market Share by Type (2020-2025)
Table 53. Global Autoclave Sterilizations Sales Market Share by Type (2026-2031)
Table 54. Global Autoclave Sterilizations Revenue (US$ Million) by Type (2020-2025)
Table 55. Global Autoclave Sterilizations Revenue (US$ Million) by Type (2026-2031)
Table 56. Global Autoclave Sterilizations Revenue Market Share by Type (2020-2025)
Table 57. Global Autoclave Sterilizations Revenue Market Share by Type (2026-2031)
Table 58. Global Autoclave Sterilizations Price (US$/Unit) by Type (2020-2025)
Table 59. Global Autoclave Sterilizations Price (US$/Unit) by Type (2026-2031)
Table 60. Global Autoclave Sterilizations Sales (K Units) by Application (2020-2025)
Table 61. Global Autoclave Sterilizations Sales (K Units) by Application (2026-2031)
Table 62. Global Autoclave Sterilizations Sales Market Share by Application (2020-2025)
Table 63. Global Autoclave Sterilizations Sales Market Share by Application (2026-2031)
Table 64. Global Autoclave Sterilizations Revenue (US$ Million) by Application (2020-2025)
Table 65. Global Autoclave Sterilizations Revenue (US$ Million) by Application (2026-2031)
Table 66. Global Autoclave Sterilizations Revenue Market Share by Application (2020-2025)
Table 67. Global Autoclave Sterilizations Revenue Market Share by Application (2026-2031)
Table 68. Global Autoclave Sterilizations Price (US$/Unit) by Application (2020-2025)
Table 69. Global Autoclave Sterilizations Price (US$/Unit) by Application (2026-2031)
Table 70. Zirbus Technology Company Information
Table 71. Zirbus Technology Description and Business Overview
Table 72. Zirbus Technology Autoclave Sterilizations Sales (K Units), Revenue (US$ Million), Price (US$/Unit) and Gross Margin (2020-2025)
Table 73. Zirbus Technology Autoclave Sterilizations Product
Table 74. Zirbus Technology Recent Developments/Updates
Table 75. Amerex Instruments Company Information
Table 76. Amerex Instruments Description and Business Overview
Table 77. Amerex Instruments Autoclave Sterilizations Sales (K Units), Revenue (US$ Million), Price (US$/Unit) and Gross Margin (2020-2025)
Table 78. Amerex Instruments Autoclave Sterilizations Product
Table 79. Amerex Instruments Recent Developments/Updates
Table 80. Tuttnauer Company Information
Table 81. Tuttnauer Description and Business Overview
Table 82. Tuttnauer Autoclave Sterilizations Sales (K Units), Revenue (US$ Million), Price (US$/Unit) and Gross Margin (2020-2025)
Table 83. Tuttnauer Autoclave Sterilizations Product
Table 84. Tuttnauer Recent Developments/Updates
Table 85. Astell Scientific Company Information
Table 86. Astell Scientific Description and Business Overview
Table 87. Astell Scientific Autoclave Sterilizations Sales (K Units), Revenue (US$ Million), Price (US$/Unit) and Gross Margin (2020-2025)
Table 88. Astell Scientific Autoclave Sterilizations Product
Table 89. Astell Scientific Recent Developments/Updates
Table 90. Beta Star Life Science Equipment Company Information
Table 91. Beta Star Life Science Equipment Description and Business Overview
Table 92. Beta Star Life Science Equipment Autoclave Sterilizations Sales (K Units), Revenue (US$ Million), Price (US$/Unit) and Gross Margin (2020-2025)
Table 93. Beta Star Life Science Equipment Autoclave Sterilizations Product
Table 94. Beta Star Life Science Equipment Recent Developments/Updates
Table 95. STERITECH Company Information
Table 96. STERITECH Description and Business Overview
Table 97. STERITECH Autoclave Sterilizations Sales (K Units), Revenue (US$ Million), Price (US$/Unit) and Gross Margin (2020-2025)
Table 98. STERITECH Autoclave Sterilizations Product
Table 99. STERITECH Recent Developments/Updates
Table 100. Belimed Company Information
Table 101. Belimed Description and Business Overview
Table 102. Belimed Autoclave Sterilizations Sales (K Units), Revenue (US$ Million), Price (US$/Unit) and Gross Margin (2020-2025)
Table 103. Belimed Autoclave Sterilizations Product
Table 104. Belimed Recent Developments/Updates
Table 105. LTE Scientific Company Information
Table 106. LTE Scientific Description and Business Overview
Table 107. LTE Scientific Autoclave Sterilizations Sales (K Units), Revenue (US$ Million), Price (US$/Unit) and Gross Margin (2020-2025)
Table 108. LTE Scientific Autoclave Sterilizations Product
Table 109. LTE Scientific Recent Developments/Updates
Table 110. Rodwell Autoclave Company Company Information
Table 111. Rodwell Autoclave Company Description and Business Overview
Table 112. Rodwell Autoclave Company Autoclave Sterilizations Sales (K Units), Revenue (US$ Million), Price (US$/Unit) and Gross Margin (2020-2025)
Table 113. Rodwell Autoclave Company Autoclave Sterilizations Product
Table 114. Rodwell Autoclave Company Recent Developments/Updates
Table 115. DIDAC INTERNATIONAL Company Information
Table 116. DIDAC INTERNATIONAL Description and Business Overview
Table 117. DIDAC INTERNATIONAL Autoclave Sterilizations Sales (K Units), Revenue (US$ Million), Price (US$/Unit) and Gross Margin (2020-2025)
Table 118. DIDAC INTERNATIONAL Autoclave Sterilizations Product
Table 119. DIDAC INTERNATIONAL Recent Developments/Updates
Table 120. Systec Company Information
Table 121. Systec Description and Business Overview
Table 122. Systec Autoclave Sterilizations Sales (K Units), Revenue (US$ Million), Price (US$/Unit) and Gross Margin (2020-2025)
Table 123. Systec Autoclave Sterilizations Product
Table 124. Systec Recent Developments/Updates
Table 125. Fedegari Company Information
Table 126. Fedegari Description and Business Overview
Table 127. Fedegari Autoclave Sterilizations Sales (K Units), Revenue (US$ Million), Price (US$/Unit) and Gross Margin (2020-2025)
Table 128. Fedegari Autoclave Sterilizations Product
Table 129. Fedegari Recent Developments/Updates
Table 130. DE LAMA Company Information
Table 131. DE LAMA Description and Business Overview
Table 132. DE LAMA Autoclave Sterilizations Sales (K Units), Revenue (US$ Million), Price (US$/Unit) and Gross Margin (2020-2025)
Table 133. DE LAMA Autoclave Sterilizations Product
Table 134. DE LAMA Recent Developments/Updates
Table 135. Boekel Scientific Company Information
Table 136. Boekel Scientific Description and Business Overview
Table 137. Boekel Scientific Autoclave Sterilizations Sales (K Units), Revenue (US$ Million), Price (US$/Unit) and Gross Margin (2020-2025)
Table 138. Boekel Scientific Autoclave Sterilizations Product
Table 139. Boekel Scientific Recent Developments/Updates
Table 140. Consolidated Sterilizer Systems Company Information
Table 141. Consolidated Sterilizer Systems Description and Business Overview
Table 142. Consolidated Sterilizer Systems Autoclave Sterilizations Sales (K Units), Revenue (US$ Million), Price (US$/Unit) and Gross Margin (2020-2025)
Table 143. Consolidated Sterilizer Systems Autoclave Sterilizations Product
Table 144. Consolidated Sterilizer Systems Recent Developments/Updates
Table 145. ESTS Company Information
Table 146. ESTS Description and Business Overview
Table 147. ESTS Autoclave Sterilizations Sales (K Units), Revenue (US$ Million), Price (US$/Unit) and Gross Margin (2020-2025)
Table 148. ESTS Autoclave Sterilizations Product
Table 149. ESTS Recent Developments/Updates
Table 150. Heidolph Instruments Company Information
Table 151. Heidolph Instruments Description and Business Overview
Table 152. Heidolph Instruments Autoclave Sterilizations Sales (K Units), Revenue (US$ Million), Price (US$/Unit) and Gross Margin (2020-2025)
Table 153. Heidolph Instruments Autoclave Sterilizations Product
Table 154. Heidolph Instruments Recent Developments/Updates
Table 155. HIRAYAMA Manufacturing Corporation Company Information
Table 156. HIRAYAMA Manufacturing Corporation Description and Business Overview
Table 157. HIRAYAMA Manufacturing Corporation Autoclave Sterilizations Sales (K Units), Revenue (US$ Million), Price (US$/Unit) and Gross Margin (2020-2025)
Table 158. HIRAYAMA Manufacturing Corporation Autoclave Sterilizations Product
Table 159. HIRAYAMA Manufacturing Corporation Recent Developments/Updates
Table 160. Microbiology International Company Information
Table 161. Microbiology International Description and Business Overview
Table 162. Microbiology International Autoclave Sterilizations Sales (K Units), Revenue (US$ Million), Price (US$/Unit) and Gross Margin (2020-2025)
Table 163. Microbiology International Autoclave Sterilizations Product
Table 164. Microbiology International Recent Developments/Updates
Table 165. Raypa Company Information
Table 166. Raypa Description and Business Overview
Table 167. Raypa Autoclave Sterilizations Sales (K Units), Revenue (US$ Million), Price (US$/Unit) and Gross Margin (2020-2025)
Table 168. Raypa Autoclave Sterilizations Product
Table 169. Raypa Recent Developments/Updates
Table 170. TOMY Company Information
Table 171. TOMY Description and Business Overview
Table 172. TOMY Autoclave Sterilizations Sales (K Units), Revenue (US$ Million), Price (US$/Unit) and Gross Margin (2020-2025)
Table 173. TOMY Autoclave Sterilizations Product
Table 174. TOMY Recent Developments/Updates
Table 175. RSD ENGINEERING Company Information
Table 176. RSD ENGINEERING Description and Business Overview
Table 177. RSD ENGINEERING Autoclave Sterilizations Sales (K Units), Revenue (US$ Million), Price (US$/Unit) and Gross Margin (2020-2025)
Table 178. RSD ENGINEERING Autoclave Sterilizations Product
Table 179. RSD ENGINEERING Recent Developments/Updates
Table 180. Telstar(azbil) Company Information
Table 181. Telstar(azbil) Description and Business Overview
Table 182. Telstar(azbil) Autoclave Sterilizations Sales (K Units), Revenue (US$ Million), Price (US$/Unit) and Gross Margin (2020-2025)
Table 183. Telstar(azbil) Autoclave Sterilizations Product
Table 184. Telstar(azbil) Recent Developments/Updates
Table 185. Steris Company Information
Table 186. Steris Description and Business Overview
Table 187. Steris Autoclave Sterilizations Sales (K Units), Revenue (US$ Million), Price (US$/Unit) and Gross Margin (2020-2025)
Table 188. Steris Autoclave Sterilizations Product
Table 189. Steris Recent Developments/Updates
Table 190. BOMBAY ENGINEERING WORKS Company Information
Table 191. BOMBAY ENGINEERING WORKS Description and Business Overview
Table 192. BOMBAY ENGINEERING WORKS Autoclave Sterilizations Sales (K Units), Revenue (US$ Million), Price (US$/Unit) and Gross Margin (2020-2025)
Table 193. BOMBAY ENGINEERING WORKS Autoclave Sterilizations Product
Table 194. BOMBAY ENGINEERING WORKS Recent Developments/Updates
Table 195. MELAG Company Information
Table 196. MELAG Description and Business Overview
Table 197. MELAG Autoclave Sterilizations Sales (K Units), Revenue (US$ Million), Price (US$/Unit) and Gross Margin (2020-2025)
Table 198. MELAG Autoclave Sterilizations Product
Table 199. MELAG Recent Developments/Updates
Table 200. Prestige Medical Company Information
Table 201. Prestige Medical Description and Business Overview
Table 202. Prestige Medical Autoclave Sterilizations Sales (K Units), Revenue (US$ Million), Price (US$/Unit) and Gross Margin (2020-2025)
Table 203. Prestige Medical Autoclave Sterilizations Product
Table 204. Prestige Medical Recent Developments/Updates
Table 205. Yamato Scientific Company Information
Table 206. Yamato Scientific Description and Business Overview
Table 207. Yamato Scientific Autoclave Sterilizations Sales (K Units), Revenue (US$ Million), Price (US$/Unit) and Gross Margin (2020-2025)
Table 208. Yamato Scientific Autoclave Sterilizations Product
Table 209. Yamato Scientific Recent Developments/Updates
Table 210. Spinco Biotech Company Information
Table 211. Spinco Biotech Description and Business Overview
Table 212. Spinco Biotech Autoclave Sterilizations Sales (K Units), Revenue (US$ Million), Price (US$/Unit) and Gross Margin (2020-2025)
Table 213. Spinco Biotech Autoclave Sterilizations Product
Table 214. Spinco Biotech Recent Developments/Updates
Table 215. Priorclave North America Company Information
Table 216. Priorclave North America Description and Business Overview
Table 217. Priorclave North America Autoclave Sterilizations Sales (K Units), Revenue (US$ Million), Price (US$/Unit) and Gross Margin (2020-2025)
Table 218. Priorclave North America Autoclave Sterilizations Product
Table 219. Priorclave North America Recent Developments/Updates
Table 220. Getinge AB Company Information
Table 221. Getinge AB Description and Business Overview
Table 222. Getinge AB Autoclave Sterilizations Sales (K Units), Revenue (US$ Million), Price (US$/Unit) and Gross Margin (2020-2025)
Table 223. Getinge AB Autoclave Sterilizations Product
Table 224. Getinge AB Recent Developments/Updates
Table 225. Nicos Company Information
Table 226. Nicos Description and Business Overview
Table 227. Nicos Autoclave Sterilizations Sales (K Units), Revenue (US$ Million), Price (US$/Unit) and Gross Margin (2020-2025)
Table 228. Nicos Autoclave Sterilizations Product
Table 229. Nicos Recent Developments/Updates
Table 230. Narang Medical Company Information
Table 231. Narang Medical Description and Business Overview
Table 232. Narang Medical Autoclave Sterilizations Sales (K Units), Revenue (US$ Million), Price (US$/Unit) and Gross Margin (2020-2025)
Table 233. Narang Medical Autoclave Sterilizations Product
Table 234. Narang Medical Recent Developments/Updates
Table 235. Bionics Scientific Technologies Company Information
Table 236. Bionics Scientific Technologies Description and Business Overview
Table 237. Bionics Scientific Technologies Autoclave Sterilizations Sales (K Units), Revenue (US$ Million), Price (US$/Unit) and Gross Margin (2020-2025)
Table 238. Bionics Scientific Technologies Autoclave Sterilizations Product
Table 239. Bionics Scientific Technologies Recent Developments/Updates
Table 240. Qingdao Haier Biomedical Company Information
Table 241. Qingdao Haier Biomedical Description and Business Overview
Table 242. Qingdao Haier Biomedical Autoclave Sterilizations Sales (K Units), Revenue (US$ Million), Price (US$/Unit) and Gross Margin (2020-2025)
Table 243. Qingdao Haier Biomedical Autoclave Sterilizations Product
Table 244. Qingdao Haier Biomedical Recent Developments/Updates
Table 245. Shinva Medical Instrument Company Information
Table 246. Shinva Medical Instrument Description and Business Overview
Table 247. Shinva Medical Instrument Autoclave Sterilizations Sales (K Units), Revenue (US$ Million), Price (US$/Unit) and Gross Margin (2020-2025)
Table 248. Shinva Medical Instrument Autoclave Sterilizations Product
Table 249. Shinva Medical Instrument Recent Developments/Updates
Table 250. Jiangsu Saikang Medical Equipment Company Information
Table 251. Jiangsu Saikang Medical Equipment Description and Business Overview
Table 252. Jiangsu Saikang Medical Equipment Autoclave Sterilizations Sales (K Units), Revenue (US$ Million), Price (US$/Unit) and Gross Margin (2020-2025)
Table 253. Jiangsu Saikang Medical Equipment Autoclave Sterilizations Product
Table 254. Jiangsu Saikang Medical Equipment Recent Developments/Updates
Table 255. Boke Biological Industry Company Information
Table 256. Boke Biological Industry Description and Business Overview
Table 257. Boke Biological Industry Autoclave Sterilizations Sales (K Units), Revenue (US$ Million), Price (US$/Unit) and Gross Margin (2020-2025)
Table 258. Boke Biological Industry Autoclave Sterilizations Product
Table 259. Boke Biological Industry Recent Developments/Updates
Table 260. ZHEJIANG FUXIA MEDICAL TECHNOLOGY Company Information
Table 261. ZHEJIANG FUXIA MEDICAL TECHNOLOGY Description and Business Overview
Table 262. ZHEJIANG FUXIA MEDICAL TECHNOLOGY Autoclave Sterilizations Sales (K Units), Revenue (US$ Million), Price (US$/Unit) and Gross Margin (2020-2025)
Table 263. ZHEJIANG FUXIA MEDICAL TECHNOLOGY Autoclave Sterilizations Product
Table 264. ZHEJIANG FUXIA MEDICAL TECHNOLOGY Recent Developments/Updates
Table 265. NINGBO ICAN MACHINES Company Information
Table 266. NINGBO ICAN MACHINES Description and Business Overview
Table 267. NINGBO ICAN MACHINES Autoclave Sterilizations Sales (K Units), Revenue (US$ Million), Price (US$/Unit) and Gross Margin (2020-2025)
Table 268. NINGBO ICAN MACHINES Autoclave Sterilizations Product
Table 269. NINGBO ICAN MACHINES Recent Developments/Updates
Table 270. Key Raw Materials Lists
Table 271. Raw Materials Key Suppliers Lists
Table 272. Autoclave Sterilizations Distributors List
Table 273. Autoclave Sterilizations Customers List
Table 274. Autoclave Sterilizations Market Trends
Table 275. Autoclave Sterilizations Market Drivers
Table 276. Autoclave Sterilizations Market Challenges
Table 277. Autoclave Sterilizations Market Restraints
Table 278. Research Programs/Design for This Report
Table 279. Key Data Information from Secondary Sources
Table 280. Key Data Information from Primary Sources
Table 281. Authors List of This Report
List of Figures
Figure 1. Product Picture of Autoclave Sterilizations
Figure 2. Global Autoclave Sterilizations Market Value Comparison by Type (2020-2031) & (US$ Million)
Figure 3. Global Autoclave Sterilizations Market Share by Type: 2024 & 2031
Figure 4. Class N Product Picture
Figure 5. Class B Product Picture
Figure 6. Class S Product Picture
Figure 7. Global Autoclave Sterilizations Market Value by Application (2020-2031) & (US$ Million)
Figure 8. Global Autoclave Sterilizations Market Share by Application: 2024 & 2031
Figure 9. Hospital
Figure 10. Research Laboratory
Figure 11. Others
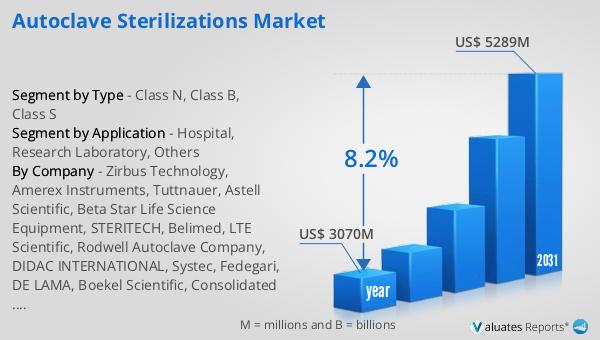
Figure 12. Global Autoclave Sterilizations Revenue, (US$ Million), 2020 VS 2024 VS 2031
Figure 13. Global Autoclave Sterilizations Market Size (2020-2031) & (US$ Million)
Figure 14. Global Autoclave Sterilizations Sales (2020-2031) & (K Units)
Figure 15. Global Autoclave Sterilizations Average Price (US$/Unit) & (2020-2031)
Figure 16. Autoclave Sterilizations Report Years Considered
Figure 17. Autoclave Sterilizations Sales Share by Manufacturers in 2024
Figure 18. Global Autoclave Sterilizations Revenue Share by Manufacturers in 2024
Figure 19. Global 5 and 10 Largest Autoclave Sterilizations Players: Market Share by Revenue in Autoclave Sterilizations in 2024
Figure 20. Autoclave Sterilizations Market Share by Company Type (Tier 1, Tier 2, and Tier 3): 2020 VS 2024
Figure 21. Global Autoclave Sterilizations Market Size by Region (US$ Million): 2020 VS 2024 VS 2031
Figure 22. North America Autoclave Sterilizations Sales Market Share by Country (2020-2031)
Figure 23. North America Autoclave Sterilizations Revenue Market Share by Country (2020-2031)
Figure 24. United States Autoclave Sterilizations Revenue Growth Rate (2020-2031) & (US$ Million)
Figure 25. Canada Autoclave Sterilizations Revenue Growth Rate (2020-2031) & (US$ Million)
Figure 26. Europe Autoclave Sterilizations Sales Market Share by Country (2020-2031)
Figure 27. Europe Autoclave Sterilizations Revenue Market Share by Country (2020-2031)
Figure 28. Germany Autoclave Sterilizations Revenue Growth Rate (2020-2031) & (US$ Million)
Figure 29. France Autoclave Sterilizations Revenue Growth Rate (2020-2031) & (US$ Million)
Figure 30. U.K. Autoclave Sterilizations Revenue Growth Rate (2020-2031) & (US$ Million)
Figure 31. Italy Autoclave Sterilizations Revenue Growth Rate (2020-2031) & (US$ Million)
Figure 32. Russia Autoclave Sterilizations Revenue Growth Rate (2020-2031) & (US$ Million)
Figure 33. Asia Pacific Autoclave Sterilizations Sales Market Share by Region (2020-2031)
Figure 34. Asia Pacific Autoclave Sterilizations Revenue Market Share by Region (2020-2031)
Figure 35. China Autoclave Sterilizations Revenue Growth Rate (2020-2031) & (US$ Million)
Figure 36. Japan Autoclave Sterilizations Revenue Growth Rate (2020-2031) & (US$ Million)
Figure 37. South Korea Autoclave Sterilizations Revenue Growth Rate (2020-2031) & (US$ Million)
Figure 38. India Autoclave Sterilizations Revenue Growth Rate (2020-2031) & (US$ Million)
Figure 39. Australia Autoclave Sterilizations Revenue Growth Rate (2020-2031) & (US$ Million)
Figure 40. China Taiwan Autoclave Sterilizations Revenue Growth Rate (2020-2031) & (US$ Million)
Figure 41. Indonesia Autoclave Sterilizations Revenue Growth Rate (2020-2031) & (US$ Million)
Figure 42. Thailand Autoclave Sterilizations Revenue Growth Rate (2020-2031) & (US$ Million)
Figure 43. Malaysia Autoclave Sterilizations Revenue Growth Rate (2020-2031) & (US$ Million)
Figure 44. Latin America Autoclave Sterilizations Sales Market Share by Country (2020-2031)
Figure 45. Latin America Autoclave Sterilizations Revenue Market Share by Country (2020-2031)
Figure 46. Mexico Autoclave Sterilizations Revenue Growth Rate (2020-2031) & (US$ Million)
Figure 47. Brazil Autoclave Sterilizations Revenue Growth Rate (2020-2031) & (US$ Million)
Figure 48. Argentina Autoclave Sterilizations Revenue Growth Rate (2020-2031) & (US$ Million)
Figure 49. Middle East and Africa Autoclave Sterilizations Sales Market Share by Country (2020-2031)
Figure 50. Middle East and Africa Autoclave Sterilizations Revenue Market Share by Country (2020-2031)
Figure 51. Turkey Autoclave Sterilizations Revenue Growth Rate (2020-2031) & (US$ Million)
Figure 52. Saudi Arabia Autoclave Sterilizations Revenue Growth Rate (2020-2031) & (US$ Million)
Figure 53. UAE Autoclave Sterilizations Revenue Growth Rate (2020-2031) & (US$ Million)
Figure 54. Global Sales Market Share of Autoclave Sterilizations by Type (2020-2031)
Figure 55. Global Revenue Market Share of Autoclave Sterilizations by Type (2020-2031)
Figure 56. Global Autoclave Sterilizations Price (US$/Unit) by Type (2020-2031)
Figure 57. Global Sales Market Share of Autoclave Sterilizations by Application (2020-2031)
Figure 58. Global Revenue Market Share of Autoclave Sterilizations by Application (2020-2031)
Figure 59. Global Autoclave Sterilizations Price (US$/Unit) by Application (2020-2031)
Figure 60. Autoclave Sterilizations Value Chain
Figure 61. Channels of Distribution (Direct Vs Distribution)
Figure 62. Bottom-up and Top-down Approaches for This Report
Figure 63. Data Triangulation
Figure 64. Key Executives Interviewed