1
U.S. (TOLL FREE)
+1 (315) 215-3225
Automative

1
U.S. (TOLL FREE)
+1 (315) 215-3225
Global and India NDIR Sensors Market Report & Forecast 2023-2029
Published Date: December 2023
|
Report Code: QYRE-Auto-4N16202
Home | Market Reports | Computers & Electronics| Electronics & Electrical
Global and India NDIR Sensors Market Report Forecast 2023 2029
BUY CHAPTERS

Global and India NDIR Sensors Market Report & Forecast 2023-2029

Code: QYRE-Auto-4N16202
Report
December 2023
Pages:128
QYResearch
Buy Now with 15% Discount
DESCRIPTION
TABLE OF CONTENT
TABLES & FIGURES

and India NDIR Sensors Market Size

The global NDIR Sensors revenue was US$ 791.8 million in 2022 and is forecast to a readjusted size of US$ 1332.2 million by 2029 with a CAGR of 7.6% during the forecast period (2023-2029).

and India NDIR Sensors Market

and India NDIR Sensors Market

NDIR gas sensors use the infrared absorption properties of gas molecules (e.g., CO2) to calculate their concentration. Therefore, the NDIR gas sensor is equipped with an infrared light source that emits infrared rays and an infrared sensor that detects infrared rays. The infrared light is directed at the gas in the measuring tube and part of the light is absorbed by the gas molecules to be measured. Subsequently, the rest of the infrared light hits the filter and reaches the infrared detector. Ideally, only the gas to be measured absorbs light of the corresponding wavelength. However, since the gas mixture contains a variety of gases, the absorption regions may overlap, thus enhancing cross sensitivity. The interference part must either be tested for compensation (to avoid false measurements) or avoided by clever selection of spectral ranges. With the NDIR sensor, more than 100 different gases can be detected from ppm to percentage. In many applications, this is the preferred method because the measurement method is non-contact and non-consuming.
In India, the NDIR Sensors revenue is expected to grow from US$ million in 2022 to US$ million by 2029, at a CAGR of % during the forecast period (2023-2029).
Global key players of NDIR Sensors include Amphenol Advanced Sensors, Senseair (Asahi Kasei Microdevices), Murata, Sensirion, MKS Instruments and ELT SENSOR. Top five players occupy for a share over 18%. North America is the largest market, with a share about 36%, followed by Europe and Asia-Pacific. In terms of product type, NDIR CO2 Sensors is the largest segment, with a share over 57%. In terms of application, Residential and Commercial Security is the largest market, with a share about 50%.
This report focuses on global and India NDIR Sensors market, also covers the segmentation data of other regions in regional level and county level.
India is now the world’s most populous country. According to IMF (its July update to its World Economic Outlook), India’s GDP growth is projected at 6.1% in 2023, powered by domestic investment. First and foremost, the key factor in India's rapid economic growth is the huge supply and demand from a large population base. Demand and supply sides working in both directions to support India's economic stability.
India is a market full of opportunities, and the demand for NDIR Sensors will continue to grow rapidly in the future.
Global NDIR Sensors Scope and Market Size
NDIR Sensors market is segmented in regional and country, by players, by type and by application. Companies, stakeholders, and other participants in the global NDIR Sensors market will be able to gain the upper hand as they use the report as a powerful resource. The segmental analysis focuses on revenue and forecast by type and by application for the period 2018-2029.
For India market, this report focuses on the NDIR Sensors market size by players, by Type and by Application, for the period 2018-2029. The key players include the global and local players, which play important roles in India.

Scope of and India NDIR Sensors Market Report

Report Metric Details
Report Name and India NDIR Sensors Market
Forecasted market size in 2029 US$ 1332.2 million
CAGR 7.6%
Forecasted years 2023 - 2029
Segment by Type
  • NDIR CO2 Sensors
  • NDIR Methane (CH4) Gas Sensors
  • NDIR CO Sensors
  • NDIR Propane Gas Sensors
  • NDIR Refrigerant Gases Sensors
  • NDIR Ethylene Gases Sensors
  • NDIR SF6 Infrared Sensors
  • Others
Segment by Application
  • Industrial Safety
  • Environmental Protection Industry
  • Medical Industry
  • Residential and Commercial Security
  • Power Industry
  • Automobile Industry
  • Research Institutions
  • Others
By Region
  • North America (United States, Canada)
  • Europe (Germany, France, UK, Italy, Russia) Rest of Europe
  • Nordic Countries
  • Asia-Pacific (China, Japan, South Korea)
  • Southeast Asia (India, Australia)
  • Rest of Asia
  • Latin America (Mexico, Brazil)
  • Rest of Latin America
  • Middle East & Africa (Turkey, Saudi Arabia, UAE, Rest of MEA)
By Company Amphenol Advanced Sensors, Senseair (Asahi Kasei Microdevices), Murata, Sensirion, MKS Instruments, Vaisala, Teledyne API, Honeywell, ELT SENSOR, E+E, Dwyer Instruments, Trane, Micro-Hybrid, Edinburgh Instruments, Alphasense, Cubic Sensor and Instrument Co.,Ltd, Nano Environmental Technology S.r.l. (N.E.T.), Super Systems, ORIENTAL SYSTEM TECHNOLOGY INC., smartGAS Mikrosensorik GmbH, SST Sensing Ltd, Winsen, Suzhou Promisense Co., Ltd.
Forecast units USD million in value
Report coverage Revenue and volume forecast, company share, competitive landscape, growth factors and trends

FAQ for this report

What is the and India NDIR Sensors Market size in 2029?

Ans: The and India NDIR Sensors Market size in 2029 will be US$ 1332.2 million.

What is the market share of major companies in and India NDIR Sensors Market?

Ans: Top five players occupy for a share over 18%.

What is the and India NDIR Sensors Market share by region?

Ans: North America is the largest market, with a share about 36%, followed by Europe and Asia-Pacific. According to IMF (its July update to its World Economic Outlook), India’s GDP growth is projected at 6.1% in 2023, powered by domestic investment.

What is the and India NDIR Sensors Market share by type?

Ans: In terms of product type, NDIR CO2 Sensors is the largest segment, with a share over 57%.

What is the and India NDIR Sensors Market share by application?

Ans: In terms of application, Residential and Commercial Security is the largest market, with a share about 50%.

Who are the main players in the and India NDIR Sensors Market report?

Ans: The main players in the and India NDIR Sensors Market are Amphenol Advanced Sensors, Senseair (Asahi Kasei Microdevices), Murata, Sensirion, MKS Instruments, Vaisala, Teledyne API, Honeywell, ELT SENSOR, E+E, Dwyer Instruments, Trane, Micro-Hybrid, Edinburgh Instruments, Alphasense, Cubic Sensor and Instrument Co.,Ltd, Nano Environmental Technology S.r.l. (N.E.T.), Super Systems, ORIENTAL SYSTEM TECHNOLOGY INC., smartGAS Mikrosensorik GmbH, SST Sensing Ltd, Winsen, Suzhou Promisense Co., Ltd.

What are the Application segmentation covered in the and India NDIR Sensors Market report?

Ans: The Applications covered in the and India NDIR Sensors Market report are Industrial Safety, Environmental Protection Industry, Medical Industry, Residential and Commercial Security, Power Industry, Automobile Industry, Research Institutions, Others

What are the Type segmentation covered in the and India NDIR Sensors Market report?

Ans: The Types covered in the and India NDIR Sensors Market report are NDIR CO2 Sensors, NDIR Methane (CH4) Gas Sensors, NDIR CO Sensors, NDIR Propane Gas Sensors, NDIR Refrigerant Gases Sensors, NDIR Ethylene Gases Sensors, NDIR SF6 Infrared Sensors, Others

1 Study Coverage
1.1 NDIR Sensors Product Introduction
1.2 Global NDIR Sensors Outlook 2018 VS 2022 VS 2029
1.2.1 Global NDIR Sensors Sales in US$ Million for the Year 2018-2029
1.2.2 Global NDIR Sensors Sales in Volume for the Year 2018-2029
1.3 India NDIR Sensors Outlook 2018 VS 2022 VS 2029
1.3.1 India NDIR Sensors Sales in US$ Million for the Year 2018-2029
1.3.2 India NDIR Sensors Sales in Volume for the Year 2018-2029
1.4 NDIR Sensors Market Size, India VS Global, 2018 VS 2022 VS 2029
1.4.1 The Market Share of India NDIR Sensors in Global, 2018 VS 2022 VS 2029
1.4.2 The Growth Rate of NDIR Sensors Market Size, India VS Global, 2018 VS 2022 VS 2029
1.5 NDIR Sensors Market Dynamics
1.5.1 NDIR Sensors Industry Trends
1.5.2 NDIR Sensors Market Drivers
1.5.3 NDIR Sensors Market Challenges
1.5.4 NDIR Sensors Market Restraints
1.6 Study Objectives
1.7 Years Considered
1.8 Years Considered
2 NDIR Sensors by Type
2.1 NDIR Sensors Market Segment by Type
2.1.1 NDIR CO2 Sensors
2.1.2 NDIR Methane (CH4) Gas Sensors
2.1.3 NDIR CO Sensors
2.1.4 NDIR Propane Gas Sensors
2.1.5 NDIR Refrigerant Gases Sensors
2.1.6 NDIR Ethylene Gases Sensors
2.1.7 NDIR SF6 Infrared Sensors
2.1.8 Others
2.2 Global NDIR Sensors Market Size by Type
2.2.1 Global NDIR Sensors Sales in Value, by Type (2018, 2022 & 2029)
2.2.2 Global NDIR Sensors Sales in Volume, by Type (2018, 2022 & 2029)
2.2.3 Global NDIR Sensors Average Selling Price (ASP) by Type (2018, 2022 & 2029)
2.3 India NDIR Sensors Market Size by Type
2.3.1 India NDIR Sensors Sales in Value, by Type (2018, 2022 & 2029)
2.3.2 India NDIR Sensors Sales in Volume, by Type (2018, 2022 & 2029)
2.3.3 India NDIR Sensors Average Selling Price (ASP) by Type (2018, 2022 & 2029)
3 NDIR Sensors by Application
3.1 NDIR Sensors Market Segment by Application
3.1.1 Industrial Safety
3.1.2 Environmental Protection Industry
3.1.3 Medical Industry
3.1.4 Residential and Commercial Security
3.1.5 Power Industry
3.1.6 Automobile Industry
3.1.7 Research Institutions
3.1.8 Others
3.2 Global NDIR Sensors Market Size by Application
3.2.1 Global NDIR Sensors Sales in Value, by Application (2018, 2022 & 2029)
3.2.2 Global NDIR Sensors Sales in Volume, by Application (2018, 2022 & 2029)
3.3.3 Global NDIR Sensors Average Selling Price (ASP) by Application (2018, 2022 & 2029)
3.3 India NDIR Sensors Market Size by Application
3.3.1 India NDIR Sensors Sales in Value, by Application (2018, 2022 & 2029)
3.3.2 India NDIR Sensors Sales in Volume, by Application (2018, 2022 & 2029)
3.3.3 India NDIR Sensors Average Selling Price (ASP) by Application (2018, 2022 & 2029)
4 Global NDIR Sensors Competitor Landscape by Company
4.1 Global NDIR Sensors Market Size by Company
4.1.1 Global Key Manufacturers of NDIR Sensors, Ranked by Revenue (2022)
4.1.2 Global NDIR Sensors Revenue by Manufacturer (2018-2023)
4.1.3 Global NDIR Sensors Sales by Manufacturer (2018-2023)
4.1.4 Global NDIR Sensors Price by Manufacturer (2018-2023)
4.2 Global NDIR Sensors Concentration Ratio (CR)
4.2.1 NDIR Sensors Market Concentration Ratio (CR)
4.2.2 Global Top 5 and Top 10 Largest Manufacturers of NDIR Sensors in 2022
4.2.3 Global NDIR Sensors Market Share by Company Type (Tier 1, Tier 2, and Tier 3)
4.3 Global Key Manufacturers of NDIR Sensors, Manufacturing Base Distribution and Headquarters
4.4 Global Key Manufacturers of NDIR Sensors, Product Offered and Application
4.5 Global Key Manufacturers of NDIR Sensors, Date of Enter into This Industry
4.6 Manufacturers Mergers & Acquisitions, Expansion Plans
4.7 India NDIR Sensors Market Size by Company
4.7.1 Key Players of NDIR Sensors in India, Ranked by Revenue (2022)
4.7.2 India NDIR Sensors Revenue by Players (2018-2023)
4.7.3 India NDIR Sensors Sales by Players (2018-2023)
5 Global NDIR Sensors Market Size by Region
5.1 Global NDIR Sensors Market Size by Region: 2018 VS 2022 VS 2029
5.2 Global NDIR Sensors Market Size in Volume by Region (2018-2029)
5.2.1 Global NDIR Sensors Sales in Volume by Region: 2018-2023
5.2.2 Global NDIR Sensors Sales in Volume Forecast by Region (2024-2029)
5.3 Global NDIR Sensors Market Size in Value by Region (2018-2029)
5.3.1 Global NDIR Sensors Sales in Value by Region: 2018-2023
5.3.2 Global NDIR Sensors Sales in Value by Region: 2024-2029
6 Americas
6.1 Americas NDIR Sensors Market Size YoY Growth 2018-2029
6.2 Americas NDIR Sensors Sales in Volume, by Type (2018, 2022 & 2029)
6.3 Americas NDIR Sensors Sales in Volume, by Application (2018, 2022 & 2029)
6.4 Americas NDIR Sensors Market Facts & Figures by Country (2018, 2022 & 2029)
6.4.1 Americas NDIR Sensors Sales in Value by Country (2018, 2022 & 2029)
6.4.2 Americas NDIR Sensors Sales in Volume by Country (2018, 2022 & 2029)
6.4.3 United States
6.4.4 Canada
6.4.5 Mexico
6.4.6 Brazil
7 EMEA
7.1 EMEA NDIR Sensors Market Size YoY Growth 2018-2029
7.2 EMEA NDIR Sensors Sales in Volume, by Type (2018, 2022 & 2029)
7.3 EMEA NDIR Sensors Sales in Volume, by Application (2018, 2022 & 2029)
7.4 EMEA NDIR Sensors Market Facts & Figures by Country (2018, 2022 & 2029)
7.4.1 EMEA NDIR Sensors Sales in Value by Country (2018, 2022 & 2029)
7.4.2 EMEA NDIR Sensors Sales in Volume by Country (2018, 2022 & 2029)
7.4.3 Europe
7.4.4 Middle East
7.4.5 Africa
8 China
8.1 China NDIR Sensors Market Size YoY Growth 2018-2029
8.2 China NDIR Sensors Sales in Volume, by Type (2018, 2022 & 2029)
8.3 China NDIR Sensors Sales in Volume, by Application (2018, 2022 & 2029)
9 APAC
9.1 APAC NDIR Sensors Market Size YoY Growth 2018-2029
9.2 APAC NDIR Sensors Sales in Volume, by Type (2018, 2022 & 2029)
9.3 APAC NDIR Sensors Sales in Volume, by Application (2018, 2022 & 2029)
9.4 APAC NDIR Sensors Market Facts & Figures by Region (2018, 2022 & 2029)
9.4.1 APAC NDIR Sensors Sales in Value by Region (2018, 2022 & 2029)
9.4.2 APAC NDIR Sensors Sales in Volume by Region (2018, 2022 & 2029)
9.4.3 Japan
9.4.4 South Korea
9.4.5 China Taiwan
9.4.6 Southeast Asia
9.4.7 India
10 Company Profiles
10.1 Amphenol Advanced Sensors
10.1.1 Amphenol Advanced Sensors Company Information
10.1.2 Amphenol Advanced Sensors Description and Business Overview
10.1.3 Amphenol Advanced Sensors NDIR Sensors Sales, Revenue and Gross Margin (2018-2023)
10.1.4 Amphenol Advanced Sensors NDIR Sensors Products Offered
10.1.5 Amphenol Advanced Sensors Recent Development
10.2 Senseair (Asahi Kasei Microdevices)
10.2.1 Senseair (Asahi Kasei Microdevices) Company Information
10.2.2 Senseair (Asahi Kasei Microdevices) Description and Business Overview
10.2.3 Senseair (Asahi Kasei Microdevices) NDIR Sensors Sales, Revenue and Gross Margin (2018-2023)
10.2.4 Senseair (Asahi Kasei Microdevices) NDIR Sensors Products Offered
10.2.5 Senseair (Asahi Kasei Microdevices) Recent Development
10.3 Murata
10.3.1 Murata Company Information
10.3.2 Murata Description and Business Overview
10.3.3 Murata NDIR Sensors Sales, Revenue and Gross Margin (2018-2023)
10.3.4 Murata NDIR Sensors Products Offered
10.3.5 Murata Recent Development
10.4 Sensirion
10.4.1 Sensirion Company Information
10.4.2 Sensirion Description and Business Overview
10.4.3 Sensirion NDIR Sensors Sales, Revenue and Gross Margin (2018-2023)
10.4.4 Sensirion NDIR Sensors Products Offered
10.4.5 Sensirion Recent Development
10.5 MKS Instruments
10.5.1 MKS Instruments Company Information
10.5.2 MKS Instruments Description and Business Overview
10.5.3 MKS Instruments NDIR Sensors Sales, Revenue and Gross Margin (2018-2023)
10.5.4 MKS Instruments NDIR Sensors Products Offered
10.5.5 MKS Instruments Recent Development
10.6 Vaisala
10.6.1 Vaisala Company Information
10.6.2 Vaisala Description and Business Overview
10.6.3 Vaisala NDIR Sensors Sales, Revenue and Gross Margin (2018-2023)
10.6.4 Vaisala NDIR Sensors Products Offered
10.6.5 Vaisala Recent Development
10.7 Teledyne API
10.7.1 Teledyne API Company Information
10.7.2 Teledyne API Description and Business Overview
10.7.3 Teledyne API NDIR Sensors Sales, Revenue and Gross Margin (2018-2023)
10.7.4 Teledyne API NDIR Sensors Products Offered
10.7.5 Teledyne API Recent Development
10.8 Honeywell
10.8.1 Honeywell Company Information
10.8.2 Honeywell Description and Business Overview
10.8.3 Honeywell NDIR Sensors Sales, Revenue and Gross Margin (2018-2023)
10.8.4 Honeywell NDIR Sensors Products Offered
10.8.5 Honeywell Recent Development
10.9 ELT SENSOR
10.9.1 ELT SENSOR Company Information
10.9.2 ELT SENSOR Description and Business Overview
10.9.3 ELT SENSOR NDIR Sensors Sales, Revenue and Gross Margin (2018-2023)
10.9.4 ELT SENSOR NDIR Sensors Products Offered
10.9.5 ELT SENSOR Recent Development
10.10 E+E
10.10.1 E+E Company Information
10.10.2 E+E Description and Business Overview
10.10.3 E+E NDIR Sensors Sales, Revenue and Gross Margin (2018-2023)
10.10.4 E+E NDIR Sensors Products Offered
10.10.5 E+E Recent Development
10.11 Dwyer Instruments
10.11.1 Dwyer Instruments Company Information
10.11.2 Dwyer Instruments Description and Business Overview
10.11.3 Dwyer Instruments NDIR Sensors Sales, Revenue and Gross Margin (2018-2023)
10.11.4 Dwyer Instruments NDIR Sensors Products Offered
10.11.5 Dwyer Instruments Recent Development
10.12 Trane
10.12.1 Trane Company Information
10.12.2 Trane Description and Business Overview
10.12.3 Trane NDIR Sensors Sales, Revenue and Gross Margin (2018-2023)
10.12.4 Trane NDIR Sensors Products Offered
10.12.5 Trane Recent Development
10.13 Micro-Hybrid
10.13.1 Micro-Hybrid Company Information
10.13.2 Micro-Hybrid Description and Business Overview
10.13.3 Micro-Hybrid NDIR Sensors Sales, Revenue and Gross Margin (2018-2023)
10.13.4 Micro-Hybrid NDIR Sensors Products Offered
10.13.5 Micro-Hybrid Recent Development
10.14 Edinburgh Instruments
10.14.1 Edinburgh Instruments Company Information
10.14.2 Edinburgh Instruments Description and Business Overview
10.14.3 Edinburgh Instruments NDIR Sensors Sales, Revenue and Gross Margin (2018-2023)
10.14.4 Edinburgh Instruments NDIR Sensors Products Offered
10.14.5 Edinburgh Instruments Recent Development
10.15 Alphasense
10.15.1 Alphasense Company Information
10.15.2 Alphasense Description and Business Overview
10.15.3 Alphasense NDIR Sensors Sales, Revenue and Gross Margin (2018-2023)
10.15.4 Alphasense NDIR Sensors Products Offered
10.15.5 Alphasense Recent Development
10.16 Cubic Sensor and Instrument Co.,Ltd
10.16.1 Cubic Sensor and Instrument Co.,Ltd Company Information
10.16.2 Cubic Sensor and Instrument Co.,Ltd Description and Business Overview
10.16.3 Cubic Sensor and Instrument Co.,Ltd NDIR Sensors Sales, Revenue and Gross Margin (2018-2023)
10.16.4 Cubic Sensor and Instrument Co.,Ltd NDIR Sensors Products Offered
10.16.5 Cubic Sensor and Instrument Co.,Ltd Recent Development
10.17 Nano Environmental Technology S.r.l. (N.E.T.)
10.17.1 Nano Environmental Technology S.r.l. (N.E.T.) Company Information
10.17.2 Nano Environmental Technology S.r.l. (N.E.T.) Description and Business Overview
10.17.3 Nano Environmental Technology S.r.l. (N.E.T.) NDIR Sensors Sales, Revenue and Gross Margin (2018-2023)
10.17.4 Nano Environmental Technology S.r.l. (N.E.T.) NDIR Sensors Products Offered
10.17.5 Nano Environmental Technology S.r.l. (N.E.T.) Recent Development
10.18 Super Systems
10.18.1 Super Systems Company Information
10.18.2 Super Systems Description and Business Overview
10.18.3 Super Systems NDIR Sensors Sales, Revenue and Gross Margin (2018-2023)
10.18.4 Super Systems NDIR Sensors Products Offered
10.18.5 Super Systems Recent Development
10.19 ORIENTAL SYSTEM TECHNOLOGY INC.
10.19.1 ORIENTAL SYSTEM TECHNOLOGY INC. Company Information
10.19.2 ORIENTAL SYSTEM TECHNOLOGY INC. Description and Business Overview
10.19.3 ORIENTAL SYSTEM TECHNOLOGY INC. NDIR Sensors Sales, Revenue and Gross Margin (2018-2023)
10.19.4 ORIENTAL SYSTEM TECHNOLOGY INC. NDIR Sensors Products Offered
10.19.5 ORIENTAL SYSTEM TECHNOLOGY INC. Recent Development
10.20 smartGAS Mikrosensorik GmbH
10.20.1 smartGAS Mikrosensorik GmbH Company Information
10.20.2 smartGAS Mikrosensorik GmbH Description and Business Overview
10.20.3 smartGAS Mikrosensorik GmbH NDIR Sensors Sales, Revenue and Gross Margin (2018-2023)
10.20.4 smartGAS Mikrosensorik GmbH NDIR Sensors Products Offered
10.20.5 smartGAS Mikrosensorik GmbH Recent Development
10.21 SST Sensing Ltd
10.21.1 SST Sensing Ltd Company Information
10.21.2 SST Sensing Ltd Description and Business Overview
10.21.3 SST Sensing Ltd NDIR Sensors Sales, Revenue and Gross Margin (2018-2023)
10.21.4 SST Sensing Ltd NDIR Sensors Products Offered
10.21.5 SST Sensing Ltd Recent Development
10.22 Winsen
10.22.1 Winsen Company Information
10.22.2 Winsen Description and Business Overview
10.22.3 Winsen NDIR Sensors Sales, Revenue and Gross Margin (2018-2023)
10.22.4 Winsen NDIR Sensors Products Offered
10.22.5 Winsen Recent Development
10.23 Suzhou Promisense Co., Ltd.
10.23.1 Suzhou Promisense Co., Ltd. Company Information
10.23.2 Suzhou Promisense Co., Ltd. Description and Business Overview
10.23.3 Suzhou Promisense Co., Ltd. NDIR Sensors Sales, Revenue and Gross Margin (2018-2023)
10.23.4 Suzhou Promisense Co., Ltd. NDIR Sensors Products Offered
10.23.5 Suzhou Promisense Co., Ltd. Recent Development
11 Industry Chain and Sales Channels Analysis
11.1 NDIR Sensors Industry Chain Analysis
11.2 NDIR Sensors Key Raw Materials
11.2.1 Key Raw Materials
11.2.2 Raw Materials Key Suppliers
11.3 NDIR Sensors Production Mode & Process
11.4 NDIR Sensors Sales and Marketing
11.4.1 NDIR Sensors Sales Channels
11.4.2 NDIR Sensors Distributors
11.5 NDIR Sensors Customers
12 Research Findings and Conclusion
13 Appendix
13.1 Research Methodology
13.1.1 Methodology/Research Approach
13.1.2 Data Source
13.2 Author Details
13.3 Disclaimer
List of Tables
    Table 1. NDIR Sensors CAGR in Value, India VS Global, 2018 VS 2022 VS 2029
    Table 2. NDIR Sensors Market Trends
    Table 3. NDIR Sensors Market Drivers
    Table 4. NDIR Sensors Market Challenges
    Table 5. NDIR Sensors Market Restraints
    Table 6. Global NDIR Sensors Sales Growth Rate (CAGR) by Type: 2018 VS 2022 VS 2029 (US$ Million)
    Table 7. India NDIR Sensors Sales Growth Rate (CAGR) by Type: 2018 VS 2022 VS 2029 (US$ Million)
    Table 8. Global NDIR Sensors Sales Growth Rate (CAGR) by Application: 2018 VS 2022 VS 2029 (US$ Million)
    Table 9. India NDIR Sensors Sales Growth Rate (CAGR) by Application: 2018 VS 2022 VS 2029 (US$ Million)
    Table 10. Global Key Manufacturers of NDIR Sensors, Ranked by Revenue (2022) & (US$ Million)
    Table 11. Global NDIR Sensors Revenue by Manufacturer, (US$ Million), 2018-2023
    Table 12. Global NDIR Sensors Revenue Share by Manufacturer, 2018-2023
    Table 13. Global NDIR Sensors Sales by Manufacturer, (K Units), 2018-2023
    Table 14. Global NDIR Sensors Sales Share by Manufacturer, 2018-2023
    Table 15. Global NDIR Sensors Price by Manufacturer (2018-2023) & (US$/Unit)
    Table 16. Global NDIR Sensors Manufacturers Market Concentration Ratio (CR5 and HHI)
    Table 17. Global NDIR Sensors by Company Type (Tier 1, Tier 2, and Tier 3) & (based on the Revenue in NDIR Sensors as of 2022)
    Table 18. Global Key Manufacturers of NDIR Sensors, Manufacturing Base Distribution and Headquarters
    Table 19. Global Key Manufacturers of NDIR Sensors, Product Offered and Application
    Table 20. Global Key Manufacturers of NDIR Sensors, Date of Enter into This Industry
    Table 21. Manufacturers Mergers & Acquisitions, Expansion Plans
    Table 22. Key Players of NDIR Sensors in India, Ranked by Revenue (2022) & (US$ million)
    Table 23. India NDIR Sensors Revenue by Players, (US$ Million), (2018-2023)
    Table 24. India NDIR Sensors Revenue Share by Players, (2018-2023)
    Table 25. India NDIR Sensors Sales by Players, (K Units), (2018-2023)
    Table 26. India NDIR Sensors Sales Share by Players, (2018-2023)
    Table 27. Global NDIR Sensors Market Size Growth Rate (CAGR) by Region (US$ Million): 2018 VS 2022 VS 2029
    Table 28. Global NDIR Sensors Sales in Volume by Region (2018-2023) & (K Units)
    Table 29. Global NDIR Sensors Sales in Volume Forecast by Region (2024-2029) & (K Units)
    Table 30. Global NDIR Sensors Sales in Value by Region (2018-2023) & (US$ Million)
    Table 31. Global NDIR Sensors Sales in Value Forecast by Region (2024-2029) & (US$ Million)
    Table 32. Americas NDIR Sensors Market Size Growth Rate (CAGR) by Country (US$ Million): 2018 VS 2022 VS 2029
    Table 33. Americas NDIR Sensors Sales in Value by Country (2018-2023) & (US$ Million)
    Table 34. Americas NDIR Sensors Sales in Value by Country (2024-2029) & (US$ Million)
    Table 35. Americas NDIR Sensors Sales in Volume by Country (2018-2023) & (K Units)
    Table 36. Americas NDIR Sensors Sales in Volume by Country (2024-2029) & (K Units)
    Table 37. EMEA NDIR Sensors Market Size Growth Rate (CAGR) by Country (US$ Million): 2018 VS 2022 VS 2029
    Table 38. EMEA NDIR Sensors Sales in Value by Country (2018-2023) & (US$ Million)
    Table 39. EMEA NDIR Sensors Sales in Value by Country (2024-2029) & (US$ Million)
    Table 40. EMEA NDIR Sensors Sales in Volume by Country (2018-2023) & (K Units)
    Table 41. EMEA NDIR Sensors Sales in Volume by Country (2024-2029) & (K Units)
    Table 42. APAC NDIR Sensors Market Size Growth Rate (CAGR) by Country (US$ Million): 2018 VS 2022 VS 2029
    Table 43. APAC NDIR Sensors Sales in Value by Country (2018-2023) & (US$ Million)
    Table 44. APAC NDIR Sensors Sales in Value by Country (2024-2029) & (US$ Million)
    Table 45. APAC NDIR Sensors Sales in Volume by Country (2018-2023) & (K Units)
    Table 46. APAC NDIR Sensors Sales in Volume by Country (2024-2029) & (K Units)
    Table 47. Amphenol Advanced Sensors Company Information
    Table 48. Amphenol Advanced Sensors Description and Business Overview
    Table 49. Amphenol Advanced Sensors NDIR Sensors Sales (K Units), Revenue (US$ Million), Price (US$/Unit) and Gross Margin (2018-2023)
    Table 50. Amphenol Advanced Sensors NDIR Sensors Product
    Table 51. Amphenol Advanced Sensors Recent Development
    Table 52. Senseair (Asahi Kasei Microdevices) Company Information
    Table 53. Senseair (Asahi Kasei Microdevices) Description and Business Overview
    Table 54. Senseair (Asahi Kasei Microdevices) NDIR Sensors Sales (K Units), Revenue (US$ Million), Price (US$/Unit) and Gross Margin (2018-2023)
    Table 55. Senseair (Asahi Kasei Microdevices) NDIR Sensors Product
    Table 56. Senseair (Asahi Kasei Microdevices) Recent Development
    Table 57. Murata Company Information
    Table 58. Murata Description and Business Overview
    Table 59. Murata NDIR Sensors Sales (K Units), Revenue (US$ Million), Price (US$/Unit) and Gross Margin (2018-2023)
    Table 60. Murata NDIR Sensors Product
    Table 61. Murata Recent Development
    Table 62. Sensirion Company Information
    Table 63. Sensirion Description and Business Overview
    Table 64. Sensirion NDIR Sensors Sales (K Units), Revenue (US$ Million), Price (US$/Unit) and Gross Margin (2018-2023)
    Table 65. Sensirion NDIR Sensors Product
    Table 66. Sensirion Recent Development
    Table 67. MKS Instruments Company Information
    Table 68. MKS Instruments Description and Business Overview
    Table 69. MKS Instruments NDIR Sensors Sales (K Units), Revenue (US$ Million), Price (US$/Unit) and Gross Margin (2018-2023)
    Table 70. MKS Instruments NDIR Sensors Product
    Table 71. MKS Instruments Recent Development
    Table 72. Vaisala Company Information
    Table 73. Vaisala Description and Business Overview
    Table 74. Vaisala NDIR Sensors Sales (K Units), Revenue (US$ Million), Price (US$/Unit) and Gross Margin (2018-2023)
    Table 75. Vaisala NDIR Sensors Product
    Table 76. Vaisala Recent Development
    Table 77. Teledyne API Company Information
    Table 78. Teledyne API Description and Business Overview
    Table 79. Teledyne API NDIR Sensors Sales (K Units), Revenue (US$ Million), Price (US$/Unit) and Gross Margin (2018-2023)
    Table 80. Teledyne API NDIR Sensors Product
    Table 81. Teledyne API Recent Development
    Table 82. Honeywell Company Information
    Table 83. Honeywell Description and Business Overview
    Table 84. Honeywell NDIR Sensors Sales (K Units), Revenue (US$ Million), Price (US$/Unit) and Gross Margin (2018-2023)
    Table 85. Honeywell NDIR Sensors Product
    Table 86. Honeywell Recent Development
    Table 87. ELT SENSOR Company Information
    Table 88. ELT SENSOR Description and Business Overview
    Table 89. ELT SENSOR NDIR Sensors Sales (K Units), Revenue (US$ Million), Price (US$/Unit) and Gross Margin (2018-2023)
    Table 90. ELT SENSOR NDIR Sensors Product
    Table 91. ELT SENSOR Recent Development
    Table 92. E+E Company Information
    Table 93. E+E Description and Business Overview
    Table 94. E+E NDIR Sensors Sales (K Units), Revenue (US$ Million), Price (US$/Unit) and Gross Margin (2018-2023)
    Table 95. E+E NDIR Sensors Product
    Table 96. E+E Recent Development
    Table 97. Dwyer Instruments Company Information
    Table 98. Dwyer Instruments Description and Business Overview
    Table 99. Dwyer Instruments NDIR Sensors Sales (K Units), Revenue (US$ Million), Price (US$/Unit) and Gross Margin (2018-2023)
    Table 100. Dwyer Instruments NDIR Sensors Product
    Table 101. Dwyer Instruments Recent Development
    Table 102. Trane Company Information
    Table 103. Trane Description and Business Overview
    Table 104. Trane NDIR Sensors Sales (K Units), Revenue (US$ Million), Price (US$/Unit) and Gross Margin (2018-2023)
    Table 105. Trane NDIR Sensors Product
    Table 106. Trane Recent Development
    Table 107. Micro-Hybrid Company Information
    Table 108. Micro-Hybrid Description and Business Overview
    Table 109. Micro-Hybrid NDIR Sensors Sales (K Units), Revenue (US$ Million), Price (US$/Unit) and Gross Margin (2018-2023)
    Table 110. Micro-Hybrid NDIR Sensors Product
    Table 111. Micro-Hybrid Recent Development
    Table 112. Edinburgh Instruments Company Information
    Table 113. Edinburgh Instruments Description and Business Overview
    Table 114. Edinburgh Instruments NDIR Sensors Sales (K Units), Revenue (US$ Million), Price (US$/Unit) and Gross Margin (2018-2023)
    Table 115. Edinburgh Instruments NDIR Sensors Product
    Table 116. Edinburgh Instruments Recent Development
    Table 117. Alphasense Company Information
    Table 118. Alphasense Description and Business Overview
    Table 119. Alphasense NDIR Sensors Sales (K Units), Revenue (US$ Million), Price (US$/Unit) and Gross Margin (2018-2023)
    Table 120. Alphasense NDIR Sensors Product
    Table 121. Alphasense Recent Development
    Table 122. Cubic Sensor and Instrument Co.,Ltd Company Information
    Table 123. Cubic Sensor and Instrument Co.,Ltd Description and Business Overview
    Table 124. Cubic Sensor and Instrument Co.,Ltd NDIR Sensors Sales (K Units), Revenue (US$ Million), Price (US$/Unit) and Gross Margin (2018-2023)
    Table 125. Cubic Sensor and Instrument Co.,Ltd NDIR Sensors Product
    Table 126. Cubic Sensor and Instrument Co.,Ltd Recent Development
    Table 127. Nano Environmental Technology S.r.l. (N.E.T.) Company Information
    Table 128. Nano Environmental Technology S.r.l. (N.E.T.) Description and Business Overview
    Table 129. Nano Environmental Technology S.r.l. (N.E.T.) NDIR Sensors Sales (K Units), Revenue (US$ Million), Price (US$/Unit) and Gross Margin (2018-2023)
    Table 130. Nano Environmental Technology S.r.l. (N.E.T.) NDIR Sensors Product
    Table 131. Nano Environmental Technology S.r.l. (N.E.T.) Recent Development
    Table 132. Super Systems Company Information
    Table 133. Super Systems Description and Business Overview
    Table 134. Super Systems NDIR Sensors Sales (K Units), Revenue (US$ Million), Price (US$/Unit) and Gross Margin (2018-2023)
    Table 135. Super Systems NDIR Sensors Product
    Table 136. Super Systems Recent Development
    Table 137. ORIENTAL SYSTEM TECHNOLOGY INC. Company Information
    Table 138. ORIENTAL SYSTEM TECHNOLOGY INC. Description and Business Overview
    Table 139. ORIENTAL SYSTEM TECHNOLOGY INC. NDIR Sensors Sales (K Units), Revenue (US$ Million), Price (US$/Unit) and Gross Margin (2018-2023)
    Table 140. ORIENTAL SYSTEM TECHNOLOGY INC. NDIR Sensors Product
    Table 141. ORIENTAL SYSTEM TECHNOLOGY INC. Recent Development
    Table 142. smartGAS Mikrosensorik GmbH Company Information
    Table 143. smartGAS Mikrosensorik GmbH Description and Business Overview
    Table 144. smartGAS Mikrosensorik GmbH NDIR Sensors Sales (K Units), Revenue (US$ Million), Price (US$/Unit) and Gross Margin (2018-2023)
    Table 145. smartGAS Mikrosensorik GmbH NDIR Sensors Product
    Table 146. smartGAS Mikrosensorik GmbH Recent Development
    Table 147. SST Sensing Ltd Company Information
    Table 148. SST Sensing Ltd Description and Business Overview
    Table 149. SST Sensing Ltd NDIR Sensors Sales (K Units), Revenue (US$ Million), Price (US$/Unit) and Gross Margin (2018-2023)
    Table 150. SST Sensing Ltd NDIR Sensors Product
    Table 151. SST Sensing Ltd Recent Development
    Table 152. Winsen Company Information
    Table 153. Winsen Description and Business Overview
    Table 154. Winsen NDIR Sensors Sales (K Units), Revenue (US$ Million), Price (US$/Unit) and Gross Margin (2018-2023)
    Table 155. Winsen NDIR Sensors Product
    Table 156. Winsen Recent Development
    Table 157. Suzhou Promisense Co., Ltd. Company Information
    Table 158. Suzhou Promisense Co., Ltd. Description and Business Overview
    Table 159. Suzhou Promisense Co., Ltd. NDIR Sensors Sales (K Units), Revenue (US$ Million), Price (US$/Unit) and Gross Margin (2018-2023)
    Table 160. Suzhou Promisense Co., Ltd. NDIR Sensors Product
    Table 161. Suzhou Promisense Co., Ltd. Recent Development
    Table 162. Key Raw Materials Lists
    Table 163. Raw Materials Key Suppliers Lists
    Table 164. NDIR Sensors Customers List
    Table 165. NDIR Sensors Distributors List
    Table 166. Research Programs/Design for This Report
    Table 167. Key Data Information from Secondary Sources
    Table 168. Key Data Information from Primary Sources
List of Figures
    Figure 1. NDIR Sensors Product Picture
    Figure 2. Global NDIR Sensors Revenue, (US$ Million), 2018 VS 2022 VS 2029
    Figure 3. Global NDIR Sensors Market Size 2018-2029 (US$ Million)
    Figure 4. Global NDIR Sensors Sales 2018-2029 (K Units)
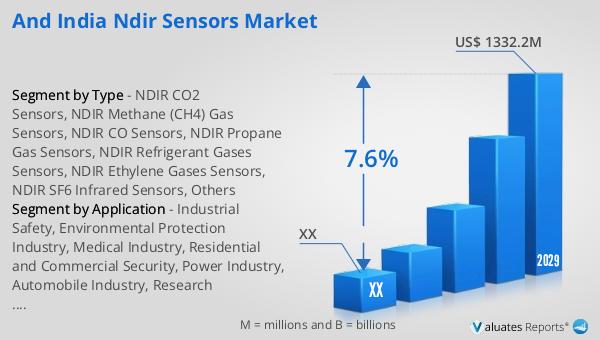
    Figure 5. India NDIR Sensors Revenue, (US$ Million), 2018 VS 2022 VS 2029
    Figure 6. India NDIR Sensors Market Size 2018-2029 (US$ Million)
    Figure 7. India NDIR Sensors Sales 2018-2029 (K Units)
    Figure 8. India NDIR Sensors Market Share in Global, in Value (US$ Million) 2018-2029
    Figure 9. India NDIR Sensors Market Share in Global, in Volume (K Units) 2018-2029
    Figure 10. NDIR Sensors Report Years Considered
    Figure 11. Product Picture of NDIR CO2 Sensors
    Figure 12. Product Picture of NDIR Methane (CH4) Gas Sensors
    Figure 13. Product Picture of NDIR CO Sensors
    Figure 14. Product Picture of NDIR Propane Gas Sensors
    Figure 15. Product Picture of NDIR Refrigerant Gases Sensors
    Figure 16. Product Picture of NDIR Ethylene Gases Sensors
    Figure 17. Product Picture of NDIR SF6 Infrared Sensors
    Figure 18. Product Picture of Others
    Figure 19. Global NDIR Sensors Market Share by Type in 2022 & 2029
    Figure 20. Global NDIR Sensors Sales in Value by Type (2018-2029) & (US$ Million)
    Figure 21. Global NDIR Sensors Sales Market Share in Value by Type (2018-2029)
    Figure 22. Global NDIR Sensors Sales by Type (2018-2029) & (K Units)
    Figure 23. Global NDIR Sensors Sales Market Share in Volume by Type (2018-2029)
    Figure 24. Global NDIR Sensors Price by Type (2018-2029) & (US$/Unit)
    Figure 25. India NDIR Sensors Market Share by Type in 2022 & 2029
    Figure 26. India NDIR Sensors Sales in Value by Type (2018-2029) & (US$ Million)
    Figure 27. India NDIR Sensors Sales Market Share in Value by Type (2018-2029)
    Figure 28. India NDIR Sensors Sales by Type (2018-2029) & (K Units)
    Figure 29. India NDIR Sensors Sales Market Share in Volume by Type (2018-2029)
    Figure 30. India NDIR Sensors Price by Type (2018-2029) & (US$/Unit)
    Figure 31. Product Picture of Industrial Safety
    Figure 32. Product Picture of Environmental Protection Industry
    Figure 33. Product Picture of Medical Industry
    Figure 34. Product Picture of Residential and Commercial Security
    Figure 35. Product Picture of Power Industry
    Figure 36. Product Picture of Automobile Industry
    Figure 37. Product Picture of Research Institutions
    Figure 38. Product Picture of Others
    Figure 39. Global NDIR Sensors Market Share by Application in 2022 & 2029
    Figure 40. Global NDIR Sensors Sales in Value by Application (2018-2029) & (US$ Million)
    Figure 41. Global NDIR Sensors Sales Market Share in Value by Application (2018-2029)
    Figure 42. Global NDIR Sensors Sales by Application (2018-2029) & (K Units)
    Figure 43. Global NDIR Sensors Sales Market Share in Volume by Application (2018-2029)
    Figure 44. Global NDIR Sensors Price by Application (2018-2029) & (US$/Unit)
    Figure 45. India NDIR Sensors Market Share by Application in 2022 & 2029
    Figure 46. India NDIR Sensors Sales in Value by Application (2018-2029) & (US$ Million)
    Figure 47. India NDIR Sensors Sales Market Share in Value by Application (2018-2029)
    Figure 48. India NDIR Sensors Sales by Application (2018-2029) & (K Units)
    Figure 49. India NDIR Sensors Sales Market Share in Volume by Application (2018-2029)
    Figure 50. India NDIR Sensors Price by Application (2018-2029) & (US$/Unit)
    Figure 51. Americas NDIR Sensors Sales in Volume Growth Rate 2018-2029 (K Units)
    Figure 52. Americas NDIR Sensors Sales in Value Growth Rate 2018-2029 (US$ Million)
    Figure 53. Americas NDIR Sensors Sales by Type (2018-2029) & (K Units)
    Figure 54. Americas NDIR Sensors Sales Market Share in Volume by Type (2018-2029)
    Figure 55. Americas NDIR Sensors Sales by Application (2018-2029) & (K Units)
    Figure 56. Americas NDIR Sensors Sales Market Share in Volume by Application (2018-2029)
    Figure 57. United States NDIR Sensors Sales in Value Growth Rate (2018-2029) & (US$ Million)
    Figure 58. Canada NDIR Sensors Sales in Value Growth Rate (2018-2029) & (US$ Million)
    Figure 59. Mexico NDIR Sensors Sales in Value Growth Rate (2018-2029) & (US$ Million)
    Figure 60. Brazil NDIR Sensors Sales in Value Growth Rate (2018-2029) & (US$ Million)
    Figure 61. EMEA NDIR Sensors Sales in Volume Growth Rate 2018-2029 (K Units)
    Figure 62. EMEA NDIR Sensors Sales in Value Growth Rate 2018-2029 (US$ Million)
    Figure 63. EMEA NDIR Sensors Sales by Type (2018-2029) & (K Units)
    Figure 64. EMEA NDIR Sensors Sales Market Share in Volume by Type (2018-2029)
    Figure 65. EMEA NDIR Sensors Sales by Application (2018-2029) & (K Units)
    Figure 66. EMEA NDIR Sensors Sales Market Share in Volume by Application (2018-2029)
    Figure 67. Europe NDIR Sensors Sales in Value Growth Rate (2018-2029) & (US$ Million)
    Figure 68. Middle East NDIR Sensors Sales in Value Growth Rate (2018-2029) & (US$ Million)
    Figure 69. Africa NDIR Sensors Sales in Value Growth Rate (2018-2029) & (US$ Million)
    Figure 70. China NDIR Sensors Sales in Volume Growth Rate 2018-2029 (K Units)
    Figure 71. China NDIR Sensors Sales in Value Growth Rate 2018-2029 (US$ Million)
    Figure 72. China NDIR Sensors Sales by Type (2018-2029) & (K Units)
    Figure 73. China NDIR Sensors Sales Market Share in Volume by Type (2018-2029)
    Figure 74. China NDIR Sensors Sales by Application (2018-2029) & (K Units)
    Figure 75. China NDIR Sensors Sales Market Share in Volume by Application (2018-2029)
    Figure 76. APAC NDIR Sensors Sales in Volume Growth Rate 2018-2029 (K Units)
    Figure 77. APAC NDIR Sensors Sales in Value Growth Rate 2018-2029 (US$ Million)
    Figure 78. APAC NDIR Sensors Sales by Type (2018-2029) & (K Units)
    Figure 79. APAC NDIR Sensors Sales Market Share in Volume by Type (2018-2029)
    Figure 80. APAC NDIR Sensors Sales by Application (2018-2029) & (K Units)
    Figure 81. APAC NDIR Sensors Sales Market Share in Volume by Application (2018-2029)
    Figure 82. Japan NDIR Sensors Sales in Value Growth Rate (2018-2029) & (US$ Million)
    Figure 83. South Korea NDIR Sensors Sales in Value Growth Rate (2018-2029) & (US$ Million)
    Figure 84. China Taiwan NDIR Sensors Sales in Value Growth Rate (2018-2029) & (US$ Million)
    Figure 85. Southeast Asia NDIR Sensors Sales in Value Growth Rate (2018-2029) & (US$ Million)
    Figure 86. India NDIR Sensors Sales in Value Growth Rate (2018-2029) & (US$ Million)
    Figure 87. NDIR Sensors Value Chain
    Figure 88. NDIR Sensors Production Process
    Figure 89. Channels of Distribution
    Figure 90. Distributors Profiles
    Figure 91. Bottom-up and Top-down Approaches for This Report
    Figure 92. Data Triangulation
    Figure 93. Key Executives Interviewed
SELECT A FORMAT
Added to Cart
Electronic (PDF)

$4350

This license allows only one user to access the PDF.
Electronic (PDF)

$6525

This license allows 1 - 5 user to access the PDF, license is suitable for small groups of 5 users working together
Electronic (PDF)

$8700

This license allows users/teams in a same Enterprise to use this report, various departments within an enterpise can use this report
Add to Cart
Buy Now (15% Discount)

OUR CUSTOMER

SIS Group of Schools

SIMILAR REPORTS


RELATED REPORTS

Global Thyristor Discs Market Research Report 2025

120 Pages
Type: Report
Code: QYRE-Auto-14J20228
Wed Dec 03 00:00:00 UTC 2025

Add to Cart

Global IMU Attitude Sensor Market Research Report 2025

120 Pages
Type: Report
Code: QYRE-Auto-2L20271
Wed Dec 03 00:00:00 UTC 2025

Add to Cart

Global High Voltage Electrical Swivels Market Research Report 2025

120 Pages
Type: Report
Code: QYRE-Auto-12P20208
Wed Dec 03 00:00:00 UTC 2025

Add to Cart

Global Thyristor Drives Market Research Report 2025

120 Pages
Type: Report
Code: QYRE-Auto-27X19827
Wed Dec 03 00:00:00 UTC 2025

Add to Cart