List of Tables
Table 1. Global Game Art Design Service Market Size Growth Rate by Type (US$ Million): 2021 vs 2025 vs 2032
Table 2. Key Players of Concept Art Design
Table 3. Key Players of 2D Character And Environment Design
Table 4. Key Players of 3D Modeling And Asset Creation
Table 5. Key Players of Animation And Visual Effects Design
Table 6. Key Players of Others
Table 7. Global Game Art Design Service Market Size Growth Rate by Technical (US$ Million): 2021 vs 2025 vs 2032
Table 8. Key Players of Hand-Drawn Digital Illustration
Table 9. Key Players of Real-Time 3D Rendering Production
Table 10. Key Players of Motion Capture Assisted Animation
Table 11. Key Players of Procedural Art and AI-Generated Content
Table 12. Key Players of Others
Table 13. Global Game Art Design Service Market Size Growth Rate by Service Delivery Model (US$ Million): 2021 vs 2025 vs 2032
Table 14. Key Players of Full-Cycle Outsourced Art Production
Table 15. Key Players of Dedicated Team Augmentation Services
Table 16. Key Players of On-Demand Production Services
Table 17. Key Players of Others
Table 18. Global Game Art Design Service Market Size Growth by Application (US$ Million): 2021 vs 2025 vs 2032
Table 19. Global Game Art Design Service Market Size by Region (US$ Million): 2021 vs 2025 vs 2032
Table 20. Global Game Art Design Service Market Size by Region (US$ Million), 2021–2026
Table 21. Global Game Art Design Service Market Share by Region (2021–2026)
Table 22. Global Game Art Design Service Forecasted Market Size by Region (US$ Million), 2027–2032
Table 23. Global Game Art Design Service Market Share by Region (2027–2032)
Table 24. Game Art Design Service Market Trends
Table 25. Game Art Design Service Market Drivers
Table 26. Game Art Design Service Market Challenges
Table 27. Game Art Design Service Market Restraints
Table 28. Global Game Art Design Service Revenue by Players (US$ Million), 2021–2026
Table 29. Global Game Art Design Service Market Share by Players (2021–2026)
Table 30. Global Top Game Art Design Service Players by Tier (Tier 1, Tier 2, and Tier 3), based on Game Art Design Service Revenue, 2025
Table 31. Ranking of Global Top Game Art Design Service Companies by Revenue (US$ Million) in 2025
Table 32. Global 5 Largest Players Market Share by Game Art Design Service Revenue (CR5 and HHI), 2021–2026
Table 33. Global Key Players of Game Art Design Service, Headquarters and Area Served
Table 34. Global Key Players of Game Art Design Service, Products and Applications
Table 35. Global Key Players of Game Art Design Service, Date of General Availability (GA)
Table 36. Mergers and Acquisitions, Expansion Plans
Table 37. Global Game Art Design Service Market Size by Type (US$ Million), 2021–2026
Table 38. Global Game Art Design Service Revenue Market Share by Type (2021–2026)
Table 39. Global Game Art Design Service Forecasted Market Size by Type (US$ Million), 2027–2032
Table 40. Global Game Art Design Service Revenue Market Share by Type (2027–2032)
Table 41. Global Game Art Design Service Market Size by Application (US$ Million), 2021–2026
Table 42. Global Game Art Design Service Revenue Market Share by Application (2021–2026)
Table 43. Global Game Art Design Service Forecasted Market Size by Application (US$ Million), 2027–2032
Table 44. Global Game Art Design Service Revenue Market Share by Application (2027–2032)
Table 45. North America Game Art Design Service Market Size Growth Rate by Country (US$ Million): 2021 vs 2025 vs 2032
Table 46. North America Game Art Design Service Market Size by Country (US$ Million), 2021–2026
Table 47. North America Game Art Design Service Market Size by Country (US$ Million), 2027–2032
Table 48. Europe Game Art Design Service Market Size Growth Rate by Country (US$ Million): 2021 vs 2025 vs 2032
Table 49. Europe Game Art Design Service Market Size by Country (US$ Million), 2021–2026
Table 50. Europe Game Art Design Service Market Size by Country (US$ Million), 2027–2032
Table 51. Asia-Pacific Game Art Design Service Market Size Growth Rate by Region (US$ Million): 2021 vs 2025 vs 2032
Table 52. Asia-Pacific Game Art Design Service Market Size by Region (US$ Million), 2021–2026
Table 53. Asia-Pacific Game Art Design Service Market Size by Region (US$ Million), 2027–2032
Table 54. Latin America Game Art Design Service Market Size Growth Rate by Country (US$ Million): 2021 vs 2025 vs 2032
Table 55. Latin America Game Art Design Service Market Size by Country (US$ Million), 2021–2026
Table 56. Latin America Game Art Design Service Market Size by Country (US$ Million), 2027–2032
Table 57. Middle East & Africa Game Art Design Service Market Size Growth Rate by Country (US$ Million): 2021 vs 2025 vs 2032
Table 58. Middle East & Africa Game Art Design Service Market Size by Country (US$ Million), 2021–2026
Table 59. Middle East & Africa Game Art Design Service Market Size by Country (US$ Million), 2027–2032
Table 60. Virtuos Company Details
Table 61. Virtuos Business Overview
Table 62. Virtuos Game Art Design Service Product
Table 63. Virtuos Revenue in Game Art Design Service Business (US$ Million), 2021–2026
Table 64. Virtuos Recent Development
Table 65. Keywords Studios (Lakshya) Company Details
Table 66. Keywords Studios (Lakshya) Business Overview
Table 67. Keywords Studios (Lakshya) Game Art Design Service Product
Table 68. Keywords Studios (Lakshya) Revenue in Game Art Design Service Business (US$ Million), 2021–2026
Table 69. Keywords Studios (Lakshya) Recent Development
Table 70. Tencent Games Company Details
Table 71. Tencent Games Business Overview
Table 72. Tencent Games Game Art Design Service Product
Table 73. Tencent Games Revenue in Game Art Design Service Business (US$ Million), 2021–2026
Table 74. Tencent Games Recent Development
Table 75. NetEase ThunderFire / GameArt Outsourcing Company Details
Table 76. NetEase ThunderFire / GameArt Outsourcing Business Overview
Table 77. NetEase ThunderFire / GameArt Outsourcing Game Art Design Service Product
Table 78. NetEase ThunderFire / GameArt Outsourcing Revenue in Game Art Design Service Business (US$ Million), 2021–2026
Table 79. NetEase ThunderFire / GameArt Outsourcing Recent Development
Table 80. ArtStation Studios / Community Professionals Company Details
Table 81. ArtStation Studios / Community Professionals Business Overview
Table 82. ArtStation Studios / Community Professionals Game Art Design Service Product
Table 83. ArtStation Studios / Community Professionals Revenue in Game Art Design Service Business (US$ Million), 2021–2026
Table 84. ArtStation Studios / Community Professionals Recent Development
Table 85. Room 8 Studio Company Details
Table 86. Room 8 Studio Business Overview
Table 87. Room 8 Studio Game Art Design Service Product
Table 88. Room 8 Studio Revenue in Game Art Design Service Business (US$ Million), 2021–2026
Table 89. Room 8 Studio Recent Development
Table 90. Sperasoft (A Keyword Studio) Company Details
Table 91. Sperasoft (A Keyword Studio) Business Overview
Table 92. Sperasoft (A Keyword Studio) Game Art Design Service Product
Table 93. Sperasoft (A Keyword Studio) Revenue in Game Art Design Service Business (US$ Million), 2021–2026
Table 94. Sperasoft (A Keyword Studio) Recent Development
Table 95. iLogos Game Studios Company Details
Table 96. iLogos Game Studios Business Overview
Table 97. iLogos Game Studios Game Art Design Service Product
Table 98. iLogos Game Studios Revenue in Game Art Design Service Business (US$ Million), 2021–2026
Table 99. iLogos Game Studios Recent Development
Table 100. Glass Egg (A Virtuos Studio) Company Details
Table 101. Glass Egg (A Virtuos Studio) Business Overview
Table 102. Glass Egg (A Virtuos Studio) Game Art Design Service Product
Table 103. Glass Egg (A Virtuos Studio) Revenue in Game Art Design Service Business (US$ Million), 2021–2026
Table 104. Glass Egg (A Virtuos Studio) Recent Development
Table 105. Black Shamrock (A Virtuos Studio) Company Details
Table 106. Black Shamrock (A Virtuos Studio) Business Overview
Table 107. Black Shamrock (A Virtuos Studio) Game Art Design Service Product
Table 108. Black Shamrock (A Virtuos Studio) Revenue in Game Art Design Service Business (US$ Million), 2021–2026
Table 109. Black Shamrock (A Virtuos Studio) Recent Development
Table 110. Dekogon Studios Company Details
Table 111. Dekogon Studios Business Overview
Table 112. Dekogon Studios Game Art Design Service Product
Table 113. Dekogon Studios Revenue in Game Art Design Service Business (US$ Million), 2021–2026
Table 114. Dekogon Studios Recent Development
Table 115. 3Lateral (Epic Games) Company Details
Table 116. 3Lateral (Epic Games) Business Overview
Table 117. 3Lateral (Epic Games) Game Art Design Service Product
Table 118. 3Lateral (Epic Games) Revenue in Game Art Design Service Business (US$ Million), 2021–2026
Table 119. 3Lateral (Epic Games) Recent Development
Table 120. Lemon Sky Studios Company Details
Table 121. Lemon Sky Studios Business Overview
Table 122. Lemon Sky Studios Game Art Design Service Product
Table 123. Lemon Sky Studios Revenue in Game Art Design Service Business (US$ Million), 2021–2026
Table 124. Lemon Sky Studios Recent Development
Table 125. Sunrise Animation Studios Company Details
Table 126. Sunrise Animation Studios Business Overview
Table 127. Sunrise Animation Studios Game Art Design Service Product
Table 128. Sunrise Animation Studios Revenue in Game Art Design Service Business (US$ Million), 2021–2026
Table 129. Sunrise Animation Studios Recent Development
Table 130. The Mill / Technicolor Games Company Details
Table 131. The Mill / Technicolor Games Business Overview
Table 132. The Mill / Technicolor Games Game Art Design Service Product
Table 133. The Mill / Technicolor Games Revenue in Game Art Design Service Business (US$ Million), 2021–2026
Table 134. The Mill / Technicolor Games Recent Development
Table 135. Research Programs/Design for This Report
Table 136. Key Data Information from Secondary Sources
Table 137. Key Data Information from Primary Sources
Table 138. Authors List of This Report
List of Figures
Figure 1. Game Art Design Service Picture
Figure 2. Global Game Art Design Service Market Size Comparison by Type (US$ Million), 2021–2032
Figure 3. Global Game Art Design Service Market Share by Type: 2025 vs 2032
Figure 4. Concept Art Design Features
Figure 5. 2D Character And Environment Design Features
Figure 6. 3D Modeling And Asset Creation Features
Figure 7. Animation And Visual Effects Design Features
Figure 8. Others Features
Figure 9. Global Game Art Design Service Market Size Comparison by Technical (US$ Million), 2021–2032
Figure 10. Hand-Drawn Digital Illustration Features
Figure 11. Real-Time 3D Rendering Production Features
Figure 12. Motion Capture Assisted Animation Features
Figure 13. Procedural Art and AI-Generated Content Features
Figure 14. Others Features
Figure 15. Global Game Art Design Service Market Size Comparison by Service Delivery Model (US$ Million), 2021–2032
Figure 16. Full-Cycle Outsourced Art Production Features
Figure 17. Dedicated Team Augmentation Services Features
Figure 18. On-Demand Production Services Features
Figure 19. Others Features
Figure 20. Global Game Art Design Service Market Size by Application (US$ Million), 2021–2032
Figure 21. Global Game Art Design Service Market Share by Application: 2025 vs 2032
Figure 22. Mobile Game Case Studies
Figure 23. Console Game Case Studies
Figure 24. PC Game Case Studies
Figure 25. Game Art Design Service Report Years Considered
Figure 26. Global Game Art Design Service Market Size (US$ Million), Year-over-Year: 2021–2032
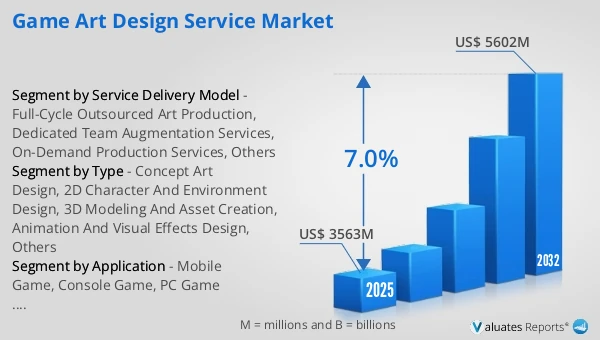
Figure 27. Global Game Art Design Service Market Size, (US$ Million), 2021 vs 2025 vs 2032
Figure 28. Global Game Art Design Service Market Share by Region: 2025 vs 2032
Figure 29. Global Game Art Design Service Market Share by Players in 2025
Figure 30. Global Game Art Design Service Market Share by Company Type (Tier 1, Tier 2, and Tier 3)
Figure 31. The Top 10 and 5 Players Market Share by Game Art Design Service Revenue in 2025
Figure 32. North America Game Art Design Service Market Size YoY Growth (US$ Million), 2021–2032
Figure 33. North America Game Art Design Service Market Share by Country (2021–2032)
Figure 34. United States Game Art Design Service Market Size YoY Growth (US$ Million), 2021–2032
Figure 35. Canada Game Art Design Service Market Size YoY Growth (US$ Million), 2021–2032
Figure 36. Europe Game Art Design Service Market Size YoY Growth (US$ Million), 2021–2032
Figure 37. Europe Game Art Design Service Market Share by Country (2021–2032)
Figure 38. Germany Game Art Design Service Market Size YoY Growth (US$ Million), 2021–2032
Figure 39. France Game Art Design Service Market Size YoY Growth (US$ Million), 2021–2032
Figure 40. U.K. Game Art Design Service Market Size YoY Growth (US$ Million), 2021–2032
Figure 41. Italy Game Art Design Service Market Size YoY Growth (US$ Million), 2021–2032
Figure 42. Russia Game Art Design Service Market Size YoY Growth (US$ Million), 2021–2032
Figure 43. Ireland Game Art Design Service Market Size YoY Growth (US$ Million), 2021–2032
Figure 44. Asia-Pacific Game Art Design Service Market Size YoY Growth (US$ Million), 2021–2032
Figure 45. Asia-Pacific Game Art Design Service Market Share by Region (2021–2032)
Figure 46. China Game Art Design Service Market Size YoY Growth (US$ Million), 2021–2032
Figure 47. Japan Game Art Design Service Market Size YoY Growth (US$ Million), 2021–2032
Figure 48. South Korea Game Art Design Service Market Size YoY Growth (US$ Million), 2021–2032
Figure 49. Southeast Asia Game Art Design Service Market Size YoY Growth (US$ Million), 2021–2032
Figure 50. India Game Art Design Service Market Size YoY Growth (US$ Million), 2021–2032
Figure 51. Australia & New Zealand Game Art Design Service Market Size YoY Growth (US$ Million), 2021–2032
Figure 52. Latin America Game Art Design Service Market Size YoY Growth (US$ Million), 2021–2032
Figure 53. Latin America Game Art Design Service Market Share by Country (2021–2032)
Figure 54. Mexico Game Art Design Service Market Size YoY Growth (US$ Million), 2021–2032
Figure 55. Brazil Game Art Design Service Market Size YoY Growth (US$ Million), 2021–2032
Figure 56. Middle East & Africa Game Art Design Service Market Size YoY Growth (US$ Million), 2021–2032
Figure 57. Middle East & Africa Game Art Design Service Market Share by Country (2021–2032)
Figure 58. Israel Game Art Design Service Market Size YoY Growth (US$ Million), 2021–2032
Figure 59. Saudi Arabia Game Art Design Service Market Size YoY Growth (US$ Million), 2021–2032
Figure 60. UAE Game Art Design Service Market Size YoY Growth (US$ Million), 2021–2032
Figure 61. Virtuos Revenue Growth Rate in Game Art Design Service Business (2021–2026)
Figure 62. Keywords Studios (Lakshya) Revenue Growth Rate in Game Art Design Service Business (2021–2026)
Figure 63. Tencent Games Revenue Growth Rate in Game Art Design Service Business (2021–2026)
Figure 64. NetEase ThunderFire / GameArt Outsourcing Revenue Growth Rate in Game Art Design Service Business (2021–2026)
Figure 65. ArtStation Studios / Community Professionals Revenue Growth Rate in Game Art Design Service Business (2021–2026)
Figure 66. Room 8 Studio Revenue Growth Rate in Game Art Design Service Business (2021–2026)
Figure 67. Sperasoft (A Keyword Studio) Revenue Growth Rate in Game Art Design Service Business (2021–2026)
Figure 68. iLogos Game Studios Revenue Growth Rate in Game Art Design Service Business (2021–2026)
Figure 69. Glass Egg (A Virtuos Studio) Revenue Growth Rate in Game Art Design Service Business (2021–2026)
Figure 70. Black Shamrock (A Virtuos Studio) Revenue Growth Rate in Game Art Design Service Business (2021–2026)
Figure 71. Dekogon Studios Revenue Growth Rate in Game Art Design Service Business (2021–2026)
Figure 72. 3Lateral (Epic Games) Revenue Growth Rate in Game Art Design Service Business (2021–2026)
Figure 73. Lemon Sky Studios Revenue Growth Rate in Game Art Design Service Business (2021–2026)
Figure 74. Sunrise Animation Studios Revenue Growth Rate in Game Art Design Service Business (2021–2026)
Figure 75. The Mill / Technicolor Games Revenue Growth Rate in Game Art Design Service Business (2021–2026)
Figure 76. Bottom-up and Top-down Approaches for This Report
Figure 77. Data Triangulation
Figure 78. Key Executives Interviewed