0
U.S. (TOLL FREE)
+1 (315) 215-3225
Automative

0
U.S. (TOLL FREE)
+1 (315) 215-3225
Artificial Intelligence for Edge Devices - Global Market Share and Ranking, Overall Sales and Demand Forecast 2024-2030
Published Date: April 2024
|
Report Code: QYRE-Auto-4V9337
Home | Market Reports | Computers & Electronics
Global Artificial Intelligence for Edge Devices Market Size Status and Forecast 2022
BUY CHAPTERS

Artificial Intelligence for Edge Devices - Global Market Share and Ranking, Overall Sales and Demand Forecast 2024-2030

Code: QYRE-Auto-4V9337
Report
April 2024
Pages:113
QYResearch
Buy Now with 15% Discount
DESCRIPTION
TABLE OF CONTENT
TABLES & FIGURES

Artificial Intelligence for Edge Devices - Market Size

The global market for Artificial Intelligence for Edge Devices was estimated to be worth US$ 3121 million in 2023 and is forecast to a readjusted size of US$ 16840 million by 2030 with a CAGR of 26.9% during the forecast period 2024-2030

Artificial Intelligence for Edge Devices - Market

Artificial Intelligence for Edge Devices - Market

Artificial intelligence (AI) processing today is mostly done in a cloud-based data center. The majority of AI processing is dominated by training of deep learning models, which requires heavy compute capacity. Artificial intelligence for edge devices means that AI software algorithms are processed locally on a hardware device. The algorithms are using data (sensor data or signals) that are created on the device. A device using Edge AI software does not need to be connected in order to work properly, it can process data and take decisions independently without a connection. In this report, artificial intelligence for edge devices contains software tools, platforms, artificial intelligence chip.
Global Artificial Intelligence for Edge Devices key players include Microsoft, Qualcomm, Intel, Google, Alibaba, etc. Global top five manufacturers hold a share over 50%.
North America is the largest market, with a share about 45%, followed by Europe and China, both have a share over 30 percent.
In terms of product, Hardware is the largest segment, with a share about 70%. And in terms of application, the largest application is Mobile Phones, followed by Smart Speakers.

Report Scope

This report aims to provide a comprehensive presentation of the global market for Artificial Intelligence for Edge Devices, focusing on the total sales revenue, key companies market share and ranking, together with an analysis of Artificial Intelligence for Edge Devices by region & country, by Type, and by Application.
The Artificial Intelligence for Edge Devices market size, estimations, and forecasts are provided in terms of sales revenue ($ millions), considering 2023 as the base year, with history and forecast data for the period from 2019 to 2030. With both quantitative and qualitative analysis, to help readers develop business/growth strategies, assess the market competitive situation, analyze their position in the current marketplace, and make informed business decisions regarding Artificial Intelligence for Edge Devices.
Market Segmentation

Scope of Artificial Intelligence for Edge Devices - Market Report

Report Metric Details
Report Name Artificial Intelligence for Edge Devices - Market
Forecasted market size in 2030 US$ 16840 million
CAGR 26.9%
Forecasted years 2024 - 2030
Segment by Type:
  • Hardware
  • Software
Segment by Application
  • Automotive
  • Consumer and Enterprise Robotics
  • Drones
  • Head-Mounted Displays
  • Smart Speakers
  • Security Cameras
By Region
  • North America (United States, Canada)
  • Europe (Germany, France, UK, Italy, Russia) Rest of Europe
  • Nordic Countries
  • Asia-Pacific (China, Japan, South Korea)
  • Southeast Asia (India, Australia)
  • Rest of Asia
  • Latin America (Mexico, Brazil)
  • Rest of Latin America
  • Middle East & Africa (Turkey, Saudi Arabia, UAE, Rest of MEA)
By Company Microsoft, Qualcomm, Intel, Google, Alibaba, NVIDIA, Arm, Horizon Robotics, Baidu, Synopsys, Cambricon, MediaTek, Mythic, NXP
Forecast units USD million in value
Report coverage Revenue and volume forecast, company share, competitive landscape, growth factors and trends

Chapter Outline

  • Chapter 1: Introduces the report scope of the report, global total market size. This chapter also provides the market dynamics, latest developments of the market, the driving factors and restrictive factors of the market, the challenges and risks faced by manufacturers in the industry, and the analysis of relevant policies in the industry.
  • Chapter 2: Detailed analysis of Artificial Intelligence for Edge Devices manufacturers competitive landscape, revenue market share, latest development plan, merger, and acquisition information, etc.
  • Chapter 3: Provides the analysis of various market segments by Type, covering the market size and development potential of each market segment, to help readers find the blue ocean market in different market segments.
  • Chapter 4: Provides the analysis of various market segments by Application, covering the market size and development potential of each market segment, to help readers find the blue ocean market in different downstream markets.
  • Chapter 5: Revenue of Artificial Intelligence for Edge Devices in regional level. It provides a quantitative analysis of the market size and development potential of each region and introduces the market development, future development prospects, market space, and market size of each country in the world.
  • Chapter 6: Revenue of Artificial Intelligence for Edge Devices in country level. It provides sigmate data by Type, and by Application for each country/region.
  • Chapter 7: Provides profiles of key players, introducing the basic situation of the main companies in the market in detail, including product revenue, gross margin, product introduction, recent development, etc.
  • Chapter 8: Analysis of industrial chain, including the upstream and downstream of the industry.
  • Chapter 9: Conclusion.

FAQ for this report

What is the Artificial Intelligence for Edge Devices - Market size in 2030?

Ans: The Artificial Intelligence for Edge Devices - Market size in 2030 will be US$ 16840 million.

What is the market share of major companies in Artificial Intelligence for Edge Devices - Market?

Ans: Global top five manufacturers hold a share over 50%.

What is the Artificial Intelligence for Edge Devices - Market share by type?

Ans: In terms of product, Hardware is the largest segment, with a share about 70%.

Who are the main players in the Artificial Intelligence for Edge Devices - Market report?

Ans: The main players in the Artificial Intelligence for Edge Devices - Market are Microsoft, Qualcomm, Intel, Google, Alibaba, NVIDIA, Arm, Horizon Robotics, Baidu, Synopsys, Cambricon, MediaTek, Mythic, NXP

What are the Application segmentation covered in the Artificial Intelligence for Edge Devices - Market report?

Ans: The Applications covered in the Artificial Intelligence for Edge Devices - Market report are Automotive, Consumer and Enterprise Robotics, Drones, Head-Mounted Displays, Smart Speakers, Security Cameras

What are the Type segmentation covered in the Artificial Intelligence for Edge Devices - Market report?

Ans: The Types covered in the Artificial Intelligence for Edge Devices - Market report are Hardware, Software

1 Market Overview
1.1 Artificial Intelligence for Edge Devices Product Introduction
1.2 Global Artificial Intelligence for Edge Devices Market Size Forecast
1.3 Artificial Intelligence for Edge Devices Market Trends & Drivers
1.3.1 Artificial Intelligence for Edge Devices Industry Trends
1.3.2 Artificial Intelligence for Edge Devices Market Drivers & Opportunity
1.3.3 Artificial Intelligence for Edge Devices Market Challenges
1.3.4 Artificial Intelligence for Edge Devices Market Restraints
1.4 Assumptions and Limitations
1.5 Study Objectives
1.6 Years Considered
2 Competitive Analysis by Company
2.1 Global Artificial Intelligence for Edge Devices Players Revenue Ranking (2023)
2.2 Global Artificial Intelligence for Edge Devices Revenue by Company (2019-2024)
2.3 Key Companies Artificial Intelligence for Edge Devices Manufacturing Base Distribution and Headquarters
2.4 Key Companies Artificial Intelligence for Edge Devices Product Offered
2.5 Key Companies Time to Begin Mass Production of Artificial Intelligence for Edge Devices
2.6 Artificial Intelligence for Edge Devices Market Competitive Analysis
2.6.1 Artificial Intelligence for Edge Devices Market Concentration Rate (2019-2024)
2.6.2 Global 5 and 10 Largest Companies by Artificial Intelligence for Edge Devices Revenue in 2023
2.6.3 Global Top Companies by Company Type (Tier 1, Tier 2, and Tier 3) & (based on the Revenue in Artificial Intelligence for Edge Devices as of 2023)
2.7 Mergers & Acquisitions, Expansion
3 Segmentation by Type
3.1 Introduction by Type
3.1.1 Hardware
3.1.2 Software
3.2 Global Artificial Intelligence for Edge Devices Sales Value by Type
3.2.1 Global Artificial Intelligence for Edge Devices Sales Value by Type (2019 VS 2023 VS 2030)
3.2.2 Global Artificial Intelligence for Edge Devices Sales Value, by Type (2019-2030)
3.2.3 Global Artificial Intelligence for Edge Devices Sales Value, by Type (%) (2019-2030)
4 Segmentation by Application
4.1 Introduction by Application
4.1.1 Automotive
4.1.2 Consumer and Enterprise Robotics
4.1.3 Drones
4.1.4 Head-Mounted Displays
4.1.5 Smart Speakers
4.1.6 Security Cameras
4.2 Global Artificial Intelligence for Edge Devices Sales Value by Application
4.2.1 Global Artificial Intelligence for Edge Devices Sales Value by Application (2019 VS 2023 VS 2030)
4.2.2 Global Artificial Intelligence for Edge Devices Sales Value, by Application (2019-2030)
4.2.3 Global Artificial Intelligence for Edge Devices Sales Value, by Application (%) (2019-2030)
5 Segmentation by Region
5.1 Global Artificial Intelligence for Edge Devices Sales Value by Region
5.1.1 Global Artificial Intelligence for Edge Devices Sales Value by Region: 2019 VS 2023 VS 2030
5.1.2 Global Artificial Intelligence for Edge Devices Sales Value by Region (2019-2024)
5.1.3 Global Artificial Intelligence for Edge Devices Sales Value by Region (2025-2030)
5.1.4 Global Artificial Intelligence for Edge Devices Sales Value by Region (%), (2019-2030)
5.2 North America
5.2.1 North America Artificial Intelligence for Edge Devices Sales Value, 2019-2030
5.2.2 North America Artificial Intelligence for Edge Devices Sales Value by Country (%), 2023 VS 2030
5.3 Europe
5.3.1 Europe Artificial Intelligence for Edge Devices Sales Value, 2019-2030
5.3.2 Europe Artificial Intelligence for Edge Devices Sales Value by Country (%), 2023 VS 2030
5.4 Asia Pacific
5.4.1 Asia Pacific Artificial Intelligence for Edge Devices Sales Value, 2019-2030
5.4.2 Asia Pacific Artificial Intelligence for Edge Devices Sales Value by Country (%), 2023 VS 2030
5.5 South America
5.5.1 South America Artificial Intelligence for Edge Devices Sales Value, 2019-2030
5.5.2 South America Artificial Intelligence for Edge Devices Sales Value by Country (%), 2023 VS 2030
5.6 Middle East & Africa
5.6.1 Middle East & Africa Artificial Intelligence for Edge Devices Sales Value, 2019-2030
5.6.2 Middle East & Africa Artificial Intelligence for Edge Devices Sales Value by Country (%), 2023 VS 2030
6 Segmentation by Key Countries/Regions
6.1 Key Countries/Regions Artificial Intelligence for Edge Devices Sales Value Growth Trends, 2019 VS 2023 VS 2030
6.2 Key Countries/Regions Artificial Intelligence for Edge Devices Sales Value
6.3 United States
6.3.1 United States Artificial Intelligence for Edge Devices Sales Value, 2019-2030
6.3.2 United States Artificial Intelligence for Edge Devices Sales Value by Type (%), 2023 VS 2030
6.3.3 United States Artificial Intelligence for Edge Devices Sales Value by Application, 2023 VS 2030
6.4 Europe
6.4.1 Europe Artificial Intelligence for Edge Devices Sales Value, 2019-2030
6.4.2 Europe Artificial Intelligence for Edge Devices Sales Value by Type (%), 2023 VS 2030
6.4.3 Europe Artificial Intelligence for Edge Devices Sales Value by Application, 2023 VS 2030
6.5 China
6.5.1 China Artificial Intelligence for Edge Devices Sales Value, 2019-2030
6.5.2 China Artificial Intelligence for Edge Devices Sales Value by Type (%), 2023 VS 2030
6.5.3 China Artificial Intelligence for Edge Devices Sales Value by Application, 2023 VS 2030
6.6 Japan
6.6.1 Japan Artificial Intelligence for Edge Devices Sales Value, 2019-2030
6.6.2 Japan Artificial Intelligence for Edge Devices Sales Value by Type (%), 2023 VS 2030
6.6.3 Japan Artificial Intelligence for Edge Devices Sales Value by Application, 2023 VS 2030
6.7 South Korea
6.7.1 South Korea Artificial Intelligence for Edge Devices Sales Value, 2019-2030
6.7.2 South Korea Artificial Intelligence for Edge Devices Sales Value by Type (%), 2023 VS 2030
6.7.3 South Korea Artificial Intelligence for Edge Devices Sales Value by Application, 2023 VS 2030
6.8 Southeast Asia
6.8.1 Southeast Asia Artificial Intelligence for Edge Devices Sales Value, 2019-2030
6.8.2 Southeast Asia Artificial Intelligence for Edge Devices Sales Value by Type (%), 2023 VS 2030
6.8.3 Southeast Asia Artificial Intelligence for Edge Devices Sales Value by Application, 2023 VS 2030
6.9 India
6.9.1 India Artificial Intelligence for Edge Devices Sales Value, 2019-2030
6.9.2 India Artificial Intelligence for Edge Devices Sales Value by Type (%), 2023 VS 2030
6.9.3 India Artificial Intelligence for Edge Devices Sales Value by Application, 2023 VS 2030
7 Company Profiles
7.1 Microsoft
7.1.1 Microsoft Profile
7.1.2 Microsoft Main Business
7.1.3 Microsoft Artificial Intelligence for Edge Devices Products, Services and Solutions
7.1.4 Microsoft Artificial Intelligence for Edge Devices Revenue (US$ Million) & (2019-2024)
7.1.5 Microsoft Recent Developments
7.2 Qualcomm
7.2.1 Qualcomm Profile
7.2.2 Qualcomm Main Business
7.2.3 Qualcomm Artificial Intelligence for Edge Devices Products, Services and Solutions
7.2.4 Qualcomm Artificial Intelligence for Edge Devices Revenue (US$ Million) & (2019-2024)
7.2.5 Qualcomm Recent Developments
7.3 Intel
7.3.1 Intel Profile
7.3.2 Intel Main Business
7.3.3 Intel Artificial Intelligence for Edge Devices Products, Services and Solutions
7.3.4 Intel Artificial Intelligence for Edge Devices Revenue (US$ Million) & (2019-2024)
7.3.5 Google Recent Developments
7.4 Google
7.4.1 Google Profile
7.4.2 Google Main Business
7.4.3 Google Artificial Intelligence for Edge Devices Products, Services and Solutions
7.4.4 Google Artificial Intelligence for Edge Devices Revenue (US$ Million) & (2019-2024)
7.4.5 Google Recent Developments
7.5 Alibaba
7.5.1 Alibaba Profile
7.5.2 Alibaba Main Business
7.5.3 Alibaba Artificial Intelligence for Edge Devices Products, Services and Solutions
7.5.4 Alibaba Artificial Intelligence for Edge Devices Revenue (US$ Million) & (2019-2024)
7.5.5 Alibaba Recent Developments
7.6 NVIDIA
7.6.1 NVIDIA Profile
7.6.2 NVIDIA Main Business
7.6.3 NVIDIA Artificial Intelligence for Edge Devices Products, Services and Solutions
7.6.4 NVIDIA Artificial Intelligence for Edge Devices Revenue (US$ Million) & (2019-2024)
7.6.5 NVIDIA Recent Developments
7.7 Arm
7.7.1 Arm Profile
7.7.2 Arm Main Business
7.7.3 Arm Artificial Intelligence for Edge Devices Products, Services and Solutions
7.7.4 Arm Artificial Intelligence for Edge Devices Revenue (US$ Million) & (2019-2024)
7.7.5 Arm Recent Developments
7.8 Horizon Robotics
7.8.1 Horizon Robotics Profile
7.8.2 Horizon Robotics Main Business
7.8.3 Horizon Robotics Artificial Intelligence for Edge Devices Products, Services and Solutions
7.8.4 Horizon Robotics Artificial Intelligence for Edge Devices Revenue (US$ Million) & (2019-2024)
7.8.5 Horizon Robotics Recent Developments
7.9 Baidu
7.9.1 Baidu Profile
7.9.2 Baidu Main Business
7.9.3 Baidu Artificial Intelligence for Edge Devices Products, Services and Solutions
7.9.4 Baidu Artificial Intelligence for Edge Devices Revenue (US$ Million) & (2019-2024)
7.9.5 Baidu Recent Developments
7.10 Synopsys
7.10.1 Synopsys Profile
7.10.2 Synopsys Main Business
7.10.3 Synopsys Artificial Intelligence for Edge Devices Products, Services and Solutions
7.10.4 Synopsys Artificial Intelligence for Edge Devices Revenue (US$ Million) & (2019-2024)
7.10.5 Synopsys Recent Developments
7.11 Cambricon
7.11.1 Cambricon Profile
7.11.2 Cambricon Main Business
7.11.3 Cambricon Artificial Intelligence for Edge Devices Products, Services and Solutions
7.11.4 Cambricon Artificial Intelligence for Edge Devices Revenue (US$ Million) & (2019-2024)
7.11.5 Cambricon Recent Developments
7.12 MediaTek
7.12.1 MediaTek Profile
7.12.2 MediaTek Main Business
7.12.3 MediaTek Artificial Intelligence for Edge Devices Products, Services and Solutions
7.12.4 MediaTek Artificial Intelligence for Edge Devices Revenue (US$ Million) & (2019-2024)
7.12.5 MediaTek Recent Developments
7.13 Mythic
7.13.1 Mythic Profile
7.13.2 Mythic Main Business
7.13.3 Mythic Artificial Intelligence for Edge Devices Products, Services and Solutions
7.13.4 Mythic Artificial Intelligence for Edge Devices Revenue (US$ Million) & (2019-2024)
7.13.5 Mythic Recent Developments
7.14 NXP
7.14.1 NXP Profile
7.14.2 NXP Main Business
7.14.3 NXP Artificial Intelligence for Edge Devices Products, Services and Solutions
7.14.4 NXP Artificial Intelligence for Edge Devices Revenue (US$ Million) & (2019-2024)
7.14.5 NXP Recent Developments
8 Industry Chain Analysis
8.1 Artificial Intelligence for Edge Devices Industrial Chain
8.2 Artificial Intelligence for Edge Devices Upstream Analysis
8.2.1 Key Raw Materials
8.2.2 Raw Materials Key Suppliers
8.2.3 Manufacturing Cost Structure
8.3 Midstream Analysis
8.4 Downstream Analysis (Customers Analysis)
8.5 Sales Model and Sales Channels
8.5.1 Artificial Intelligence for Edge Devices Sales Model
8.5.2 Sales Channel
8.5.3 Artificial Intelligence for Edge Devices Distributors
9 Research Findings and Conclusion
10 Appendix
10.1 Research Methodology
10.1.1 Methodology/Research Approach
10.1.2 Data Source
10.2 Author Details
10.3 Disclaimer
List of Tables
    Table 1. Artificial Intelligence for Edge Devices Market Trends
    Table 2. Artificial Intelligence for Edge Devices Market Drivers & Opportunity
    Table 3. Artificial Intelligence for Edge Devices Market Challenges
    Table 4. Artificial Intelligence for Edge Devices Market Restraints
    Table 5. Global Artificial Intelligence for Edge Devices Revenue by Company (2019-2024) & (US$ Million)
    Table 6. Global Artificial Intelligence for Edge Devices Revenue Market Share by Company (2019-2024)
    Table 7. Key Companies Artificial Intelligence for Edge Devices Manufacturing Base Distribution and Headquarters
    Table 8. Key Companies Artificial Intelligence for Edge Devices Product Type
    Table 9. Key Companies Time to Begin Mass Production of Artificial Intelligence for Edge Devices
    Table 10. Global Artificial Intelligence for Edge Devices Companies Market Concentration Ratio (CR5 and HHI)
    Table 11. Global Top Companies Market Share by Company Type (Tier 1, Tier 2, and Tier 3) & (based on the Revenue in Artificial Intelligence for Edge Devices as of 2023)
    Table 12. Mergers & Acquisitions, Expansion Plans
    Table 13. Global Artificial Intelligence for Edge Devices Sales Value by Type: 2019 VS 2023 VS 2030 (US$ Million)
    Table 14. Global Artificial Intelligence for Edge Devices Sales Value by Type (2019-2024) & (US$ Million)
    Table 15. Global Artificial Intelligence for Edge Devices Sales Value by Type (2025-2030) & (US$ Million)
    Table 16. Global Artificial Intelligence for Edge Devices Sales Market Share in Value by Type (2019-2024) & (%)
    Table 17. Global Artificial Intelligence for Edge Devices Sales Market Share in Value by Type (2025-2030) & (%)
    Table 18. Global Artificial Intelligence for Edge Devices Sales Value by Application: 2019 VS 2023 VS 2030 (US$ Million)
    Table 19. Global Artificial Intelligence for Edge Devices Sales Value by Application (2019-2024) & (US$ Million)
    Table 20. Global Artificial Intelligence for Edge Devices Sales Value by Application (2025-2030) & (US$ Million)
    Table 21. Global Artificial Intelligence for Edge Devices Sales Market Share in Value by Application (2019-2024) & (%)
    Table 22. Global Artificial Intelligence for Edge Devices Sales Market Share in Value by Application (2025-2030) & (%)
    Table 23. Global Artificial Intelligence for Edge Devices Sales Value by Region: 2019 VS 2023 VS 2030 (US$ Million)
    Table 24. Global Artificial Intelligence for Edge Devices Sales Value by Region (2019-2024) & (US$ Million)
    Table 25. Global Artificial Intelligence for Edge Devices Sales Value by Region (2025-2030) & (US$ Million)
    Table 26. Global Artificial Intelligence for Edge Devices Sales Value by Region (2019-2024) & (%)
    Table 27. Global Artificial Intelligence for Edge Devices Sales Value by Region (2025-2030) & (%)
    Table 28. Key Countries/Regions Artificial Intelligence for Edge Devices Sales Value Growth Trends, (US$ Million): 2019 VS 2023 VS 2030
    Table 29. Key Countries/Regions Artificial Intelligence for Edge Devices Sales Value, (2019-2024) & (US$ Million)
    Table 30. Key Countries/Regions Artificial Intelligence for Edge Devices Sales Value, (2025-2030) & (US$ Million)
    Table 31. Microsoft Basic Information List
    Table 32. Microsoft Description and Business Overview
    Table 33. Microsoft Artificial Intelligence for Edge Devices Products, Services and Solutions
    Table 34. Revenue (US$ Million) in Artificial Intelligence for Edge Devices Business of Microsoft (2019-2024)
    Table 35. Microsoft Recent Developments
    Table 36. Qualcomm Basic Information List
    Table 37. Qualcomm Description and Business Overview
    Table 38. Qualcomm Artificial Intelligence for Edge Devices Products, Services and Solutions
    Table 39. Revenue (US$ Million) in Artificial Intelligence for Edge Devices Business of Qualcomm (2019-2024)
    Table 40. Qualcomm Recent Developments
    Table 41. Intel Basic Information List
    Table 42. Intel Description and Business Overview
    Table 43. Intel Artificial Intelligence for Edge Devices Products, Services and Solutions
    Table 44. Revenue (US$ Million) in Artificial Intelligence for Edge Devices Business of Intel (2019-2024)
    Table 45. Intel Recent Developments
    Table 46. Google Basic Information List
    Table 47. Google Description and Business Overview
    Table 48. Google Artificial Intelligence for Edge Devices Products, Services and Solutions
    Table 49. Revenue (US$ Million) in Artificial Intelligence for Edge Devices Business of Google (2019-2024)
    Table 50. Google Recent Developments
    Table 51. Alibaba Basic Information List
    Table 52. Alibaba Description and Business Overview
    Table 53. Alibaba Artificial Intelligence for Edge Devices Products, Services and Solutions
    Table 54. Revenue (US$ Million) in Artificial Intelligence for Edge Devices Business of Alibaba (2019-2024)
    Table 55. Alibaba Recent Developments
    Table 56. NVIDIA Basic Information List
    Table 57. NVIDIA Description and Business Overview
    Table 58. NVIDIA Artificial Intelligence for Edge Devices Products, Services and Solutions
    Table 59. Revenue (US$ Million) in Artificial Intelligence for Edge Devices Business of NVIDIA (2019-2024)
    Table 60. NVIDIA Recent Developments
    Table 61. Arm Basic Information List
    Table 62. Arm Description and Business Overview
    Table 63. Arm Artificial Intelligence for Edge Devices Products, Services and Solutions
    Table 64. Revenue (US$ Million) in Artificial Intelligence for Edge Devices Business of Arm (2019-2024)
    Table 65. Arm Recent Developments
    Table 66. Horizon Robotics Basic Information List
    Table 67. Horizon Robotics Description and Business Overview
    Table 68. Horizon Robotics Artificial Intelligence for Edge Devices Products, Services and Solutions
    Table 69. Revenue (US$ Million) in Artificial Intelligence for Edge Devices Business of Horizon Robotics (2019-2024)
    Table 70. Horizon Robotics Recent Developments
    Table 71. Baidu Basic Information List
    Table 72. Baidu Description and Business Overview
    Table 73. Baidu Artificial Intelligence for Edge Devices Products, Services and Solutions
    Table 74. Revenue (US$ Million) in Artificial Intelligence for Edge Devices Business of Baidu (2019-2024)
    Table 75. Baidu Recent Developments
    Table 76. Synopsys Basic Information List
    Table 77. Synopsys Description and Business Overview
    Table 78. Synopsys Artificial Intelligence for Edge Devices Products, Services and Solutions
    Table 79. Revenue (US$ Million) in Artificial Intelligence for Edge Devices Business of Synopsys (2019-2024)
    Table 80. Synopsys Recent Developments
    Table 81. Cambricon Basic Information List
    Table 82. Cambricon Description and Business Overview
    Table 83. Cambricon Artificial Intelligence for Edge Devices Products, Services and Solutions
    Table 84. Revenue (US$ Million) in Artificial Intelligence for Edge Devices Business of Cambricon (2019-2024)
    Table 85. Cambricon Recent Developments
    Table 86. MediaTek Basic Information List
    Table 87. MediaTek Description and Business Overview
    Table 88. MediaTek Artificial Intelligence for Edge Devices Products, Services and Solutions
    Table 89. Revenue (US$ Million) in Artificial Intelligence for Edge Devices Business of MediaTek (2019-2024)
    Table 90. MediaTek Recent Developments
    Table 91. Mythic Basic Information List
    Table 92. Mythic Description and Business Overview
    Table 93. Mythic Artificial Intelligence for Edge Devices Products, Services and Solutions
    Table 94. Revenue (US$ Million) in Artificial Intelligence for Edge Devices Business of Mythic (2019-2024)
    Table 95. Mythic Recent Developments
    Table 96. NXP Basic Information List
    Table 97. NXP Description and Business Overview
    Table 98. NXP Artificial Intelligence for Edge Devices Products, Services and Solutions
    Table 99. Revenue (US$ Million) in Artificial Intelligence for Edge Devices Business of NXP (2019-2024)
    Table 100. NXP Recent Developments
    Table 101. Key Raw Materials Lists
    Table 102. Raw Materials Key Suppliers Lists
    Table 103. Artificial Intelligence for Edge Devices Downstream Customers
    Table 104. Artificial Intelligence for Edge Devices Distributors List
    Table 105. Research Programs/Design for This Report
    Table 106. Key Data Information from Secondary Sources
    Table 107. Key Data Information from Primary Sources
    Table 108. Business Unit and Senior & Team Lead Analysts
List of Figures
    Figure 1. Artificial Intelligence for Edge Devices Product Picture
    Figure 2. Global Artificial Intelligence for Edge Devices Sales Value, 2019 VS 2023 VS 2030 (US$ Million)
    Figure 3. Global Artificial Intelligence for Edge Devices Sales Value (2019-2030) & (US$ Million)
    Figure 4. Artificial Intelligence for Edge Devices Report Years Considered
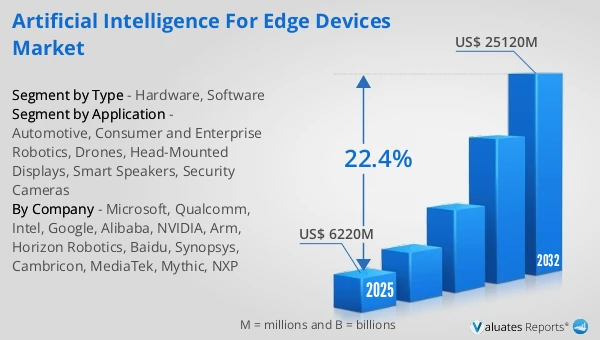
    Figure 5. Global Artificial Intelligence for Edge Devices Players Revenue Ranking (2023) & (US$ Million)
    Figure 6. The 5 and 10 Largest Manufacturers in the World: Market Share by Artificial Intelligence for Edge Devices Revenue in 2023
    Figure 7. Artificial Intelligence for Edge Devices Market Share by Company Type (Tier 1, Tier 2, and Tier 3): 2019 VS 2023
    Figure 8. Hardware Picture
    Figure 9. Software Picture
    Figure 10. Global Artificial Intelligence for Edge Devices Sales Value by Type (2019 VS 2023 VS 2030) & (US$ Million)
    Figure 11. Global Artificial Intelligence for Edge Devices Sales Value Market Share by Type, 2023 & 2030
    Figure 12. Product Picture of Automotive
    Figure 13. Product Picture of Consumer and Enterprise Robotics
    Figure 14. Product Picture of Drones
    Figure 15. Product Picture of Head-Mounted Displays
    Figure 16. Product Picture of Smart Speakers
    Figure 17. Product Picture of Security Cameras
    Figure 18. Global Artificial Intelligence for Edge Devices Sales Value by Application (2019 VS 2023 VS 2030) & (US$ Million)
    Figure 19. Global Artificial Intelligence for Edge Devices Sales Value Market Share by Application, 2023 & 2030
    Figure 20. North America Artificial Intelligence for Edge Devices Sales Value (2019-2030) & (US$ Million)
    Figure 21. North America Artificial Intelligence for Edge Devices Sales Value by Country (%), 2023 VS 2030
    Figure 22. Europe Artificial Intelligence for Edge Devices Sales Value (2019-2030) & (US$ Million)
    Figure 23. Europe Artificial Intelligence for Edge Devices Sales Value by Country (%), 2023 VS 2030
    Figure 24. Asia Pacific Artificial Intelligence for Edge Devices Sales Value (2019-2030) & (US$ Million)
    Figure 25. Asia Pacific Artificial Intelligence for Edge Devices Sales Value by Country (%), 2023 VS 2030
    Figure 26. South America Artificial Intelligence for Edge Devices Sales Value (2019-2030) & (US$ Million)
    Figure 27. South America Artificial Intelligence for Edge Devices Sales Value by Country (%), 2023 VS 2030
    Figure 28. Middle East & Africa Artificial Intelligence for Edge Devices Sales Value (2019-2030) & (US$ Million)
    Figure 29. Middle East & Africa Artificial Intelligence for Edge Devices Sales Value by Country (%), 2023 VS 2030
    Figure 30. Key Countries/Regions Artificial Intelligence for Edge Devices Sales Value (%), (2019-2030)
    Figure 31. United States Artificial Intelligence for Edge Devices Sales Value, (2019-2030) & (US$ Million)
    Figure 32. United States Artificial Intelligence for Edge Devices Sales Value by Type (%), 2023 VS 2030
    Figure 33. United States Artificial Intelligence for Edge Devices Sales Value by Application (%), 2023 VS 2030
    Figure 34. Europe Artificial Intelligence for Edge Devices Sales Value, (2019-2030) & (US$ Million)
    Figure 35. Europe Artificial Intelligence for Edge Devices Sales Value by Type (%), 2023 VS 2030
    Figure 36. Europe Artificial Intelligence for Edge Devices Sales Value by Application (%), 2023 VS 2030
    Figure 37. China Artificial Intelligence for Edge Devices Sales Value, (2019-2030) & (US$ Million)
    Figure 38. China Artificial Intelligence for Edge Devices Sales Value by Type (%), 2023 VS 2030
    Figure 39. China Artificial Intelligence for Edge Devices Sales Value by Application (%), 2023 VS 2030
    Figure 40. Japan Artificial Intelligence for Edge Devices Sales Value, (2019-2030) & (US$ Million)
    Figure 41. Japan Artificial Intelligence for Edge Devices Sales Value by Type (%), 2023 VS 2030
    Figure 42. Japan Artificial Intelligence for Edge Devices Sales Value by Application (%), 2023 VS 2030
    Figure 43. South Korea Artificial Intelligence for Edge Devices Sales Value, (2019-2030) & (US$ Million)
    Figure 44. South Korea Artificial Intelligence for Edge Devices Sales Value by Type (%), 2023 VS 2030
    Figure 45. South Korea Artificial Intelligence for Edge Devices Sales Value by Application (%), 2023 VS 2030
    Figure 46. Southeast Asia Artificial Intelligence for Edge Devices Sales Value, (2019-2030) & (US$ Million)
    Figure 47. Southeast Asia Artificial Intelligence for Edge Devices Sales Value by Type (%), 2023 VS 2030
    Figure 48. Southeast Asia Artificial Intelligence for Edge Devices Sales Value by Application (%), 2023 VS 2030
    Figure 49. India Artificial Intelligence for Edge Devices Sales Value, (2019-2030) & (US$ Million)
    Figure 50. India Artificial Intelligence for Edge Devices Sales Value by Type (%), 2023 VS 2030
    Figure 51. India Artificial Intelligence for Edge Devices Sales Value by Application (%), 2023 VS 2030
    Figure 52. Artificial Intelligence for Edge Devices Industrial Chain
    Figure 53. Artificial Intelligence for Edge Devices Manufacturing Cost Structure
    Figure 54. Channels of Distribution (Direct Sales, and Distribution)
    Figure 55. Bottom-up and Top-down Approaches for This Report
    Figure 56. Data Triangulation
SELECT A FORMAT
Added to Cart
Electronic (PDF)

$3950

This license allows only one user to access the PDF.
Electronic (PDF)

$5925

This license allows 1 - 5 user to access the PDF, license is suitable for small groups of 5 users working together
Electronic (PDF)

$7900

This license allows users/teams in a same Enterprise to use this report, various departments within an enterpise can use this report
Add to Cart
Buy Now (15% Discount)

OUR CUSTOMER

Nano Dimension

SIMILAR REPORTS