FEATURED COMPANIES
Ashland Inc
Ethyl Cellulose (EC) Market Size
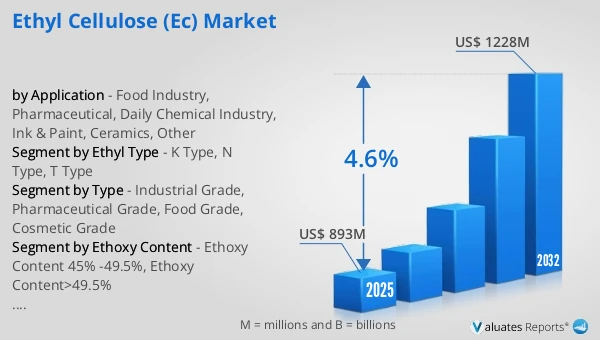
The global Ethyl Cellulose (EC) market was valued at US$ 893 million in 2025 and is anticipated to reach US$ 1228 million by 2032, at a CAGR of 4.6% from 2026 to 2032.
Ethyl Cellulose (EC) Market
The 2025 U.S. tariff policies introduce profound uncertainty into the global economic landscape. This report critically examines the implications of recent tariff adjustments and international strategic countermeasures on Ethyl Cellulose (EC) competitive dynamics, regional economic interdependencies, and supply chain reconfigurations.
Ethyl Cellulose (EC) is a white or light gray mobile powder, odorless and tasteless, with a softening point of 135-155 ℃ and a false specific gravity of 0.3-0.4. The relative density is 1.07-1.18, the melting point is 165-185 ℃, insoluble in water, soluble in various organic solvents such as ethyl acetate, benzene, toluene, acetone, methanol, ethanol, etc. Among them, the k specification has high hardness, strength, and heat resistance, the N specification has solubility and a wide range of solubility and flexibility, and the T specification is only soluble in carbon hydrogen compounds and insoluble in organic solvents containing oxygen atoms. In 2025, global Ethyl Cellulose (EC) production reached approximately 95.64 K MT, with an average global market price of around US$ 9,337 per MT.
Ethyl cellulose is a type of hydrophobic cellulose ether material, and the core driving force of market demand comes from the coating and controlled release systems in the pharmaceutical field, as well as the long-term demand for film-forming, thickening, rheological adjustment, and bonding properties in the industrial field. It is commonly used in functional applications such as controlled release and isolation film-forming in the pharmaceutical field, and is also used as a high-purity binder in the electronic material field, which can achieve relatively clean burning loss during sintering. It is suitable for high-end electronic ceramics and conductive slurry systems such as MLCC. At the same time, it is used as a film-forming and rheological modified resin in inks, coatings, and special coatings to improve moisture resistance and printing adaptability; From the perspective of the industrial landscape, ethyl cellulose belongs to a sub category that combines technical barriers and customer certification. The supply side is more inclined towards competition between a few leading enterprises and emerging manufacturers with scale capabilities. High purity and high consistency grades will receive higher premiums, and with downstream requirements for batch stability, low impurities, and traceability, product competition is shifting from simple price to quality system and application service capabilities; The constraints that need to be paid attention to at the same time are mainly the environmental compliance pressure related to solvent systems and the transmission of cost through fluctuations in raw materials. However, overall, they are driven by multiple scenarios such as pharmaceutical controlled release, electronic materials, and high-end coatings.
This report delivers a comprehensive overview of the global Ethyl Cellulose (EC) market, with both quantitative and qualitative analyses, to help readers develop growth strategies, assess the competitive landscape, evaluate their position in the current market, and make informed business decisions regarding Ethyl Cellulose (EC). The Ethyl Cellulose (EC) market size, estimates, and forecasts are provided in terms of output/shipments (Kilotons) and revenue (US$ millions), with 2025 as the base year and historical and forecast data for 2021–2032.
The report segments the global Ethyl Cellulose (EC) market comprehensively. Regional market sizes by Type, by Application, by Ethyl Type, and by company are also provided. For deeper insight, the report profiles the competitive landscape, key competitors, and their respective market rankings, and discusses technological trends and new product developments.
This report will assist Ethyl Cellulose (EC) manufacturers, new entrants, and companies across the industry value chain with information on revenues, production, and average prices for the overall market and its sub-segments, by company, by Type, by Application, and by region.
Market Segmentation
Scope of Ethyl Cellulose (EC) Market Report
| Report Metric |
Details |
| Report Name |
Ethyl Cellulose (EC) Market |
| Accounted market size in 2025 |
US$ 893 million |
| Forecasted market size in 2032 |
US$ 1228 million |
| CAGR |
4.6% |
| Base Year |
2025 |
| Forecasted years |
2026 - 2032 |
| Segment by Type |
- Industrial Grade
- Pharmaceutical Grade
- Food Grade
- Cosmetic Grade
|
| Segment by Ethyl Type |
|
| Segment by Ethoxy Content |
- Ethoxy Content 45% -49.5%
- Ethoxy Content>49.5%
|
| by Application |
- Food Industry
- Pharmaceutical
- Daily Chemical Industry
- Ink & Paint
- Ceramics
- Other
|
| Production by Region |
- North America
- Europe
- China
- Japan
|
| Consumption by Region |
- North America (United States, Canada)
- Europe (Germany, France, UK, Italy, Russia)
- Asia-Pacific (China, Japan, South Korea, Taiwan)
- Southeast Asia (India)
- Latin America (Mexico, Brazil)
|
| By Company |
Ashland, International Flavors & Fragrances Inc., MIKEM, Head Group, Tianpu Chemicals Company, Mikazone, Taian Ruitai New Material Incorporated, Huzhou Mizudahope Bioscience, LANDU, Shandong Everbright Technology Development, Shanghai Dofine Chemical, Shanghai Honest Chem |
| Forecast units |
USD million in value |
| Report coverage |
Revenue and volume forecast, company share, competitive landscape, growth factors and trends |
Chapter Outline
- Chapter 1: Defines the scope of the report and presents an executive summary of market segments (by Type, by Application, by Ethyl Type, etc.), including the size of each segment and its future growth potential. It offers a high-level view of the current market and its likely evolution in the short, medium, and long term.
- Chapter 2: Provides a detailed analysis of the competitive landscape for Ethyl Cellulose (EC) manufacturers, including prices, production, value-based market shares, latest development plans, and information on mergers and acquisitions.
- Chapter 3: Examines Ethyl Cellulose (EC) production/output and value by region and country, providing a quantitative assessment of market size and growth potential for each region over the next six years.
- Chapter 4: Analyzes Ethyl Cellulose (EC) consumption at the regional and country levels. It quantifies market size and growth potential for each region and its key countries, and outlines market development, outlook, addressable space, and national production.
- Chapter 5: Analyzes market segments by Type, covering the size and growth potential of each segment to help readers identify “blue ocean” opportunities.
- Chapter 6: Analyzes market segments by Application, covering the size and growth potential of each segment to help readers identify “blue ocean” opportunities in downstream markets.
- Chapter 7: Profiles key players, detailing the fundamentals of major companies, including product production/output, value, price, gross margin, product portfolio/introductions, and recent developments.
- Chapter 8: Reviews the industry value chain, including upstream and downstream segments.
- Chapter 9: Discusses market dynamics and recent developments, including drivers, restraints, challenges and risks for manufacturers, U.S. Tariffs and relevant policy analysis.
- Chapter 10: Summarizes the key findings and conclusions of the report.
FAQ for this report
How fast is Ethyl Cellulose (EC) Market growing?
Ans: The Ethyl Cellulose (EC) Market witnessing a CAGR of 4.6% during the forecast period 2026-2032.
What is the Ethyl Cellulose (EC) Market size in 2032?
Ans: The Ethyl Cellulose (EC) Market size in 2032 will be US$ 1228 million.
Who are the main players in the Ethyl Cellulose (EC) Market report?
Ans: The main players in the Ethyl Cellulose (EC) Market are Ashland, International Flavors & Fragrances Inc., MIKEM, Head Group, Tianpu Chemicals Company, Mikazone, Taian Ruitai New Material Incorporated, Huzhou Mizudahope Bioscience, LANDU, Shandong Everbright Technology Development, Shanghai Dofine Chemical, Shanghai Honest Chem
What are the Application segmentation covered in the Ethyl Cellulose (EC) Market report?
Ans: The Applications covered in the Ethyl Cellulose (EC) Market report are Food Industry, Pharmaceutical, Daily Chemical Industry, Ink & Paint, Ceramics, Other
What are the Type segmentation covered in the Ethyl Cellulose (EC) Market report?
Ans: The Types covered in the Ethyl Cellulose (EC) Market report are K Type, N Type, T Type

