List of Tables
Table 1. Global User Interface Services Market Size Growth Rate by Type (US$ Million), 2019 VS 2023 VS 2030
Table 2. Key Players of Web Service Interface
Table 3. Key Players of JQuery User Interface
Table 4. Key Players of Human-Machine Interface
Table 5. Key Players of Mobile Interface
Table 6. Key Players of Others
Table 7. Global User Interface Services Market Size Growth Rate by Application (US$ Million), 2019 VS 2023 VS 2030
Table 8. Global User Interface Services Market Size Growth Rate (CAGR) by Region (US$ Million): 2019 VS 2023 VS 2030
Table 9. Global User Interface Services Market Size by Region (2019-2024) & (US$ Million)
Table 10. Global User Interface Services Market Share by Region (2019-2024)
Table 11. Global User Interface Services Forecasted Market Size by Region (2025-2030) & (US$ Million)
Table 12. Global User Interface Services Market Share by Region (2025-2030)
Table 13. User Interface Services Market Trends
Table 14. User Interface Services Market Drivers
Table 15. User Interface Services Market Challenges
Table 16. User Interface Services Market Restraints
Table 17. Global User Interface Services Revenue by Players (2019-2024) & (US$ Million)
Table 18. Global User Interface Services Revenue Share by Players (2019-2024)
Table 19. Global Top User Interface Services by Company Type (Tier 1, Tier 2, and Tier 3) & (based on the Revenue in User Interface Services as of 2023)
Table 20. Global User Interface Services Industry Ranking 2022 VS 2023 VS 2024
Table 21. Global 5 Largest Players Market Share by User Interface Services Revenue (CR5 and HHI) & (2019-2024)
Table 22. Global Key Players of User Interface Services, Headquarters and Area Served
Table 23. Global Key Players of User Interface Services, Product and Application
Table 24. Global Key Players of User Interface Services, Product and Application
Table 25. Mergers & Acquisitions, Expansion Plans
Table 26. Global User Interface Services Market Size by Type (2019-2024) & (US$ Million)
Table 27. Global User Interface Services Revenue Market Share by Type (2019-2024)
Table 28. Global User Interface Services Forecasted Market Size by Type (2025-2030) & (US$ Million)
Table 29. Global User Interface Services Revenue Market Share by Type (2025-2030)
Table 30. Global User Interface Services Market Size by Application (2019-2024) & (US$ Million)
Table 31. Global User Interface Services Revenue Share by Application (2019-2024)
Table 32. Global User Interface Services Forecasted Market Size by Application (2025-2030) & (US$ Million)
Table 33. Global User Interface Services Revenue Share by Application (2025-2030)
Table 34. North America User Interface Services Market Size by Type (2019-2024) & (US$ Million)
Table 35. North America User Interface Services Market Size by Type (2025-2030) & (US$ Million)
Table 36. North America User Interface Services Market Size by Application (2019-2024) & (US$ Million)
Table 37. North America User Interface Services Market Size by Application (2025-2030) & (US$ Million)
Table 38. North America User Interface Services Growth Rate (CAGR) by Country (US$ Million): 2019 VS 2023 VS 2030
Table 39. North America User Interface Services Market Size by Country (2019-2024) & (US$ Million)
Table 40. North America User Interface Services Market Size by Country (2025-2030) & (US$ Million)
Table 41. Europe User Interface Services Market Size by Type (2019-2024) & (US$ Million)
Table 42. Europe User Interface Services Market Size by Type (2025-2030) & (US$ Million)
Table 43. Europe User Interface Services Market Size by Application (2019-2024) & (US$ Million)
Table 44. Europe User Interface Services Market Size by Application (2025-2030) & (US$ Million)
Table 45. Europe User Interface Services Growth Rate (CAGR) by Country (US$ Million): 2019 VS 2023 VS 2030
Table 46. Europe User Interface Services Market Size by Country (2019-2024) & (US$ Million)
Table 47. Europe User Interface Services Market Size by Country (2025-2030) & (US$ Million)
Table 48. China User Interface Services Market Size by Type (2019-2024) & (US$ Million)
Table 49. China User Interface Services Market Size by Type (2025-2030) & (US$ Million)
Table 50. China User Interface Services Market Size by Application (2019-2024) & (US$ Million)
Table 51. China User Interface Services Market Size by Application (2025-2030) & (US$ Million)
Table 52. Asia User Interface Services Market Size by Type (2019-2024) & (US$ Million)
Table 53. Asia User Interface Services Market Size by Type (2025-2030) & (US$ Million)
Table 54. Asia User Interface Services Market Size by Application (2019-2024) & (US$ Million)
Table 55. Asia User Interface Services Market Size by Application (2025-2030) & (US$ Million)
Table 56. Asia User Interface Services Growth Rate (CAGR) by Region (US$ Million): 2019 VS 2023 VS 2030
Table 57. Asia User Interface Services Market Size by Region (2019-2024) & (US$ Million)
Table 58. Asia User Interface Services Market Size by Region (2025-2030) & (US$ Million)
Table 59. Middle East, Africa, and Latin America User Interface Services Market Size by Type (2019-2024) & (US$ Million)
Table 60. Middle East, Africa, and Latin America User Interface Services Market Size by Type (2025-2030) & (US$ Million)
Table 61. Middle East, Africa, and Latin America User Interface Services Market Size by Application (2019-2024) & (US$ Million)
Table 62. Middle East, Africa, and Latin America User Interface Services Market Size by Application (2025-2030) & (US$ Million)
Table 63. Middle East, Africa, and Latin America User Interface Services Growth Rate (CAGR) by Country (US$ Million): 2019 VS 2023 VS 2030
Table 64. Middle East, Africa, and Latin America User Interface Services Market Size by Country (2019-2024) & (US$ Million)
Table 65. Middle East, Africa, and Latin America User Interface Services Market Size by Country (2025-2030) & (US$ Million)
Table 66. Google Company Details
Table 67. Google Business Overview
Table 68. Google User Interface Services Product
Table 69. Google Revenue in User Interface Services Business (2019-2024) & (US$ Million)
Table 70. Google Recent Developments
Table 71. Apple Company Details
Table 72. Apple Business Overview
Table 73. Apple User Interface Services Product
Table 74. Apple Revenue in User Interface Services Business (2019-2024) & (US$ Million)
Table 75. Apple Recent Developments
Table 76. Microsoft Corporation Company Details
Table 77. Microsoft Corporation Business Overview
Table 78. Microsoft Corporation User Interface Services Product
Table 79. Microsoft Corporation Revenue in User Interface Services Business (2019-2024) & (US$ Million)
Table 80. Microsoft Corporation Recent Developments
Table 81. Samsung Group Company Details
Table 82. Samsung Group Business Overview
Table 83. Samsung Group User Interface Services Product
Table 84. Samsung Group Revenue in User Interface Services Business (2019-2024) & (US$ Million)
Table 85. Samsung Group Recent Developments
Table 86. Adobe Company Details
Table 87. Adobe Business Overview
Table 88. Adobe User Interface Services Product
Table 89. Adobe Revenue in User Interface Services Business (2019-2024) & (US$ Million)
Table 90. Adobe Recent Developments
Table 91. Fujitsu Company Details
Table 92. Fujitsu Business Overview
Table 93. Fujitsu User Interface Services Product
Table 94. Fujitsu Revenue in User Interface Services Business (2019-2024) & (US$ Million)
Table 95. Fujitsu Recent Developments
Table 96. Rossul Company Details
Table 97. Rossul Business Overview
Table 98. Rossul User Interface Services Product
Table 99. Rossul Revenue in User Interface Services Business (2019-2024) & (US$ Million)
Table 100. Rossul Recent Developments
Table 101. Intel Corporation Company Details
Table 102. Intel Corporation Business Overview
Table 103. Intel Corporation User Interface Services Product
Table 104. Intel Corporation Revenue in User Interface Services Business (2019-2024) & (US$ Million)
Table 105. Intel Corporation Recent Developments
Table 106. ARM Company Details
Table 107. ARM Business Overview
Table 108. ARM User Interface Services Product
Table 109. ARM Revenue in User Interface Services Business (2019-2024) & (US$ Million)
Table 110. ARM Recent Developments
Table 111. Oracle Company Details
Table 112. Oracle Business Overview
Table 113. Oracle User Interface Services Product
Table 114. Oracle Revenue in User Interface Services Business (2019-2024) & (US$ Million)
Table 115. Oracle Recent Developments
Table 116. LG Group Company Details
Table 117. LG Group Business Overview
Table 118. LG Group User Interface Services Product
Table 119. LG Group Revenue in User Interface Services Business (2019-2024) & (US$ Million)
Table 120. LG Group Recent Developments
Table 121. Origami Studios Company Details
Table 122. Origami Studios Business Overview
Table 123. Origami Studios User Interface Services Product
Table 124. Origami Studios Revenue in User Interface Services Business (2019-2024) & (US$ Million)
Table 125. Origami Studios Recent Developments
Table 126. Bluetext Company Details
Table 127. Bluetext Business Overview
Table 128. Bluetext User Interface Services Product
Table 129. Bluetext Revenue in User Interface Services Business (2019-2024) & (US$ Million)
Table 130. Bluetext Recent Developments
Table 131. Excelsior Technologies Company Details
Table 132. Excelsior Technologies Business Overview
Table 133. Excelsior Technologies User Interface Services Product
Table 134. Excelsior Technologies Revenue in User Interface Services Business (2019-2024) & (US$ Million)
Table 135. Excelsior Technologies Recent Developments
Table 136. QArea Company Details
Table 137. QArea Business Overview
Table 138. QArea User Interface Services Product
Table 139. QArea Revenue in User Interface Services Business (2019-2024) & (US$ Million)
Table 140. QArea Recent Developments
Table 141. CSC Company Details
Table 142. CSC Business Overview
Table 143. CSC User Interface Services Product
Table 144. CSC Revenue in User Interface Services Business (2019-2024) & (US$ Million)
Table 145. CSC Recent Developments
Table 146. Apex Vision Software Company Details
Table 147. Apex Vision Software Business Overview
Table 148. Apex Vision Software User Interface Services Product
Table 149. Apex Vision Software Revenue in User Interface Services Business (2019-2024) & (US$ Million)
Table 150. Apex Vision Software Recent Developments
Table 151. Steelkiwi Company Details
Table 152. Steelkiwi Business Overview
Table 153. Steelkiwi User Interface Services Product
Table 154. Steelkiwi Revenue in User Interface Services Business (2019-2024) & (US$ Million)
Table 155. Steelkiwi Recent Developments
Table 156. Intellectsoft Company Details
Table 157. Intellectsoft Business Overview
Table 158. Intellectsoft User Interface Services Product
Table 159. Intellectsoft Revenue in User Interface Services Business (2019-2024) & (US$ Million)
Table 160. Intellectsoft Recent Developments
Table 161. XB Software Company Details
Table 162. XB Software Business Overview
Table 163. XB Software User Interface Services Product
Table 164. XB Software Revenue in User Interface Services Business (2019-2024) & (US$ Million)
Table 165. XB Software Recent Developments
Table 166. Toptal Company Details
Table 167. Toptal Business Overview
Table 168. Toptal User Interface Services Product
Table 169. Toptal Revenue in User Interface Services Business (2019-2024) & (US$ Million)
Table 170. Toptal Recent Developments
Table 171. ChopDawg Studios Company Details
Table 172. ChopDawg Studios Business Overview
Table 173. ChopDawg Studios User Interface Services Product
Table 174. ChopDawg Studios Revenue in User Interface Services Business (2019-2024) & (US$ Million)
Table 175. ChopDawg Studios Recent Developments
Table 176. WebiMax Company Details
Table 177. WebiMax Business Overview
Table 178. WebiMax User Interface Services Product
Table 179. WebiMax Revenue in User Interface Services Business (2019-2024) & (US$ Million)
Table 180. WebiMax Recent Developments
Table 181. SmartSites Company Details
Table 182. SmartSites Business Overview
Table 183. SmartSites User Interface Services Product
Table 184. SmartSites Revenue in User Interface Services Business (2019-2024) & (US$ Million)
Table 185. SmartSites Recent Developments
Table 186. Dribbble Company Details
Table 187. Dribbble Business Overview
Table 188. Dribbble User Interface Services Product
Table 189. Dribbble Revenue in User Interface Services Business (2019-2024) & (US$ Million)
Table 190. Dribbble Recent Developments
Table 191. BKKR Company Details
Table 192. BKKR Business Overview
Table 193. BKKR User Interface Services Product
Table 194. BKKR Revenue in User Interface Services Business (2019-2024) & (US$ Million)
Table 195. BKKR Recent Developments
Table 196. Brio Company Details
Table 197. Brio Business Overview
Table 198. Brio User Interface Services Product
Table 199. Brio Revenue in User Interface Services Business (2019-2024) & (US$ Million)
Table 200. Brio Recent Developments
Table 201. Cactus Company Details
Table 202. Cactus Business Overview
Table 203. Cactus User Interface Services Product
Table 204. Cactus Revenue in User Interface Services Business (2019-2024) & (US$ Million)
Table 205. Cactus Recent Developments
Table 206. Canvasunited Company Details
Table 207. Canvasunited Business Overview
Table 208. Canvasunited User Interface Services Product
Table 209. Canvasunited Revenue in User Interface Services Business (2019-2024) & (US$ Million)
Table 210. Canvasunited Recent Developments
Table 211. Chetu Company Details
Table 212. Chetu Business Overview
Table 213. Chetu User Interface Services Product
Table 214. Chetu Revenue in User Interface Services Business (2019-2024) & (US$ Million)
Table 215. Chetu Recent Developments
Table 216. IMOBDEV Technologies Company Details
Table 217. IMOBDEV Technologies Business Overview
Table 218. IMOBDEV Technologies User Interface Services Product
Table 219. IMOBDEV Technologies Revenue in User Interface Services Business (2019-2024) & (US$ Million)
Table 220. IMOBDEV Technologies Recent Developments
Table 221. ITechArt Company Details
Table 222. ITechArt Business Overview
Table 223. ITechArt User Interface Services Product
Table 224. ITechArt Revenue in User Interface Services Business (2019-2024) & (US$ Million)
Table 225. ITechArt Recent Developments
Table 226. Infogain Company Details
Table 227. Infogain Business Overview
Table 228. Infogain User Interface Services Product
Table 229. Infogain Revenue in User Interface Services Business (2019-2024) & (US$ Million)
Table 230. Infogain Recent Developments
Table 231. Six & Flow Company Details
Table 232. Six & Flow Business Overview
Table 233. Six & Flow User Interface Services Product
Table 234. Six & Flow Revenue in User Interface Services Business (2019-2024) & (US$ Million)
Table 235. Six & Flow Recent Developments
Table 236. Omnicom Group Company Details
Table 237. Omnicom Group Business Overview
Table 238. Omnicom Group User Interface Services Product
Table 239. Omnicom Group Revenue in User Interface Services Business (2019-2024) & (US$ Million)
Table 240. Omnicom Group Recent Developments
Table 241. Thanx Media Company Details
Table 242. Thanx Media Business Overview
Table 243. Thanx Media User Interface Services Product
Table 244. Thanx Media Revenue in User Interface Services Business (2019-2024) & (US$ Million)
Table 245. Thanx Media Recent Development
Table 246. Bethel Web Design Company Company Details
Table 247. Bethel Web Design Company Business Overview
Table 248. Bethel Web Design Company User Interface Services Product
Table 249. Bethel Web Design Company Revenue in User Interface Services Business (2019-2024) & (US$ Million)
Table 250. Bethel Web Design Company Recent Development
Table 251. Creasant Digital Company Details
Table 252. Creasant Digital Business Overview
Table 253. Creasant Digital User Interface Services Product
Table 254. Creasant Digital Revenue in User Interface Services Business (2019-2024) & (US$ Million)
Table 255. Creasant Digital Recent Development
Table 256. Appnovation Company Details
Table 257. Appnovation Business Overview
Table 258. Appnovation User Interface Services Product
Table 259. Appnovation Revenue in User Interface Services Business (2019-2024) & (US$ Million)
Table 260. Appnovation Recent Development
Table 261. Tivix Company Details
Table 262. Tivix Business Overview
Table 263. Tivix User Interface Services Product
Table 264. Tivix Revenue in User Interface Services Business (2019-2024) & (US$ Million)
Table 265. Tivix Recent Development
Table 266. Research Programs/Design for This Report
Table 267. Key Data Information from Secondary Sources
Table 268. Key Data Information from Primary Sources
List of Figures
Figure 1. Global User Interface Services Market Size Growth Rate by Type, 2019 VS 2023 VS 2030 (US$ Million)
Figure 2. Global User Interface Services Market Share by Type: 2023 VS 2030
Figure 3. Web Service Interface Features
Figure 4. JQuery User Interface Features
Figure 5. Human-Machine Interface Features
Figure 6. Mobile Interface Features
Figure 7. Others Features
Figure 8. Global User Interface Services Market Size Growth Rate by Application, 2019 VS 2023 VS 2030 (US$ Million)
Figure 9. Global User Interface Services Market Share by Application: 2023 VS 2030
Figure 10. Electronics and Semiconductors Case Studies
Figure 11. Health Care Case Studies
Figure 12. Retail Industrial Case Studies
Figure 13. Education Industrial Case Studies
Figure 14. Media Industrial Case Studies
Figure 15. IT and Communications Case Studies
Figure 16. Other Case Studies
Figure 17. User Interface Services Report Years Considered
Figure 18. Global User Interface Services Market Size (US$ Million), Year-over-Year: 2019-2030
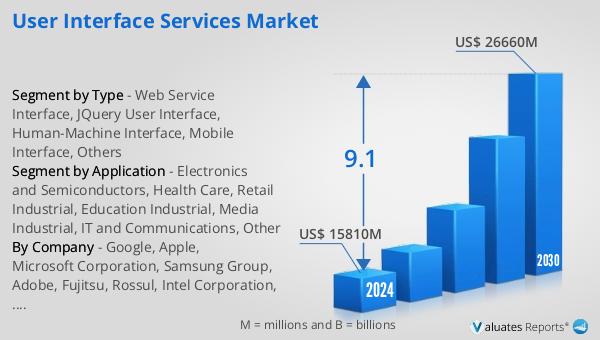
Figure 19. Global User Interface Services Market Size, (US$ Million), 2019 VS 2023 VS 2030
Figure 20. Global User Interface Services Market Share by Region: 2023 VS 2030
Figure 21. Global User Interface Services Market Share by Players in 2023
Figure 22. Global Top User Interface Services Players by Company Type (Tier 1, Tier 2, and Tier 3) & (based on the Revenue in User Interface Services as of 2023)
Figure 23. The Top 10 and 5 Players Market Share by User Interface Services Revenue in 2023
Figure 24. North America User Interface Services Market Size YoY Growth (2019-2030) & (US$ Million)
Figure 25. North America User Interface Services Market Share by Type (2019-2030)
Figure 26. North America User Interface Services Market Share by Application (2019-2030)
Figure 27. North America User Interface Services Market Share by Country (2019-2030)
Figure 28. United States User Interface Services Market Size YoY Growth (2019-2030) & (US$ Million)
Figure 29. Canada User Interface Services Market Size YoY Growth (2019-2030) & (US$ Million)
Figure 30. Europe User Interface Services Market Size YoY (2019-2030) & (US$ Million)
Figure 31. Europe User Interface Services Market Share by Type (2019-2030)
Figure 32. Europe User Interface Services Market Share by Application (2019-2030)
Figure 33. Europe User Interface Services Market Share by Country (2019-2030)
Figure 34. Germany User Interface Services Market Size YoY Growth (2019-2030) & (US$ Million)
Figure 35. France User Interface Services Market Size YoY Growth (2019-2030) & (US$ Million)
Figure 36. U.K. User Interface Services Market Size YoY Growth (2019-2030) & (US$ Million)
Figure 37. Italy User Interface Services Market Size YoY Growth (2019-2030) & (US$ Million)
Figure 38. Russia User Interface Services Market Size YoY Growth (2019-2030) & (US$ Million)
Figure 39. Nordic Countries User Interface Services Market Size YoY Growth (2019-2030) & (US$ Million)
Figure 40. China User Interface Services Market Size YoY (2019-2030) & (US$ Million)
Figure 41. China User Interface Services Market Share by Type (2019-2030)
Figure 42. China User Interface Services Market Share by Application (2019-2030)
Figure 43. Asia User Interface Services Market Size YoY (2019-2030) & (US$ Million)
Figure 44. Asia User Interface Services Market Share by Type (2019-2030)
Figure 45. Asia User Interface Services Market Share by Application (2019-2030)
Figure 46. Asia User Interface Services Market Share by Region (2019-2030)
Figure 47. Japan User Interface Services Market Size YoY Growth (2019-2030) & (US$ Million)
Figure 48. South Korea User Interface Services Market Size YoY Growth (2019-2030) & (US$ Million)
Figure 49. China Taiwan User Interface Services Market Size YoY Growth (2019-2030) & (US$ Million)
Figure 50. Southeast Asia User Interface Services Market Size YoY Growth (2019-2030) & (US$ Million)
Figure 51. India User Interface Services Market Size YoY Growth (2019-2030) & (US$ Million)
Figure 52. Australia User Interface Services Market Size YoY Growth (2019-2030) & (US$ Million)
Figure 53. Middle East, Africa, and Latin America User Interface Services Market Size YoY (2019-2030) & (US$ Million)
Figure 54. Middle East, Africa, and Latin America User Interface Services Market Share by Type (2019-2030)
Figure 55. Middle East, Africa, and Latin America User Interface Services Market Share by Application (2019-2030)
Figure 56. Middle East, Africa, and Latin America User Interface Services Market Share by Country (2019-2030)
Figure 57. Brazil User Interface Services Market Size YoY Growth (2019-2030) & (US$ Million)
Figure 58. Mexico User Interface Services Market Size YoY Growth (2019-2030) & (US$ Million)
Figure 59. Turkey User Interface Services Market Size YoY Growth (2019-2030) & (US$ Million)
Figure 60. Saudi Arabia User Interface Services Market Size YoY Growth (2019-2030) & (US$ Million)
Figure 61. Israel User Interface Services Market Size YoY Growth (2019-2030) & (US$ Million)
Figure 62. GCC Countries User Interface Services Market Size YoY Growth (2019-2030) & (US$ Million)
Figure 63. Google Revenue Growth Rate in User Interface Services Business (2019-2024)
Figure 64. Apple Revenue Growth Rate in User Interface Services Business (2019-2024)
Figure 65. Microsoft Corporation Revenue Growth Rate in User Interface Services Business (2019-2024)
Figure 66. Samsung Group Revenue Growth Rate in User Interface Services Business (2019-2024)
Figure 67. Adobe Revenue Growth Rate in User Interface Services Business (2019-2024)
Figure 68. Fujitsu Revenue Growth Rate in User Interface Services Business (2019-2024)
Figure 69. Rossul Revenue Growth Rate in User Interface Services Business (2019-2024)
Figure 70. Intel Corporation Revenue Growth Rate in User Interface Services Business (2019-2024)
Figure 71. ARM Revenue Growth Rate in User Interface Services Business (2019-2024)
Figure 72. Oracle Revenue Growth Rate in User Interface Services Business (2019-2024)
Figure 73. LG Group Revenue Growth Rate in User Interface Services Business (2019-2024)
Figure 74. Origami Studios Revenue Growth Rate in User Interface Services Business (2019-2024)
Figure 75. Bluetext Revenue Growth Rate in User Interface Services Business (2019-2024)
Figure 76. Excelsior Technologies Revenue Growth Rate in User Interface Services Business (2019-2024)
Figure 77. QArea Revenue Growth Rate in User Interface Services Business (2019-2024)
Figure 78. CSC Revenue Growth Rate in User Interface Services Business (2019-2024)
Figure 79. Apex Vision Software Revenue Growth Rate in User Interface Services Business (2019-2024)
Figure 80. Steelkiwi Revenue Growth Rate in User Interface Services Business (2019-2024)
Figure 81. Intellectsoft Revenue Growth Rate in User Interface Services Business (2019-2024)
Figure 82. XB Software Revenue Growth Rate in User Interface Services Business (2019-2024)
Figure 83. Toptal Revenue Growth Rate in User Interface Services Business (2019-2024)
Figure 84. ChopDawg Studios Revenue Growth Rate in User Interface Services Business (2019-2024)
Figure 85. WebiMax Revenue Growth Rate in User Interface Services Business (2019-2024)
Figure 86. SmartSites Revenue Growth Rate in User Interface Services Business (2019-2024)
Figure 87. Dribbble Revenue Growth Rate in User Interface Services Business (2019-2024)
Figure 88. BKKR Revenue Growth Rate in User Interface Services Business (2019-2024)
Figure 89. Brio Revenue Growth Rate in User Interface Services Business (2019-2024)
Figure 90. Cactus Revenue Growth Rate in User Interface Services Business (2019-2024)
Figure 91. Canvasunited Revenue Growth Rate in User Interface Services Business (2019-2024)
Figure 92. Chetu Revenue Growth Rate in User Interface Services Business (2019-2024)
Figure 93. IMOBDEV Technologies Revenue Growth Rate in User Interface Services Business (2019-2024)
Figure 94. ITechArt Revenue Growth Rate in User Interface Services Business (2019-2024)
Figure 95. Infogain Revenue Growth Rate in User Interface Services Business (2019-2024)
Figure 96. Six & Flow Revenue Growth Rate in User Interface Services Business (2019-2024)
Figure 97. Omnicom Group Revenue Growth Rate in User Interface Services Business (2019-2024)
Figure 98. Thanx Media Revenue Growth Rate in User Interface Services Business (2019-2024)
Figure 99. Bethel Web Design Company Revenue Growth Rate in User Interface Services Business (2019-2024)
Figure 100. Creasant Digital Revenue Growth Rate in User Interface Services Business (2019-2024)
Figure 101. Appnovation Revenue Growth Rate in User Interface Services Business (2019-2024)
Figure 102. Tivix Revenue Growth Rate in User Interface Services Business (2019-2024)
Figure 103. Romexsoft Revenue Growth Rate in User Interface Services Business (2019-2024)
Figure 104. Mobisoft Revenue Growth Rate in User Interface Services Business (2019-2024)
Figure 105. Bottom-up and Top-down Approaches for This Report
Figure 106. Data Triangulation
Figure 107. Key Executives Interviewed