List of Tables and Figures
Figure Boehmite Product Picture
Table Boehmite Key Market Segments in This Study
Table Key Manufacturers Boehmite Covered in This Study
Table Global Boehmite Market Size Growth Rate by Type 2019-2025 (MT) & (Million US$)
Figure Global Boehmite Production Market Share 2014-2025
Figure High Purity Boehmite Product Picture
Table Major Manufacturers of High Purity Boehmite
Figure Others (Purity Below 99.0%) Product Picture
Table Major Manufacturers of Others (Purity Below 99.0%)
Table Global Boehmite Market Size Growth Rate by Application 2019-2025 (MT)
Figure High Purity Boehmite
Figure Others (Purity Below 99.0%)
Figure Boehmite Report Years Considered
Figure Global Boehmite Revenue 2014-2025 (Million US$)
Figure Global Boehmite Production 2014-2025 (MT)
Figure Global Boehmite Capacity 2014-2025 (MT)
Table Key Manufacturers Boehmite Capacity (MT)
Figure Global Boehmite Price 2014-2025 (USD/MT)
Table Global Boehmite Market Size Growth Rate by Regions 2019-2025(MT) & (Million US$)
Table Global Manufacturers Market Concentration Ratio (CR5 and HHI)
Table Boehmite Manufacturing Base Distribution and Headquarters
Table Manufacturers Boehmite Product Offered
Table Date of Manufacturers Enter into Boehmite Market
Table Global Boehmite Production by Manufacturers (2014-2019) (MT)
Table Global Boehmite Production Share by Manufacturers (2014-2019)
Figure Global Boehmite Production Share by Manufacturers in 2018
Table Boehmite Revenue by Manufacturers (2014-2019) (Million US$)
Table Boehmite Revenue Share by Manufacturers (2014-2019)
Figure Boehmite Value Share by Manufacturers in 2018
Table Boehmite Price by Manufacturers 2014-2019 (USD/MT)
Table Mergers & Acquisitions, Expansion Plans
Table Global Boehmite Production by Regions 2014-2019 (MT)
Table Global Boehmite Production Market Share by Regions 2014-2019
Figure Global Boehmite Production Market Share by Regions 2014-2019
Figure Global Boehmite Production Market Share by Regions in 2018
Table Global Boehmite Revenue by Regions 2014-2019 (Million US$)
Table Global Boehmite Revenue Market Share by Regions 2014-2019
Figure Global Boehmite Revenue Market Share by Regions 2014-2019
Figure Global Boehmite Revenue Market Share by Regions in 2018
Figure United States Boehmite Production and Growth Rate 2014-2019 (MT)
Figure United States Boehmite Revenue and Growth Rate 2014-2019 (Million US$)
Table United States Boehmite Import & Export
Figure Europe Boehmite Production and Growth Rate 2014-2019 (MT)
Figure Europe Boehmite Revenue and Growth Rate 2014-2019 (Million US$)
Table Europe Boehmite Import & Export
Figure China Boehmite Production and Growth Rate 2014-2019 (MT)
Figure China Boehmite Revenue and Growth Rate 2014-2019 (Million US$)
Table China Boehmite Import & Export
Figure Japan Boehmite Production and Growth Rate 2014-2019 (MT)
Figure Japan Boehmite Revenue and Growth Rate 2014-2019 (Million US$)
Table Japan Boehmite Import & Export
Table Global Boehmite Consumption by Regions 2014-2019 (MT)
Table Global Boehmite Consumption Market Share by Regions 2014-2019
Figure Global Boehmite Consumption Market Share by Regions 2014-2019
Figure Global Boehmite Consumption Market Share by Regions in 2018
Figure North America Boehmite Consumption and Growth Rate (2014-2019) (MT)
Table North America Boehmite Consumption by Application (2014-2019) (MT)
Figure 2018 North America Boehmite Consumption Market Share by Application
Table North America Boehmite Consumption by Countries (2014-2019) (MT)
Figure 2018 North America Boehmite Consumption Market Share by Countries
Figure United States Boehmite Consumption and Growth Rate (2014-2019) (MT)
Figure Canada Boehmite Consumption (MT) and Growth Rate (2014-2019)
Figure Mexico Boehmite Consumption (MT) and Growth Rate (2014-2019)
Figure Europe Boehmite Consumption and Growth Rate (2014-2019) (MT)
Table Europe Boehmite Consumption by Application (2014-2019) (MT)
Figure 2018 Europe Boehmite Consumption Market Share by Application
Table Europe Boehmite Consumption by Countries (2014-2019) (MT)
Figure 2018 Europe Boehmite Consumption Market Share by Countries
Figure Germany Boehmite Consumption and Growth Rate (2014-2019) (MT)
Figure France Boehmite Consumption and Growth Rate (2014-2019) (MT)
Figure UK Boehmite Consumption and Growth Rate (2014-2019) (MT)
Figure Italy Boehmite Consumption and Growth Rate (2014-2019) (MT)
Figure Russia Boehmite Consumption and Growth Rate (2014-2019) (MT)
Figure Asia Pacific Boehmite Consumption and Growth Rate (2014-2019) (MT)
Table Asia Pacific Boehmite Consumption by Application (2014-2019) (MT)
Table Asia Pacific Boehmite Consumption Market Share by Application (2014-2019) (MT)
Table Asia Pacific Boehmite Consumption by Countries (2014-2019) (MT)
Table Asia Pacific Boehmite Consumption Market Share by Countries (2014-2019) (MT)
Figure China Boehmite Consumption and Growth Rate (2014-2019) (MT)
Figure Japan Boehmite Consumption and Growth Rate (2014-2019) (MT)
Figure Korea Boehmite Consumption and Growth Rate (2014-2019) (MT)
Figure India Boehmite Consumption and Growth Rate (2014-2019) (MT)
Figure Australia Boehmite Consumption and Growth Rate (2014-2019) (MT)
Figure Indonesia Boehmite Consumption and Growth Rate (2014-2019) (MT)
Figure Thailand Boehmite Consumption and Growth Rate (2014-2019) (MT)
Figure Malaysia Boehmite Consumption and Growth Rate (2014-2019) (MT)
Figure Philippines Boehmite Consumption and Growth Rate (2014-2019) (MT)
Figure Vietnam Boehmite Consumption and Growth Rate (2014-2019) (MT)
Figure Central & South America Boehmite Consumption and Growth Rate (MT)
Table Central & South America Boehmite Consumption by Application (2014-2019) (MT)
Figure 2017 Central & South America Boehmite Consumption Market Share by Application
Table Central & South America Boehmite Consumption by Countries (2014-2019) (MT)
Figure Central & South America Boehmite Consumption Market Share by Countries
Figure Brazil Boehmite Consumption and Growth Rate (2014-2019) (MT)
Figure Middle East and Africa Boehmite Consumption and Growth Rate (MT)
Table Middle East and Africa Boehmite Consumption by Application (2014-2019) (MT)
Figure 2018 Middle East and Africa Boehmite Consumption Market Share by Application
Table Middle East and Africa Boehmite Consumption by Countries (2014-2019) (MT)
Figure Middle East and Africa Boehmite Consumption Market Share by Countries
Figure Turkey Boehmite Consumption and Growth Rate (2014-2019) (MT)
Figure GCC Countries Boehmite Consumption and Growth Rate (2014-2019) (MT)
Figure Egypt Boehmite Consumption and Growth Rate (2014-2019) (MT)
Figure South Africa Boehmite Consumption and Growth Rate (2014-2019) (MT)
Table Global Boehmite Production by Type (2014-2019) (MT)
Table Global Boehmite Production Share by Type (2014-2019)
Figure Global Boehmite Production Market Share by Type (2014-2019)
Figure Global Boehmite Production Market Share by Type in 2018
Table Global Boehmite Revenue by Type (2014-2019) (Million US$)
Table Global Boehmite Revenue Share by Type (2014-2019)
Figure Global Boehmite Revenue Market Share by Type (2014-2019)
Figure Global Boehmite Revenue Market Share by Type in 2018
Table Boehmite Price by Type 2014-2019 (USD/MT)
Table Global Boehmite Consumption by Application (2014-2025) (MT)
Table Global Boehmite Consumption by Application (2014-2019) (MT)
Table Global Boehmite Consumption Share by Application (2014-2019)
Figure Global Boehmite Consumption Market Share by Application (2014-2019)
Figure Global Boehmite Value (Consumption) Market Share by Application (2014-2019)
Table Zhengzhou Research Institute of Chalco Company Details
Table Zhengzhou Research Institute of Chalco Boehmite Capacity, Production (MT), Revenue (Million US$), Price (USD/MT) and Gross Margin (2014-2019)
Figure Zhengzhou Research Institute of Chalco Boehmite Production Growth Rate (2014-2019)
Figure Zhengzhou Research Institute of Chalco Boehmite Production Market Share in Global Market
Table Zhengzhou Research Institute of Chalco Boehmite SWOT Analysis
Table AnHui Estone Material Technology Company Details
Table AnHui Estone Material Technology Boehmite Capacity, Production (MT), Revenue (Million US$), Price (USD/MT) and Gross Margin (2014-2019)
Figure AnHui Estone Material Technology Boehmite Production Growth Rate (2014-2019)
Figure AnHui Estone Material Technology Boehmite Production Market Share in Global Market
Table AnHui Estone Material Technology Boehmite SWOT Analysis
Table Sasol Company Details
Table Sasol Boehmite Capacity, Production (MT), Revenue (Million US$), Price (USD/MT) and Gross Margin (2014-2019)
Figure Sasol Boehmite Production Growth Rate (2014-2019)
Figure Sasol Boehmite Production Market Share in Global Market
Table Sasol Boehmite SWOT Analysis
Table Nabaltec Company Details
Table Nabaltec Boehmite Capacity, Production (MT), Revenue (Million US$), Price (USD/MT) and Gross Margin (2014-2019)
Figure Nabaltec Boehmite Production Growth Rate (2014-2019)
Figure Nabaltec Boehmite Production Market Share in Global Market
Table Nabaltec Boehmite SWOT Analysis
Table TOR Minerals Company Details
Table TOR Minerals Boehmite Capacity, Production (MT), Revenue (Million US$), Price (USD/MT) and Gross Margin (2014-2019)
Figure TOR Minerals Boehmite Production Growth Rate (2014-2019)
Figure TOR Minerals Boehmite Production Market Share in Global Market
Table TOR Minerals Boehmite SWOT Analysis
Table Kawai Lime Industry Company Details
Table Kawai Lime Industry Boehmite Capacity, Production (MT), Revenue (Million US$), Price (USD/MT) and Gross Margin (2014-2019)
Figure Kawai Lime Industry Boehmite Production Growth Rate (2014-2019)
Figure Kawai Lime Industry Boehmite Production Market Share in Global Market
Table Kawai Lime Industry Boehmite SWOT Analysis
Table TAIMEI Chemicals Company Details
Table TAIMEI Chemicals Boehmite Capacity, Production (MT), Revenue (Million US$), Price (USD/MT) and Gross Margin (2014-2019)
Figure TAIMEI Chemicals Boehmite Production Growth Rate (2014-2019)
Figure TAIMEI Chemicals Boehmite Production Market Share in Global Market
Table TAIMEI Chemicals Boehmite SWOT Analysis
Table Dequenne Chimie Company Details
Table Dequenne Chimie Boehmite Capacity, Production (MT), Revenue (Million US$), Price (USD/MT) and Gross Margin (2014-2019)
Figure Dequenne Chimie Boehmite Production Growth Rate (2014-2019)
Figure Dequenne Chimie Boehmite Production Market Share in Global Market
Table Dequenne Chimie Boehmite SWOT Analysis
Table Osang Group Company Details
Table Osang Group Boehmite Capacity, Production (MT), Revenue (Million US$), Price (USD/MT) and Gross Margin (2014-2019)
Figure Osang Group Boehmite Production Growth Rate (2014-2019)
Figure Osang Group Boehmite Production Market Share in Global Market
Table Osang Group Boehmite SWOT Analysis
Table Silkem Company Details
Table Silkem Boehmite Capacity, Production (MT), Revenue (Million US$), Price (USD/MT) and Gross Margin (2014-2019)
Figure Silkem Boehmite Production Growth Rate (2014-2019)
Figure Silkem Boehmite Production Market Share in Global Market
Table Silkem Boehmite SWOT Analysis
Table Xuancheng Jingrui New Materials Company Details
Table Tianjin Boyuan New Materials Company Details
Table PIDC Company Details
Table Shandong Jirun Nano New Materials Company Details
Table KC Corporation Company Details
Figure Global Boehmite Production Forecast 2019-2025 (MT)
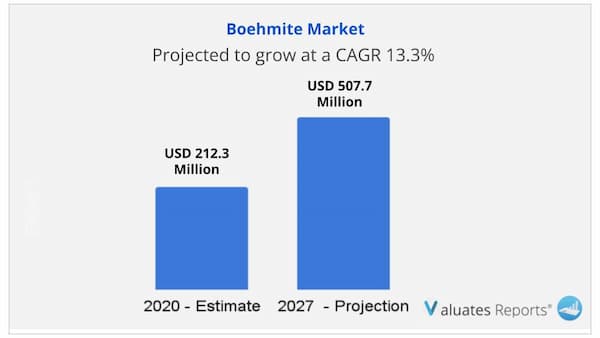
Figure Global Boehmite Revenue Forecast 2019-2025 (Million US$)
Table Global Boehmite Revenue Forecast 2019-2025 (Million US$)
Table Global Boehmite Revenue Forecast by Regions 2019-2025 (Million US$)
Figure Global Boehmite Revenue Forecast by Regions 2019-2025 (Million US$)
Figure Global Boehmite Revenue Market Share Forecast by Regions 2019-2025
Table Global Boehmite Production Forecast by Regions 2019-2025 (MT)
Figure Global Boehmite Production Forecast by Regions 2019-2025 (MT)
Figure Global Boehmite Production Market Share Forecast by Regions 2019-2025
Figure United States Boehmite Production Forecast 2019-2025 (MT)
Figure United States Boehmite Revenue Forecast 2019-2025 (Million US$)
Figure Europe Boehmite Production Forecast 2019-2025 (MT)
Figure Europe Boehmite Revenue Forecast 2019-2025 (Million US$)
Figure China Boehmite Production Forecast 2019-2025 (MT)
Figure China Boehmite Revenue Forecast 2019-2025 (Million US$)
Figure Japan Boehmite Production Forecast 2019-2025 (MT)
Figure Japan Boehmite Revenue Forecast 2019-2025 (Million US$)
Table Global Boehmite Production Forecast by Type 2019-2025 (MT)
Figure Global Boehmite Production Forecast by Type 2019-2025 (MT)
Figure Global Boehmite Production Market Share Forecast by Type 2019-2025
Table Global Boehmite Revenue Forecast by Type 2019-2025 (Million US$)
Figure Global Boehmite Revenue Forecast by Type 2019-2025 (Million US$)
Figure Global Boehmite Revenue Market Share Forecast by Type 2019-2025
Table Global Boehmite Consumption Forecast by Application 2019-2025 (MT)
Figure Global Boehmite Consumption Forecast by Application 2019-2025 (MT)
Figure Global Boehmite Consumption Market Share Forecast by Application 2019-2025
Table Global Boehmite Consumption Forecast by Regions 2019-2025 (MT)
Figure Global Boehmite Consumption Forecast by Regions 2019-2025 (MT)
Figure Global Boehmite Consumption Market Share Forecast by Regions 2019-2025
Table North America Boehmite Consumption Forecast by Regions 2019-2025 (MT)
Figure United States Boehmite Consumption Forecast 2019-2025 (MT)
Figure Canada Boehmite Consumption Forecast 2019-2025 (MT)
Figure MexicoBoehmite Consumption Forecast 2019-2025 (MT)
Table Europe Boehmite Consumption Forecast by Regions 2019-2025 (MT)
Figure Germany Boehmite Consumption Forecast 2019-2025 (MT)
Figure France Boehmite Consumption Forecast 2019-2025 (MT)
Figure UK Boehmite Consumption Forecast 2019-2025 (MT)
Figure Italy Boehmite Consumption Forecast 2019-2025 (MT)
Figure Russia Boehmite Consumption Forecast 2019-2025 (MT)
Table Asia Pacific Boehmite Consumption Forecast by Regions 2019-2025 (MT)
Figure China Boehmite Consumption Forecast 2019-2025 (MT)
Figure Japan Boehmite Consumption Forecast 2019-2025 (MT)
Figure Korea Boehmite Consumption Forecast 2019-2025 (MT)
Figure India Boehmite Consumption Forecast 2019-2025 (MT)
Figure Australia Boehmite Consumption Forecast 2019-2025 (MT)
Figure Indonesia Boehmite Consumption Forecast 2019-2025 (MT)
Figure Thailand Boehmite Consumption Forecast 2019-2025 (MT)
Figure Malaysia Boehmite Consumption Forecast 2019-2025 (MT)
Figure Philippines Boehmite Consumption Forecast 2019-2025 (MT)
Figure Vietnam Boehmite Consumption Forecast 2019-2025 (MT)
Table Central & South America Boehmite Consumption Forecast by Regions 2019-2025 (MT)
Figure Brazil Boehmite Consumption Forecast 2019-2025 (MT)
Table Middle East and Africa Boehmite Consumption Forecast by Regions 2019-2025 (MT)
Figure Middle East and Africa Boehmite Consumption Forecast 2019-2025 (MT)
Figure Turkey Boehmite Consumption Forecast 2019-2025 (MT)
Figure GCC Countries Boehmite Consumption Forecast 2019-2025 (MT)
Figure Egypt Boehmite Consumption Forecast 2019-2025 (MT)
Figure South Africa Boehmite Consumption Forecast 2019-2025 (MT)
Table Boehmite Key Raw Material
Table Typical Suppliers of Key Boehmite Raw Material
Figure Boehmite Industry Chain
Table Distributors/Traders List
Table Boehmite Customers List
Table Porter’s Five Forces Analysis
Table Research Programs/Design for This Report
Figure Bottom-up and Top-down Approaches for This Report
Figure Data Triangulation
Table Key Data Information from Secondary Sources
Table Key Data Information from Primary Sources