List of Tables
Table 1. Global RF Power Generators Market Value by Type (US$ Million), 2025 vs 2032
Table 2. Global RF Power Generators Market Value by Process (US$ Million), 2025 vs 2032
Table 3. Global RF Power Generators Market Value by Application (US$ Million), 2025 vs 2032
Table 4. Global RF Power Generators Production Capacity (K Units) by Manufacturers in 2025
Table 5. Global RF Power Generators Production by Manufacturers (K Units), 2021–2026
Table 6. Global RF Power Generators Production Market Share by Manufacturers (2021–2026)
Table 7. Global RF Power Generators Production Value by Manufacturers (US$ Million), 2021–2026
Table 8. Global RF Power Generators Production Value Share by Manufacturers (2021–2026)
Table 9. Global Key Players of RF Power Generators, Industry Ranking, 2024 vs 2025
Table 10. Classification of Companies by Tier (Tier 1, Tier 2, Tier 3), based on RF Power Generators Production Value, 2025
Table 11. Global Market RF Power Generators Average Price by Manufacturers (US$/Unit), 2021–2026
Table 12. Global Key Manufacturers of RF Power Generators, Manufacturing Footprints and Headquarters
Table 13. Global Key Manufacturers of RF Power Generators, Product Offerings and Applications
Table 14. Global Key Manufacturers of RF Power Generators, Date of Entry into the Industry
Table 15. Global RF Power Generators Manufacturers Market Concentration Ratio (CR5 and HHI)
Table 16. Mergers & Acquisitions and Expansion Plans
Table 17. Global RF Power Generators Production Value by Region: 2021 vs 2025 vs 2032 (US$ Million)
Table 18. Global RF Power Generators Production Value (US$ Million) by Region (2021–2026)
Table 19. Global RF Power Generators Production Value Market Share by Region (2021–2026)
Table 20. Global RF Power Generators Production Value (US$ Million) Forecast by Region (2027–2032)
Table 21. Global RF Power Generators Production Value Market Share Forecast by Region (2027–2032)
Table 22. Global RF Power Generators Production Comparison by Region: 2021 vs 2025 vs 2032 (K Units)
Table 23. Global RF Power Generators Production (K Units) by Region (2021–2026)
Table 24. Global RF Power Generators Production Market Share by Region (2021–2026)
Table 25. Global RF Power Generators Production (K Units) Forecast by Region (2027–2032)
Table 26. Global RF Power Generators Production Market Share Forecast by Region (2027–2032)
Table 27. Global RF Power Generators Market Average Price (US$/Unit) by Region (2021–2026)
Table 28. Global RF Power Generators Market Average Price (US$/Unit) by Region (2027–2032)
Table 29. Global RF Power Generators Consumption Growth Rate by Region: 2021 vs 2025 vs 2032 (K Units)
Table 30. Global RF Power Generators Consumption by Region (K Units), 2021–2026
Table 31. Global RF Power Generators Consumption Market Share by Region (2021–2026)
Table 32. Global RF Power Generators Forecasted Consumption by Region (K Units), 2027–2032
Table 33. Global RF Power Generators Forecasted Consumption Market Share by Region (2027–2032)
Table 34. North America RF Power Generators Consumption Growth Rate by Country: 2021 vs 2025 vs 2032 (K Units)
Table 35. North America RF Power Generators Consumption by Country (K Units), 2021–2026
Table 36. North America RF Power Generators Consumption by Country (K Units), 2027–2032
Table 37. Europe RF Power Generators Consumption Growth Rate by Country: 2021 vs 2025 vs 2032 (K Units)
Table 38. Europe RF Power Generators Consumption by Country (K Units), 2021–2026
Table 39. Europe RF Power Generators Consumption by Country (K Units), 2027–2032
Table 40. Asia Pacific RF Power Generators Consumption Growth Rate by Region: 2021 vs 2025 vs 2032 (K Units)
Table 41. Asia Pacific RF Power Generators Consumption by Region (K Units), 2021–2026
Table 42. Asia Pacific RF Power Generators Consumption by Region (K Units), 2027–2032
Table 43. Latin America, Middle East & Africa RF Power Generators Consumption Growth Rate by Country: 2021 vs 2025 vs 2032 (K Units)
Table 44. Latin America, Middle East & Africa RF Power Generators Consumption by Country (K Units), 2021–2026
Table 45. Latin America, Middle East & Africa RF Power Generators Consumption by Country (K Units), 2027–2032
Table 46. Global RF Power Generators Production (K Units) by Type (2021–2026)
Table 47. Global RF Power Generators Production (K Units) by Type (2027–2032)
Table 48. Global RF Power Generators Production Market Share by Type (2021–2026)
Table 49. Global RF Power Generators Production Market Share by Type (2027–2032)
Table 50. Global RF Power Generators Production Value (US$ Million) by Type (2021–2026)
Table 51. Global RF Power Generators Production Value (US$ Million) by Type (2027–2032)
Table 52. Global RF Power Generators Production Value Market Share by Type (2021–2026)
Table 53. Global RF Power Generators Production Value Market Share by Type (2027–2032)
Table 54. Global RF Power Generators Price (US$/Unit) by Type (2021–2026)
Table 55. Global RF Power Generators Price (US$/Unit) by Type (2027–2032)
Table 56. Global RF Power Generators Production (K Units) by Application (2021–2026)
Table 57. Global RF Power Generators Production (K Units) by Application (2027–2032)
Table 58. Global RF Power Generators Production Market Share by Application (2021–2026)
Table 59. Global RF Power Generators Production Market Share by Application (2027–2032)
Table 60. Global RF Power Generators Production Value (US$ Million) by Application (2021–2026)
Table 61. Global RF Power Generators Production Value (US$ Million) by Application (2027–2032)
Table 62. Global RF Power Generators Production Value Market Share by Application (2021–2026)
Table 63. Global RF Power Generators Production Value Market Share by Application (2027–2032)
Table 64. Global RF Power Generators Price (US$/Unit) by Application (2021–2026)
Table 65. Global RF Power Generators Price (US$/Unit) by Application (2027–2032)
Table 66. Advanced Energy RF Power Generators Company Information
Table 67. Advanced Energy RF Power Generators Specification and Application
Table 68. Advanced Energy RF Power Generators Production (K Units), Value (US$ Million), Price (US$/Unit) and Gross Margin (2021–2026)
Table 69. Advanced Energy Main Business and Markets Served
Table 70. Advanced Energy Recent Developments/Updates
Table 71. MKS Instruments RF Power Generators Company Information
Table 72. MKS Instruments RF Power Generators Specification and Application
Table 73. MKS Instruments RF Power Generators Production (K Units), Value (US$ Million), Price (US$/Unit) and Gross Margin (2021–2026)
Table 74. MKS Instruments Main Business and Markets Served
Table 75. MKS Instruments Recent Developments/Updates
Table 76. Comet PCT RF Power Generators Company Information
Table 77. Comet PCT RF Power Generators Specification and Application
Table 78. Comet PCT RF Power Generators Production (K Units), Value (US$ Million), Price (US$/Unit) and Gross Margin (2021–2026)
Table 79. Comet PCT Main Business and Markets Served
Table 80. Comet PCT Recent Developments/Updates
Table 81. DAIHEN Corporation RF Power Generators Company Information
Table 82. DAIHEN Corporation RF Power Generators Specification and Application
Table 83. DAIHEN Corporation RF Power Generators Production (K Units), Value (US$ Million), Price (US$/Unit) and Gross Margin (2021–2026)
Table 84. DAIHEN Corporation Main Business and Markets Served
Table 85. DAIHEN Corporation Recent Developments/Updates
Table 86. Trumpf RF Power Generators Company Information
Table 87. Trumpf RF Power Generators Specification and Application
Table 88. Trumpf RF Power Generators Production (K Units), Value (US$ Million), Price (US$/Unit) and Gross Margin (2021–2026)
Table 89. Trumpf Main Business and Markets Served
Table 90. Trumpf Recent Developments/Updates
Table 91. Adtec Plasma Technology RF Power Generators Company Information
Table 92. Adtec Plasma Technology RF Power Generators Specification and Application
Table 93. Adtec Plasma Technology RF Power Generators Production (K Units), Value (US$ Million), Price (US$/Unit) and Gross Margin (2021–2026)
Table 94. Adtec Plasma Technology Main Business and Markets Served
Table 95. Adtec Plasma Technology Recent Developments/Updates
Table 96. Kyosan Electric Manufacturing RF Power Generators Company Information
Table 97. Kyosan Electric Manufacturing RF Power Generators Specification and Application
Table 98. Kyosan Electric Manufacturing RF Power Generators Production (K Units), Value (US$ Million), Price (US$/Unit) and Gross Margin (2021–2026)
Table 99. Kyosan Electric Manufacturing Main Business and Markets Served
Table 100. Kyosan Electric Manufacturing Recent Developments/Updates
Table 101. XP Power RF Power Generators Company Information
Table 102. XP Power RF Power Generators Specification and Application
Table 103. XP Power RF Power Generators Production (K Units), Value (US$ Million), Price (US$/Unit) and Gross Margin (2021–2026)
Table 104. XP Power Main Business and Markets Served
Table 105. XP Power Recent Developments/Updates
Table 106. ULVAC RF Power Generators Company Information
Table 107. ULVAC RF Power Generators Specification and Application
Table 108. ULVAC RF Power Generators Production (K Units), Value (US$ Million), Price (US$/Unit) and Gross Margin (2021–2026)
Table 109. ULVAC Main Business and Markets Served
Table 110. ULVAC Recent Developments/Updates
Table 111. JEOL RF Power Generators Company Information
Table 112. JEOL RF Power Generators Specification and Application
Table 113. JEOL RF Power Generators Production (K Units), Value (US$ Million), Price (US$/Unit) and Gross Margin (2021–2026)
Table 114. JEOL Main Business and Markets Served
Table 115. JEOL Recent Developments/Updates
Table 116. Beijing Aurasky RF Power Generators Company Information
Table 117. Beijing Aurasky RF Power Generators Specification and Application
Table 118. Beijing Aurasky RF Power Generators Production (K Units), Value (US$ Million), Price (US$/Unit) and Gross Margin (2021–2026)
Table 119. Beijing Aurasky Main Business and Markets Served
Table 120. Beijing Aurasky Recent Developments/Updates
Table 121. ASE RF Power Generators Company Information
Table 122. ASE RF Power Generators Specification and Application
Table 123. ASE RF Power Generators Production (K Units), Value (US$ Million), Price (US$/Unit) and Gross Margin (2021–2026)
Table 124. ASE Main Business and Markets Served
Table 125. ASE Recent Developments/Updates
Table 126. Seren IPS RF Power Generators Company Information
Table 127. Seren IPS RF Power Generators Specification and Application
Table 128. Seren IPS RF Power Generators Production (K Units), Value (US$ Million), Price (US$/Unit) and Gross Margin (2021–2026)
Table 129. Seren IPS Main Business and Markets Served
Table 130. Seren IPS Recent Developments/Updates
Table 131. Pearl Kogyo RF Power Generators Company Information
Table 132. Pearl Kogyo RF Power Generators Specification and Application
Table 133. Pearl Kogyo RF Power Generators Production (K Units), Value (US$ Million), Price (US$/Unit) and Gross Margin (2021–2026)
Table 134. Pearl Kogyo Main Business and Markets Served
Table 135. Pearl Kogyo Recent Developments/Updates
Table 136. Shenzhen CSL Vacuum RF Power Generators Company Information
Table 137. Shenzhen CSL Vacuum RF Power Generators Specification and Application
Table 138. Shenzhen CSL Vacuum RF Power Generators Production (K Units), Value (US$ Million), Price (US$/Unit) and Gross Margin (2021–2026)
Table 139. Shenzhen CSL Vacuum Main Business and Markets Served
Table 140. Shenzhen CSL Vacuum Recent Developments/Updates
Table 141. New Power Plasma RF Power Generators Company Information
Table 142. New Power Plasma RF Power Generators Specification and Application
Table 143. New Power Plasma RF Power Generators Production (K Units), Value (US$ Million), Price (US$/Unit) and Gross Margin (2021–2026)
Table 144. New Power Plasma Main Business and Markets Served
Table 145. New Power Plasma Recent Developments/Updates
Table 146. Youngsin RF Co., Ltd RF Power Generators Company Information
Table 147. Youngsin RF Co., Ltd RF Power Generators Specification and Application
Table 148. Youngsin RF Co., Ltd RF Power Generators Production (K Units), Value (US$ Million), Price (US$/Unit) and Gross Margin (2021–2026)
Table 149. Youngsin RF Co., Ltd Main Business and Markets Served
Table 150. Youngsin RF Co., Ltd Recent Developments/Updates
Table 151. Shanghai AENI Semiconductor RF Power Generators Company Information
Table 152. Shanghai AENI Semiconductor RF Power Generators Specification and Application
Table 153. Shanghai AENI Semiconductor RF Power Generators Production (K Units), Value (US$ Million), Price (US$/Unit) and Gross Margin (2021–2026)
Table 154. Shanghai AENI Semiconductor Main Business and Markets Served
Table 155. Shanghai AENI Semiconductor Recent Developments/Updates
Table 156. RF Power Tech RF Power Generators Company Information
Table 157. RF Power Tech RF Power Generators Specification and Application
Table 158. RF Power Tech RF Power Generators Production (K Units), Value (US$ Million), Price (US$/Unit) and Gross Margin (2021–2026)
Table 159. RF Power Tech Main Business and Markets Served
Table 160. RF Power Tech Recent Developments/Updates
Table 161. EQ Global RF Power Generators Company Information
Table 162. EQ Global RF Power Generators Specification and Application
Table 163. EQ Global RF Power Generators Production (K Units), Value (US$ Million), Price (US$/Unit) and Gross Margin (2021–2026)
Table 164. EQ Global Main Business and Markets Served
Table 165. EQ Global Recent Developments/Updates
Table 166. Coaxial Power Systems RF Power Generators Company Information
Table 167. Coaxial Power Systems RF Power Generators Specification and Application
Table 168. Coaxial Power Systems RF Power Generators Production (K Units), Value (US$ Million), Price (US$/Unit) and Gross Margin (2021–2026)
Table 169. Coaxial Power Systems Main Business and Markets Served
Table 170. Coaxial Power Systems Recent Developments/Updates
Table 171. Gmpower RF Power Generators Company Information
Table 172. Gmpower RF Power Generators Specification and Application
Table 173. Gmpower RF Power Generators Production (K Units), Value (US$ Million), Price (US$/Unit) and Gross Margin (2021–2026)
Table 174. Gmpower Main Business and Markets Served
Table 175. Gmpower Recent Developments/Updates
Table 176. Generator Research Limited RF Power Generators Company Information
Table 177. Generator Research Limited RF Power Generators Specification and Application
Table 178. Generator Research Limited RF Power Generators Production (K Units), Value (US$ Million), Price (US$/Unit) and Gross Margin (2021–2026)
Table 179. Generator Research Limited Main Business and Markets Served
Table 180. Generator Research Limited Recent Developments/Updates
Table 181. Sichuan Injet Electric RF Power Generators Company Information
Table 182. Sichuan Injet Electric RF Power Generators Specification and Application
Table 183. Sichuan Injet Electric RF Power Generators Production (K Units), Value (US$ Million), Price (US$/Unit) and Gross Margin (2021–2026)
Table 184. Sichuan Injet Electric Main Business and Markets Served
Table 185. Sichuan Injet Electric Recent Developments/Updates
Table 186. Foshan Instrument Technology RF Power Generators Company Information
Table 187. Foshan Instrument Technology RF Power Generators Specification and Application
Table 188. Foshan Instrument Technology RF Power Generators Production (K Units), Value (US$ Million), Price (US$/Unit) and Gross Margin (2021–2026)
Table 189. Foshan Instrument Technology Main Business and Markets Served
Table 190. Foshan Instrument Technology Recent Developments/Updates
Table 191. Hunan Zhongyuan RF Power Generators Company Information
Table 192. Hunan Zhongyuan RF Power Generators Specification and Application
Table 193. Hunan Zhongyuan RF Power Generators Production (K Units), Value (US$ Million), Price (US$/Unit) and Gross Margin (2021–2026)
Table 194. Hunan Zhongyuan Main Business and Markets Served
Table 195. Hunan Zhongyuan Recent Developments/Updates
Table 196. Shanghai Rock Technology RF Power Generators Company Information
Table 197. Shanghai Rock Technology RF Power Generators Specification and Application
Table 198. Shanghai Rock Technology RF Power Generators Production (K Units), Value (US$ Million), Price (US$/Unit) and Gross Margin (2021–2026)
Table 199. Shanghai Rock Technology Main Business and Markets Served
Table 200. Shanghai Rock Technology Recent Developments/Updates
Table 201. Wuhan Chengyuan Electronic Technology RF Power Generators Company Information
Table 202. Wuhan Chengyuan Electronic Technology RF Power Generators Specification and Application
Table 203. Wuhan Chengyuan Electronic Technology RF Power Generators Production (K Units), Value (US$ Million), Price (US$/Unit) and Gross Margin (2021–2026)
Table 204. Wuhan Chengyuan Electronic Technology Main Business and Markets Served
Table 205. Wuhan Chengyuan Electronic Technology Recent Developments/Updates
Table 206. Shanghai Lizhao Technology Co., Ltd RF Power Generators Company Information
Table 207. Shanghai Lizhao Technology Co., Ltd RF Power Generators Specification and Application
Table 208. Shanghai Lizhao Technology Co., Ltd RF Power Generators Production (K Units), Value (US$ Million), Price (US$/Unit) and Gross Margin (2021–2026)
Table 209. Shanghai Lizhao Technology Co., Ltd Main Business and Markets Served
Table 210. Shanghai Lizhao Technology Co., Ltd Recent Developments/Updates
Table 211. Shenzhen Rspower Technology Co., Ltd RF Power Generators Company Information
Table 212. Shenzhen Rspower Technology Co., Ltd RF Power Generators Specification and Application
Table 213. Shenzhen Rspower Technology Co., Ltd RF Power Generators Production (K Units), Value (US$ Million), Price (US$/Unit) and Gross Margin (2021–2026)
Table 214. Shenzhen Rspower Technology Co., Ltd Main Business and Markets Served
Table 215. Shenzhen Rspower Technology Co., Ltd Recent Developments/Updates
Table 216. Hunan Huaxin RF Power Generators Company Information
Table 217. Hunan Huaxin RF Power Generators Specification and Application
Table 218. Hunan Huaxin RF Power Generators Production (K Units), Value (US$ Million), Price (US$/Unit) and Gross Margin (2021–2026)
Table 219. Hunan Huaxin Main Business and Markets Served
Table 220. Hunan Huaxin Recent Developments/Updates
Table 221. Shanghai Semik Semiconductor RF Power Generators Company Information
Table 222. Shanghai Semik Semiconductor RF Power Generators Specification and Application
Table 223. Shanghai Semik Semiconductor RF Power Generators Production (K Units), Value (US$ Million), Price (US$/Unit) and Gross Margin (2021–2026)
Table 224. Shanghai Semik Semiconductor Main Business and Markets Served
Table 225. Shanghai Semik Semiconductor Recent Developments/Updates
Table 226. Chengdu Wattsine RF Power Generators Company Information
Table 227. Chengdu Wattsine RF Power Generators Specification and Application
Table 228. Chengdu Wattsine RF Power Generators Production (K Units), Value (US$ Million), Price (US$/Unit) and Gross Margin (2021–2026)
Table 229. Chengdu Wattsine Main Business and Markets Served
Table 230. Chengdu Wattsine Recent Developments/Updates
Table 231. Changzhou Rishige RF Power Generators Company Information
Table 232. Changzhou Rishige RF Power Generators Specification and Application
Table 233. Changzhou Rishige RF Power Generators Production (K Units), Value (US$ Million), Price (US$/Unit) and Gross Margin (2021–2026)
Table 234. Changzhou Rishige Main Business and Markets Served
Table 235. Changzhou Rishige Recent Developments/Updates
Table 236. DKK RF Power Generators Company Information
Table 237. DKK RF Power Generators Specification and Application
Table 238. DKK RF Power Generators Production (K Units), Value (US$ Million), Price (US$/Unit) and Gross Margin (2021–2026)
Table 239. DKK Main Business and Markets Served
Table 240. DKK Recent Developments/Updates
Table 241. T&C Power Conversion RF Power Generators Company Information
Table 242. T&C Power Conversion RF Power Generators Specification and Application
Table 243. T&C Power Conversion RF Power Generators Production (K Units), Value (US$ Million), Price (US$/Unit) and Gross Margin (2021–2026)
Table 244. T&C Power Conversion Main Business and Markets Served
Table 245. T&C Power Conversion Recent Developments/Updates
Table 246. Zhongshan Kvmen RF Power Generators Company Information
Table 247. Zhongshan Kvmen RF Power Generators Specification and Application
Table 248. Zhongshan Kvmen RF Power Generators Production (K Units), Value (US$ Million), Price (US$/Unit) and Gross Margin (2021–2026)
Table 249. Zhongshan Kvmen Main Business and Markets Served
Table 250. Zhongshan Kvmen Recent Developments/Updates
Table 251. SAIREM RF Power Generators Company Information
Table 252. SAIREM RF Power Generators Specification and Application
Table 253. SAIREM RF Power Generators Production (K Units), Value (US$ Million), Price (US$/Unit) and Gross Margin (2021–2026)
Table 254. SAIREM Main Business and Markets Served
Table 255. SAIREM Recent Developments/Updates
Table 256. Key Raw Materials Lists
Table 257. Raw Materials Key Suppliers Lists
Table 258. RF Power Generators Distributors List
Table 259. RF Power Generators Customers List
Table 260. RF Power Generators Market Trends
Table 261. RF Power Generators Market Drivers
Table 262. RF Power Generators Market Challenges
Table 263. RF Power Generators Market Restraints
Table 264. Research Programs/Design for This Report
Table 265. Key Data Information from Secondary Sources
Table 266. Key Data Information from Primary Sources
Table 267. Authors List of This Report
List of Figures
Figure 1. Product Picture of RF Power Generators
Figure 2. Global RF Power Generators Market Value by Type (US$ Million), 2021–2032
Figure 3. Global RF Power Generators Market Share by Type: 2025 vs 2032
Figure 4. 400KHz Product Picture
Figure 5. 2MHz Product Picture
Figure 6. 4MHz Product Picture
Figure 7. 13.56MHz Product Picture
Figure 8. 27.12MHz Product Picture
Figure 9. 40.68MHz Product Picture
Figure 10. 60MHz Product Picture
Figure 11. Others Product Picture
Figure 12. Global RF Power Generators Market Value by Process (US$ Million), 2021–2032
Figure 13. Global RF Power Generators Market Share by Process: 2025 vs 2032
Figure 14. Etching Product Picture
Figure 15. CVD Product Picture
Figure 16. PVD Product Picture
Figure 17. Others Product Picture
Figure 18. Global RF Power Generators Market Value by Application (US$ Million), 2021–2032
Figure 19. Global RF Power Generators Market Share by Application: 2025 vs 2032
Figure 20. Semiconductor
Figure 21. Solar
Figure 22. LCD
Figure 23. Others
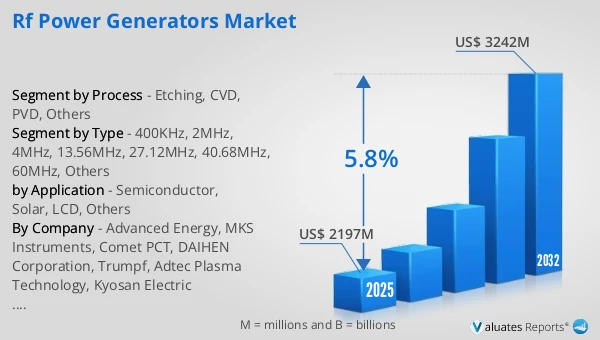
Figure 24. Global RF Power Generators Production Value (US$ Million), 2021 vs 2025 vs 2032
Figure 25. Global RF Power Generators Production Value (US$ Million), 2021–2032
Figure 26. Global RF Power Generators Production Capacity (K Units), 2021–2032
Figure 27. Global RF Power Generators Production (K Units), 2021–2032
Figure 28. Global RF Power Generators Average Price (US$/Unit), 2021–2032
Figure 29. RF Power Generators Report Years Considered
Figure 30. RF Power Generators Production Share by Manufacturers in 2025
Figure 31. Global RF Power Generators Production Value Share by Manufacturers (2025)
Figure 32. RF Power Generators Market Share by Company Type (Tier 1, Tier 2, and Tier 3): 2021 vs 2025
Figure 33. Top 5 and Top 10 Global Players: Market Share by RF Power Generators Revenue in 2025
Figure 34. Global RF Power Generators Production Value by Region: 2021 vs 2025 vs 2032 (US$ Million)
Figure 35. Global RF Power Generators Production Value Market Share by Region: 2021 vs 2025 vs 2032
Figure 36. Global RF Power Generators Production Comparison by Region: 2021 vs 2025 vs 2032 (K Units)
Figure 37. Global RF Power Generators Production Market Share by Region: 2021 vs 2025 vs 2032
Figure 38. North America RF Power Generators Production Value (US$ Million) Growth Rate (2021–2032)
Figure 39. Europe RF Power Generators Production Value (US$ Million) Growth Rate (2021–2032)
Figure 40. China RF Power Generators Production Value (US$ Million) Growth Rate (2021–2032)
Figure 41. Japan RF Power Generators Production Value (US$ Million) Growth Rate (2021–2032)
Figure 42. Southeast Asia RF Power Generators Production Value (US$ Million) Growth Rate (2021–2032)
Figure 43. South Korea RF Power Generators Production Value (US$ Million) Growth Rate (2021–2032)
Figure 44. Global RF Power Generators Consumption by Region: 2021 vs 2025 vs 2032 (K Units)
Figure 45. Global RF Power Generators Consumption Market Share by Region: 2021 vs 2025 vs 2032
Figure 46. North America RF Power Generators Consumption and Growth Rate (K Units), 2021–2032
Figure 47. North America RF Power Generators Consumption Market Share by Country (2021–2032)
Figure 48. U.S. RF Power Generators Consumption and Growth Rate (K Units), 2021–2032
Figure 49. Canada RF Power Generators Consumption and Growth Rate (K Units), 2021–2032
Figure 50. Europe RF Power Generators Consumption and Growth Rate (K Units), 2021–2032
Figure 51. Europe RF Power Generators Consumption Market Share by Country (2021–2032)
Figure 52. Germany RF Power Generators Consumption and Growth Rate (K Units), 2021–2032
Figure 53. France RF Power Generators Consumption and Growth Rate (K Units), 2021–2032
Figure 54. U.K. RF Power Generators Consumption and Growth Rate (K Units), 2021–2032
Figure 55. Italy RF Power Generators Consumption and Growth Rate (K Units), 2021–2032
Figure 56. Russia RF Power Generators Consumption and Growth Rate (K Units), 2021–2032
Figure 57. Asia Pacific RF Power Generators Consumption and Growth Rate (K Units), 2021–2032
Figure 58. Asia Pacific RF Power Generators Consumption Market Share by Region (2021–2032)
Figure 59. China RF Power Generators Consumption and Growth Rate (K Units), 2021–2032
Figure 60. Japan RF Power Generators Consumption and Growth Rate (K Units), 2021–2032
Figure 61. South Korea RF Power Generators Consumption and Growth Rate (K Units), 2021–2032
Figure 62. China Taiwan RF Power Generators Consumption and Growth Rate (K Units), 2021–2032
Figure 63. Southeast Asia RF Power Generators Consumption and Growth Rate (K Units), 2021–2032
Figure 64. India RF Power Generators Consumption and Growth Rate (K Units), 2021–2032
Figure 65. Latin America, Middle East & Africa RF Power Generators Consumption and Growth Rate (K Units), 2021–2032
Figure 66. Latin America, Middle East & Africa RF Power Generators Consumption Market Share by Country (2021–2032)
Figure 67. Mexico RF Power Generators Consumption and Growth Rate (K Units), 2021–2032
Figure 68. Brazil RF Power Generators Consumption and Growth Rate (K Units), 2021–2032
Figure 69. Turkey RF Power Generators Consumption and Growth Rate (K Units), 2021–2032
Figure 70. GCC Countries RF Power Generators Consumption and Growth Rate (K Units), 2021–2032
Figure 71. Global Production Market Share of RF Power Generators by Type (2021–2032)
Figure 72. Global Production Value Market Share of RF Power Generators by Type (2021–2032)
Figure 73. Global RF Power Generators Price (US$/Unit) by Type (2021–2032)
Figure 74. Global Production Market Share of RF Power Generators by Application (2021–2032)
Figure 75. Global Production Value Market Share of RF Power Generators by Application (2021–2032)
Figure 76. Global RF Power Generators Price (US$/Unit) by Application (2021–2032)
Figure 77. RF Power Generators Value Chain
Figure 78. Channels of Distribution (Direct Vs Distribution)
Figure 79. Bottom-up and Top-down Approaches for This Report
Figure 80. Data Triangulation