List of Tables
Table 1. Global Food and Beverage Cold Chain Logistics Market Size Growth Rate by Type (US$ Million): 2020 VS 2024 VS 2031
Table 2. Key Players of Airways
Table 3. Key Players of Roadways
Table 4. Key Players of Seaways
Table 5. Global Food and Beverage Cold Chain Logistics Market Size Growth by Application (US$ Million): 2020 VS 2024 VS 2031
Table 6. Global Food and Beverage Cold Chain Logistics Market Size by Region (US$ Million): 2020 VS 2024 VS 2031
Table 7. Global Food and Beverage Cold Chain Logistics Market Size by Region (2020-2025) & (US$ Million)
Table 8. Global Food and Beverage Cold Chain Logistics Market Share by Region (2020-2025)
Table 9. Global Food and Beverage Cold Chain Logistics Forecasted Market Size by Region (2026-2031) & (US$ Million)
Table 10. Global Food and Beverage Cold Chain Logistics Market Share by Region (2026-2031)
Table 11. Food and Beverage Cold Chain Logistics Market Trends
Table 12. Food and Beverage Cold Chain Logistics Market Drivers
Table 13. Food and Beverage Cold Chain Logistics Market Challenges
Table 14. Food and Beverage Cold Chain Logistics Market Restraints
Table 15. Global Food and Beverage Cold Chain Logistics Revenue by Players (2020-2025) & (US$ Million)
Table 16. Global Food and Beverage Cold Chain Logistics Market Share by Players (2020-2025)
Table 17. Global Top Food and Beverage Cold Chain Logistics Players by Company Type (Tier 1, Tier 2, and Tier 3) & (based on the Revenue in Food and Beverage Cold Chain Logistics as of 2024)
Table 18. Ranking of Global Top Food and Beverage Cold Chain Logistics Companies by Revenue (US$ Million) in 2024
Table 19. Global 5 Largest Players Market Share by Food and Beverage Cold Chain Logistics Revenue (CR5 and HHI) & (2020-2025)
Table 20. Global Key Players of Food and Beverage Cold Chain Logistics, Headquarters and Area Served
Table 21. Global Key Players of Food and Beverage Cold Chain Logistics, Product and Application
Table 22. Global Key Players of Food and Beverage Cold Chain Logistics, Date of Enter into This Industry
Table 23. Mergers & Acquisitions, Expansion Plans
Table 24. Global Food and Beverage Cold Chain Logistics Market Size by Type (2020-2025) & (US$ Million)
Table 25. Global Food and Beverage Cold Chain Logistics Revenue Market Share by Type (2020-2025)
Table 26. Global Food and Beverage Cold Chain Logistics Forecasted Market Size by Type (2026-2031) & (US$ Million)
Table 27. Global Food and Beverage Cold Chain Logistics Revenue Market Share by Type (2026-2031)
Table 28. Global Food and Beverage Cold Chain Logistics Market Size by Application (2020-2025) & (US$ Million)
Table 29. Global Food and Beverage Cold Chain Logistics Revenue Market Share by Application (2020-2025)
Table 30. Global Food and Beverage Cold Chain Logistics Forecasted Market Size by Application (2026-2031) & (US$ Million)
Table 31. Global Food and Beverage Cold Chain Logistics Revenue Market Share by Application (2026-2031)
Table 32. North America Food and Beverage Cold Chain Logistics Market Size Growth Rate by Country (US$ Million): 2020 VS 2024 VS 2031
Table 33. North America Food and Beverage Cold Chain Logistics Market Size by Country (2020-2025) & (US$ Million)
Table 34. North America Food and Beverage Cold Chain Logistics Market Size by Country (2026-2031) & (US$ Million)
Table 35. Europe Food and Beverage Cold Chain Logistics Market Size Growth Rate by Country (US$ Million): 2020 VS 2024 VS 2031
Table 36. Europe Food and Beverage Cold Chain Logistics Market Size by Country (2020-2025) & (US$ Million)
Table 37. Europe Food and Beverage Cold Chain Logistics Market Size by Country (2026-2031) & (US$ Million)
Table 38. Asia-Pacific Food and Beverage Cold Chain Logistics Market Size Growth Rate by Region (US$ Million): 2020 VS 2024 VS 2031
Table 39. Asia-Pacific Food and Beverage Cold Chain Logistics Market Size by Region (2020-2025) & (US$ Million)
Table 40. Asia-Pacific Food and Beverage Cold Chain Logistics Market Size by Region (2026-2031) & (US$ Million)
Table 41. Latin America Food and Beverage Cold Chain Logistics Market Size Growth Rate by Country (US$ Million): 2020 VS 2024 VS 2031
Table 42. Latin America Food and Beverage Cold Chain Logistics Market Size by Country (2020-2025) & (US$ Million)
Table 43. Latin America Food and Beverage Cold Chain Logistics Market Size by Country (2026-2031) & (US$ Million)
Table 44. Middle East & Africa Food and Beverage Cold Chain Logistics Market Size Growth Rate by Country (US$ Million): 2020 VS 2024 VS 2031
Table 45. Middle East & Africa Food and Beverage Cold Chain Logistics Market Size by Country (2020-2025) & (US$ Million)
Table 46. Middle East & Africa Food and Beverage Cold Chain Logistics Market Size by Country (2026-2031) & (US$ Million)
Table 47. Nichirei Logistics Group, Inc. Company Details
Table 48. Nichirei Logistics Group, Inc. Business Overview
Table 49. Nichirei Logistics Group, Inc. Food and Beverage Cold Chain Logistics Product
Table 50. Nichirei Logistics Group, Inc. Revenue in Food and Beverage Cold Chain Logistics Business (2020-2025) & (US$ Million)
Table 51. Nichirei Logistics Group, Inc. Recent Development
Table 52. Americold Logistics Company Details
Table 53. Americold Logistics Business Overview
Table 54. Americold Logistics Food and Beverage Cold Chain Logistics Product
Table 55. Americold Logistics Revenue in Food and Beverage Cold Chain Logistics Business (2020-2025) & (US$ Million)
Table 56. Americold Logistics Recent Development
Table 57. Burris Logistics Company Details
Table 58. Burris Logistics Business Overview
Table 59. Burris Logistics Food and Beverage Cold Chain Logistics Product
Table 60. Burris Logistics Revenue in Food and Beverage Cold Chain Logistics Business (2020-2025) & (US$ Million)
Table 61. Burris Logistics Recent Development
Table 62. OOCL Logistics Company Details
Table 63. OOCL Logistics Business Overview
Table 64. OOCL Logistics Food and Beverage Cold Chain Logistics Product
Table 65. OOCL Logistics Revenue in Food and Beverage Cold Chain Logistics Business (2020-2025) & (US$ Million)
Table 66. OOCL Logistics Recent Development
Table 67. Lineage Logistics Holding LLC Company Details
Table 68. Lineage Logistics Holding LLC Business Overview
Table 69. Lineage Logistics Holding LLC Food and Beverage Cold Chain Logistics Product
Table 70. Lineage Logistics Holding LLC Revenue in Food and Beverage Cold Chain Logistics Business (2020-2025) & (US$ Million)
Table 71. Lineage Logistics Holding LLC Recent Development
Table 72. AGRO Merchants Group, LLC Company Details
Table 73. AGRO Merchants Group, LLC Business Overview
Table 74. AGRO Merchants Group, LLC Food and Beverage Cold Chain Logistics Product
Table 75. AGRO Merchants Group, LLC Revenue in Food and Beverage Cold Chain Logistics Business (2020-2025) & (US$ Million)
Table 76. AGRO Merchants Group, LLC Recent Development
Table 77. United States Cold Storage Company Details
Table 78. United States Cold Storage Business Overview
Table 79. United States Cold Storage Food and Beverage Cold Chain Logistics Product
Table 80. United States Cold Storage Revenue in Food and Beverage Cold Chain Logistics Business (2020-2025) & (US$ Million)
Table 81. United States Cold Storage Recent Development
Table 82. SSI SCHAEFER Company Details
Table 83. SSI SCHAEFER Business Overview
Table 84. SSI SCHAEFER Food and Beverage Cold Chain Logistics Product
Table 85. SSI SCHAEFER Revenue in Food and Beverage Cold Chain Logistics Business (2020-2025) & (US$ Million)
Table 86. SSI SCHAEFER Recent Development
Table 87. VersaCold Logistics Services Company Details
Table 88. VersaCold Logistics Services Business Overview
Table 89. VersaCold Logistics Services Food and Beverage Cold Chain Logistics Product
Table 90. VersaCold Logistics Services Revenue in Food and Beverage Cold Chain Logistics Business (2020-2025) & (US$ Million)
Table 91. VersaCold Logistics Services Recent Development
Table 92. DHL Company Details
Table 93. DHL Business Overview
Table 94. DHL Food and Beverage Cold Chain Logistics Product
Table 95. DHL Revenue in Food and Beverage Cold Chain Logistics Business (2020-2025) & (US$ Million)
Table 96. DHL Recent Development
Table 97. AIT Company Details
Table 98. AIT Business Overview
Table 99. AIT Food and Beverage Cold Chain Logistics Product
Table 100. AIT Revenue in Food and Beverage Cold Chain Logistics Business (2020-2025) & (US$ Million)
Table 101. AIT Recent Development
Table 102. Kloosterboer Company Details
Table 103. Kloosterboer Business Overview
Table 104. Kloosterboer Food and Beverage Cold Chain Logistics Product
Table 105. Kloosterboer Revenue in Food and Beverage Cold Chain Logistics Business (2020-2025) & (US$ Million)
Table 106. Kloosterboer Recent Development
Table 107. X2 Group Company Details
Table 108. X2 Group Business Overview
Table 109. X2 Group Food and Beverage Cold Chain Logistics Product
Table 110. X2 Group Revenue in Food and Beverage Cold Chain Logistics Business (2020-2025) & (US$ Million)
Table 111. X2 Group Recent Development
Table 112. NewCold Cooperatief U.A. Company Details
Table 113. NewCold Cooperatief U.A. Business Overview
Table 114. NewCold Cooperatief U.A. Food and Beverage Cold Chain Logistics Product
Table 115. NewCold Cooperatief U.A. Revenue in Food and Beverage Cold Chain Logistics Business (2020-2025) & (US$ Million)
Table 116. NewCold Cooperatief U.A. Recent Development
Table 117. Gruppo Marconi Logistica Integrata Company Details
Table 118. Gruppo Marconi Logistica Integrata Business Overview
Table 119. Gruppo Marconi Logistica Integrata Food and Beverage Cold Chain Logistics Product
Table 120. Gruppo Marconi Logistica Integrata Revenue in Food and Beverage Cold Chain Logistics Business (2020-2025) & (US$ Million)
Table 121. Gruppo Marconi Logistica Integrata Recent Development
Table 122. CWT Limited Company Details
Table 123. CWT Limited Business Overview
Table 124. CWT Limited Food and Beverage Cold Chain Logistics Product
Table 125. CWT Limited Revenue in Food and Beverage Cold Chain Logistics Business (2020-2025) & (US$ Million)
Table 126. CWT Limited Recent Development
Table 127. Congebec Logistics Company Details
Table 128. Congebec Logistics Business Overview
Table 129. Congebec Logistics Food and Beverage Cold Chain Logistics Product
Table 130. Congebec Logistics Revenue in Food and Beverage Cold Chain Logistics Business (2020-2025) & (US$ Million)
Table 131. Congebec Logistics Recent Development
Table 132. Crystal Logistic Cool Chain Ltd Company Details
Table 133. Crystal Logistic Cool Chain Ltd Business Overview
Table 134. Crystal Logistic Cool Chain Ltd Food and Beverage Cold Chain Logistics Product
Table 135. Crystal Logistic Cool Chain Ltd Revenue in Food and Beverage Cold Chain Logistics Business (2020-2025) & (US$ Million)
Table 136. Crystal Logistic Cool Chain Ltd Recent Development
Table 137. Frialsa Frigorificos Company Details
Table 138. Frialsa Frigorificos Business Overview
Table 139. Frialsa Frigorificos Food and Beverage Cold Chain Logistics Product
Table 140. Frialsa Frigorificos Revenue in Food and Beverage Cold Chain Logistics Business (2020-2025) & (US$ Million)
Table 141. Frialsa Frigorificos Recent Development
Table 142. BioStorage Technologies (Brooks Life Sciences) Company Details
Table 143. BioStorage Technologies (Brooks Life Sciences) Business Overview
Table 144. BioStorage Technologies (Brooks Life Sciences) Food and Beverage Cold Chain Logistics Product
Table 145. BioStorage Technologies (Brooks Life Sciences) Revenue in Food and Beverage Cold Chain Logistics Business (2020-2025) & (US$ Million)
Table 146. BioStorage Technologies (Brooks Life Sciences) Recent Development
Table 147. JWD Group Company Details
Table 148. JWD Group Business Overview
Table 149. JWD Group Food and Beverage Cold Chain Logistics Product
Table 150. JWD Group Revenue in Food and Beverage Cold Chain Logistics Business (2020-2025) & (US$ Million)
Table 151. JWD Group Recent Development
Table 152. Best Cold Chain Co. Company Details
Table 153. Best Cold Chain Co. Business Overview
Table 154. Best Cold Chain Co. Food and Beverage Cold Chain Logistics Product
Table 155. Best Cold Chain Co. Revenue in Food and Beverage Cold Chain Logistics Business (2020-2025) & (US$ Million)
Table 156. Best Cold Chain Co. Recent Development
Table 157. SCG Logistics Company Details
Table 158. SCG Logistics Business Overview
Table 159. SCG Logistics Food and Beverage Cold Chain Logistics Product
Table 160. SCG Logistics Revenue in Food and Beverage Cold Chain Logistics Business (2020-2025) & (US$ Million)
Table 161. SCG Logistics Recent Development
Table 162. ColdEX Company Details
Table 163. ColdEX Business Overview
Table 164. ColdEX Food and Beverage Cold Chain Logistics Product
Table 165. ColdEX Revenue in Food and Beverage Cold Chain Logistics Business (2020-2025) & (US$ Million)
Table 166. ColdEX Recent Development
Table 167. Research Programs/Design for This Report
Table 168. Key Data Information from Secondary Sources
Table 169. Key Data Information from Primary Sources
Table 170. Authors List of This Report
List of Figures
Figure 1. Food and Beverage Cold Chain Logistics Picture
Figure 2. Global Food and Beverage Cold Chain Logistics Market Size Comparison by Type (2020-2031) & (US$ Million)
Figure 3. Global Food and Beverage Cold Chain Logistics Market Share by Type: 2024 VS 2031
Figure 4. Airways Features
Figure 5. Roadways Features
Figure 6. Seaways Features
Figure 7. Global Food and Beverage Cold Chain Logistics Market Size by Application (2020-2031) & (US$ Million)
Figure 8. Global Food and Beverage Cold Chain Logistics Market Share by Application: 2024 VS 2031
Figure 9. Food Industry Case Studies
Figure 10. Beverage Industry Case Studies
Figure 11. Food and Beverage Cold Chain Logistics Report Years Considered
Figure 12. Global Food and Beverage Cold Chain Logistics Market Size (US$ Million), Year-over-Year: 2020-2031
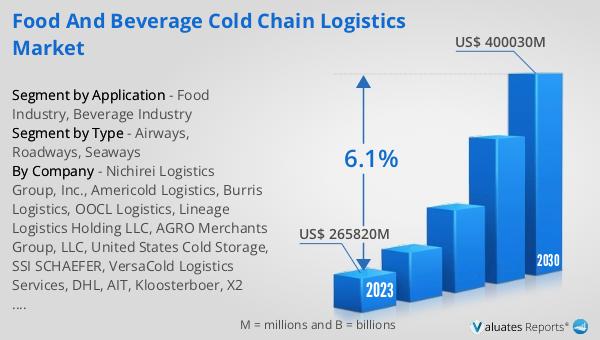
Figure 13. Global Food and Beverage Cold Chain Logistics Market Size, (US$ Million), 2020 VS 2024 VS 2031
Figure 14. Global Food and Beverage Cold Chain Logistics Market Share by Region: 2024 VS 2031
Figure 15. Global Food and Beverage Cold Chain Logistics Market Share by Players in 2024
Figure 16. Global Top Food and Beverage Cold Chain Logistics Players by Company Type (Tier 1, Tier 2, and Tier 3) & (based on the Revenue in Food and Beverage Cold Chain Logistics as of 2024)
Figure 17. The Top 10 and 5 Players Market Share by Food and Beverage Cold Chain Logistics Revenue in 2024
Figure 18. North America Food and Beverage Cold Chain Logistics Market Size YoY Growth (2020-2031) & (US$ Million)
Figure 19. North America Food and Beverage Cold Chain Logistics Market Share by Country (2020-2031)
Figure 20. United States Food and Beverage Cold Chain Logistics Market Size YoY Growth (2020-2031) & (US$ Million)
Figure 21. Canada Food and Beverage Cold Chain Logistics Market Size YoY Growth (2020-2031) & (US$ Million)
Figure 22. Europe Food and Beverage Cold Chain Logistics Market Size YoY Growth (2020-2031) & (US$ Million)
Figure 23. Europe Food and Beverage Cold Chain Logistics Market Share by Country (2020-2031)
Figure 24. Germany Food and Beverage Cold Chain Logistics Market Size YoY Growth (2020-2031) & (US$ Million)
Figure 25. France Food and Beverage Cold Chain Logistics Market Size YoY Growth (2020-2031) & (US$ Million)
Figure 26. U.K. Food and Beverage Cold Chain Logistics Market Size YoY Growth (2020-2031) & (US$ Million)
Figure 27. Italy Food and Beverage Cold Chain Logistics Market Size YoY Growth (2020-2031) & (US$ Million)
Figure 28. Russia Food and Beverage Cold Chain Logistics Market Size YoY Growth (2020-2031) & (US$ Million)
Figure 29. Nordic Countries Food and Beverage Cold Chain Logistics Market Size YoY Growth (2020-2031) & (US$ Million)
Figure 30. Asia-Pacific Food and Beverage Cold Chain Logistics Market Size YoY Growth (2020-2031) & (US$ Million)
Figure 31. Asia-Pacific Food and Beverage Cold Chain Logistics Market Share by Region (2020-2031)
Figure 32. China Food and Beverage Cold Chain Logistics Market Size YoY Growth (2020-2031) & (US$ Million)
Figure 33. Japan Food and Beverage Cold Chain Logistics Market Size YoY Growth (2020-2031) & (US$ Million)
Figure 34. South Korea Food and Beverage Cold Chain Logistics Market Size YoY Growth (2020-2031) & (US$ Million)
Figure 35. Southeast Asia Food and Beverage Cold Chain Logistics Market Size YoY Growth (2020-2031) & (US$ Million)
Figure 36. India Food and Beverage Cold Chain Logistics Market Size YoY Growth (2020-2031) & (US$ Million)
Figure 37. Australia Food and Beverage Cold Chain Logistics Market Size YoY Growth (2020-2031) & (US$ Million)
Figure 38. Latin America Food and Beverage Cold Chain Logistics Market Size YoY Growth (2020-2031) & (US$ Million)
Figure 39. Latin America Food and Beverage Cold Chain Logistics Market Share by Country (2020-2031)
Figure 40. Mexico Food and Beverage Cold Chain Logistics Market Size YoY Growth (2020-2031) & (US$ Million)
Figure 41. Brazil Food and Beverage Cold Chain Logistics Market Size YoY Growth (2020-2031) & (US$ Million)
Figure 42. Middle East & Africa Food and Beverage Cold Chain Logistics Market Size YoY Growth (2020-2031) & (US$ Million)
Figure 43. Middle East & Africa Food and Beverage Cold Chain Logistics Market Share by Country (2020-2031)
Figure 44. Turkey Food and Beverage Cold Chain Logistics Market Size YoY Growth (2020-2031) & (US$ Million)
Figure 45. Saudi Arabia Food and Beverage Cold Chain Logistics Market Size YoY Growth (2020-2031) & (US$ Million)
Figure 46. UAE Food and Beverage Cold Chain Logistics Market Size YoY Growth (2020-2031) & (US$ Million)
Figure 47. Nichirei Logistics Group, Inc. Revenue Growth Rate in Food and Beverage Cold Chain Logistics Business (2020-2025)
Figure 48. Americold Logistics Revenue Growth Rate in Food and Beverage Cold Chain Logistics Business (2020-2025)
Figure 49. Burris Logistics Revenue Growth Rate in Food and Beverage Cold Chain Logistics Business (2020-2025)
Figure 50. OOCL Logistics Revenue Growth Rate in Food and Beverage Cold Chain Logistics Business (2020-2025)
Figure 51. Lineage Logistics Holding LLC Revenue Growth Rate in Food and Beverage Cold Chain Logistics Business (2020-2025)
Figure 52. AGRO Merchants Group, LLC Revenue Growth Rate in Food and Beverage Cold Chain Logistics Business (2020-2025)
Figure 53. United States Cold Storage Revenue Growth Rate in Food and Beverage Cold Chain Logistics Business (2020-2025)
Figure 54. SSI SCHAEFER Revenue Growth Rate in Food and Beverage Cold Chain Logistics Business (2020-2025)
Figure 55. VersaCold Logistics Services Revenue Growth Rate in Food and Beverage Cold Chain Logistics Business (2020-2025)
Figure 56. DHL Revenue Growth Rate in Food and Beverage Cold Chain Logistics Business (2020-2025)
Figure 57. AIT Revenue Growth Rate in Food and Beverage Cold Chain Logistics Business (2020-2025)
Figure 58. Kloosterboer Revenue Growth Rate in Food and Beverage Cold Chain Logistics Business (2020-2025)
Figure 59. X2 Group Revenue Growth Rate in Food and Beverage Cold Chain Logistics Business (2020-2025)
Figure 60. NewCold Cooperatief U.A. Revenue Growth Rate in Food and Beverage Cold Chain Logistics Business (2020-2025)
Figure 61. Gruppo Marconi Logistica Integrata Revenue Growth Rate in Food and Beverage Cold Chain Logistics Business (2020-2025)
Figure 62. CWT Limited Revenue Growth Rate in Food and Beverage Cold Chain Logistics Business (2020-2025)
Figure 63. Congebec Logistics Revenue Growth Rate in Food and Beverage Cold Chain Logistics Business (2020-2025)
Figure 64. Crystal Logistic Cool Chain Ltd Revenue Growth Rate in Food and Beverage Cold Chain Logistics Business (2020-2025)
Figure 65. Frialsa Frigorificos Revenue Growth Rate in Food and Beverage Cold Chain Logistics Business (2020-2025)
Figure 66. BioStorage Technologies (Brooks Life Sciences) Revenue Growth Rate in Food and Beverage Cold Chain Logistics Business (2020-2025)
Figure 67. JWD Group Revenue Growth Rate in Food and Beverage Cold Chain Logistics Business (2020-2025)
Figure 68. Best Cold Chain Co. Revenue Growth Rate in Food and Beverage Cold Chain Logistics Business (2020-2025)
Figure 69. SCG Logistics Revenue Growth Rate in Food and Beverage Cold Chain Logistics Business (2020-2025)
Figure 70. ColdEX Revenue Growth Rate in Food and Beverage Cold Chain Logistics Business (2020-2025)
Figure 71. Bottom-up and Top-down Approaches for This Report
Figure 72. Data Triangulation
Figure 73. Key Executives Interviewed