List of Tables
Table 1. Global Canned Legumes Market Value by Type (US$ Million), 2025 vs 2032
Table 2. Global Canned Legumes Market Value by Packaging Format (US$ Million), 2025 vs 2032
Table 3. Global Canned Legumes Market Value by Cooking Status (US$ Million), 2025 vs 2032
Table 4. Global Canned Legumes Market Value by Application (US$ Million), 2025 vs 2032
Table 5. Global Canned Legumes Market Competitive Situation by Manufacturers in 2025
Table 6. Global Canned Legumes Sales (Kilotons) of Key Manufacturers (2021–2026)
Table 7. Global Canned Legumes Sales Market Share by Manufacturers (2021–2026)
Table 8. Global Canned Legumes Revenue (US$ Million) by Manufacturers (2021–2026)
Table 9. Global Canned Legumes Revenue Share by Manufacturers (2021–2026)
Table 10. Global Market Canned Legumes Average Price (US$/Ton) of Key Manufacturers (2021–2026)
Table 11. Global Key Players of Canned Legumes, Industry Ranking, 2023 vs 2024 vs 2025
Table 12. Global Key Manufacturers of Canned Legumes, Manufacturing Sites and Headquarters
Table 13. Global Key Manufacturers of Canned Legumes, Product Types and Applications
Table 14. Global Key Manufacturers of Canned Legumes, Date of Entry into the Industry
Table 15. Global Manufacturers Market Concentration Ratio (CR5 and HHI)
Table 16. Global Canned Legumes Companies by Tier (Tier 1, Tier 2, Tier 3), based on Canned Legumes Revenue, 2025
Table 17. Manufacturers Mergers & Acquisitions, Expansion Plans
Table 18. Global Canned Legumes Market Size by Region (US$ Million): 2021 vs 2025 vs 2032
Table 19. Global Canned Legumes Sales by Region (Kilotons), 2021–2026
Table 20. Global Canned Legumes Sales Market Share by Region (2021–2026)
Table 21. Global Canned Legumes Sales by Region (Kilotons), 2027–2032
Table 22. Global Canned Legumes Sales Market Share by Region (2027–2032)
Table 23. Global Canned Legumes Revenue by Region (US$ Million), 2021–2026
Table 24. Global Canned Legumes Revenue Market Share by Region (2021–2026)
Table 25. Global Canned Legumes Revenue by Region (US$ Million), 2027–2032
Table 26. Global Canned Legumes Revenue Market Share by Region (2027–2032)
Table 27. North America Canned Legumes Revenue by Country: 2021 vs 2025 vs 2032 (US$ Million)
Table 28. North America Canned Legumes Sales by Country (Kilotons), 2021–2026
Table 29. North America Canned Legumes Sales by Country (Kilotons), 2027–2032
Table 30. North America Canned Legumes Revenue by Country (US$ Million), 2021–2026
Table 31. North America Canned Legumes Revenue by Country (US$ Million), 2027–2032
Table 32. Europe Canned Legumes Revenue by Country: 2021 vs 2025 vs 2032 (US$ Million)
Table 33. Europe Canned Legumes Sales by Country (Kilotons), 2021–2026
Table 34. Europe Canned Legumes Sales by Country (Kilotons), 2027–2032
Table 35. Europe Canned Legumes Revenue by Country (US$ Million), 2021–2026
Table 36. Europe Canned Legumes Revenue by Country (US$ Million), 2027–2032
Table 37. Asia Pacific Canned Legumes Revenue by Region: 2021 vs 2025 vs 2032 (US$ Million)
Table 38. Asia Pacific Canned Legumes Sales by Region (Kilotons), 2021–2026
Table 39. Asia Pacific Canned Legumes Sales by Region (Kilotons), 2027–2032
Table 40. Asia Pacific Canned Legumes Revenue by Region (US$ Million), 2021–2026
Table 41. Asia Pacific Canned Legumes Revenue by Region (US$ Million), 2027–2032
Table 42. Latin America Canned Legumes Revenue by Country: 2021 vs 2025 vs 2032 (US$ Million)
Table 43. Latin America Canned Legumes Sales by Country (Kilotons), 2021–2026
Table 44. Latin America Canned Legumes Sales by Country (Kilotons), 2027–2032
Table 45. Latin America Canned Legumes Revenue by Country (US$ Million), 2021–2026
Table 46. Latin America Canned Legumes Revenue by Country (US$ Million), 2027–2032
Table 47. Middle East and Africa Canned Legumes Revenue by Country: 2021 vs 2025 vs 2032 (US$ Million)
Table 48. Middle East and Africa Canned Legumes Sales by Country (Kilotons), 2021–2026
Table 49. Middle East and Africa Canned Legumes Sales by Country (Kilotons), 2027–2032
Table 50. Middle East and Africa Canned Legumes Revenue by Country (US$ Million), 2021–2026
Table 51. Middle East and Africa Canned Legumes Revenue by Country (US$ Million), 2027–2032
Table 52. Global Canned Legumes Sales (Kilotons) by Type (2021–2026)
Table 53. Global Canned Legumes Sales (Kilotons) by Type (2027–2032)
Table 54. Global Canned Legumes Sales Market Share by Type (2021–2026)
Table 55. Global Canned Legumes Sales Market Share by Type (2027–2032)
Table 56. Global Canned Legumes Revenue (US$ Million) by Type (2021–2026)
Table 57. Global Canned Legumes Revenue (US$ Million) by Type (2027–2032)
Table 58. Global Canned Legumes Revenue Market Share by Type (2021–2026)
Table 59. Global Canned Legumes Revenue Market Share by Type (2027–2032)
Table 60. Global Canned Legumes Price (US$/Ton) by Type (2021–2026)
Table 61. Global Canned Legumes Price (US$/Ton) by Type (2027–2032)
Table 62. Global Canned Legumes Sales (Kilotons) by Application (2021–2026)
Table 63. Global Canned Legumes Sales (Kilotons) by Application (2027–2032)
Table 64. Global Canned Legumes Sales Market Share by Application (2021–2026)
Table 65. Global Canned Legumes Sales Market Share by Application (2027–2032)
Table 66. Global Canned Legumes Revenue (US$ Million) by Application (2021–2026)
Table 67. Global Canned Legumes Revenue (US$ Million) by Application (2027–2032)
Table 68. Global Canned Legumes Revenue Market Share by Application (2021–2026)
Table 69. Global Canned Legumes Revenue Market Share by Application (2027–2032)
Table 70. Global Canned Legumes Price (US$/Ton) by Application (2021–2026)
Table 71. Global Canned Legumes Price (US$/Ton) by Application (2027–2032)
Table 72. The Kraft Heinz Company Company Information
Table 73. The Kraft Heinz Company Description and Business Overview
Table 74. The Kraft Heinz Company Canned Legumes Sales (Kilotons), Revenue (US$ Million), Price (US$/Ton), and Gross Margin (2021–2026)
Table 75. The Kraft Heinz Company Canned Legumes Product
Table 76. The Kraft Heinz Company Recent Developments/Updates
Table 77. Bush Brothers & Company Company Information
Table 78. Bush Brothers & Company Description and Business Overview
Table 79. Bush Brothers & Company Canned Legumes Sales (Kilotons), Revenue (US$ Million), Price (US$/Ton), and Gross Margin (2021–2026)
Table 80. Bush Brothers & Company Canned Legumes Product
Table 81. Bush Brothers & Company Recent Developments/Updates
Table 82. Goya Foods, Inc. Company Information
Table 83. Goya Foods, Inc. Description and Business Overview
Table 84. Goya Foods, Inc. Canned Legumes Sales (Kilotons), Revenue (US$ Million), Price (US$/Ton), and Gross Margin (2021–2026)
Table 85. Goya Foods, Inc. Canned Legumes Product
Table 86. Goya Foods, Inc. Recent Developments/Updates
Table 87. Conagra Brands, Inc. Company Information
Table 88. Conagra Brands, Inc. Description and Business Overview
Table 89. Conagra Brands, Inc. Canned Legumes Sales (Kilotons), Revenue (US$ Million), Price (US$/Ton), and Gross Margin (2021–2026)
Table 90. Conagra Brands, Inc. Canned Legumes Product
Table 91. Conagra Brands, Inc. Recent Developments/Updates
Table 92. Del Monte Foods, Inc. Company Information
Table 93. Del Monte Foods, Inc. Description and Business Overview
Table 94. Del Monte Foods, Inc. Canned Legumes Sales (Kilotons), Revenue (US$ Million), Price (US$/Ton), and Gross Margin (2021–2026)
Table 95. Del Monte Foods, Inc. Canned Legumes Product
Table 96. Del Monte Foods, Inc. Recent Developments/Updates
Table 97. General Mills, Inc. Company Information
Table 98. General Mills, Inc. Description and Business Overview
Table 99. General Mills, Inc. Canned Legumes Sales (Kilotons), Revenue (US$ Million), Price (US$/Ton), and Gross Margin (2021–2026)
Table 100. General Mills, Inc. Canned Legumes Product
Table 101. General Mills, Inc. Recent Developments/Updates
Table 102. Eden Foods, Inc. Company Information
Table 103. Eden Foods, Inc. Description and Business Overview
Table 104. Eden Foods, Inc. Canned Legumes Sales (Kilotons), Revenue (US$ Million), Price (US$/Ton), and Gross Margin (2021–2026)
Table 105. Eden Foods, Inc. Canned Legumes Product
Table 106. Eden Foods, Inc. Recent Developments/Updates
Table 107. Amy's Kitchen Company Information
Table 108. Amy's Kitchen Description and Business Overview
Table 109. Amy's Kitchen Canned Legumes Sales (Kilotons), Revenue (US$ Million), Price (US$/Ton), and Gross Margin (2021–2026)
Table 110. Amy's Kitchen Canned Legumes Product
Table 111. Amy's Kitchen Recent Developments/Updates
Table 112. Faribault Foods, Inc. Company Information
Table 113. Faribault Foods, Inc. Description and Business Overview
Table 114. Faribault Foods, Inc. Canned Legumes Sales (Kilotons), Revenue (US$ Million), Price (US$/Ton), and Gross Margin (2021–2026)
Table 115. Faribault Foods, Inc. Canned Legumes Product
Table 116. Faribault Foods, Inc. Recent Developments/Updates
Table 117. Bonduelle Group Company Information
Table 118. Bonduelle Group Description and Business Overview
Table 119. Bonduelle Group Canned Legumes Sales (Kilotons), Revenue (US$ Million), Price (US$/Ton), and Gross Margin (2021–2026)
Table 120. Bonduelle Group Canned Legumes Product
Table 121. Bonduelle Group Recent Developments/Updates
Table 122. La Doria S.p.A. Company Information
Table 123. La Doria S.p.A. Description and Business Overview
Table 124. La Doria S.p.A. Canned Legumes Sales (Kilotons), Revenue (US$ Million), Price (US$/Ton), and Gross Margin (2021–2026)
Table 125. La Doria S.p.A. Canned Legumes Product
Table 126. La Doria S.p.A. Recent Developments/Updates
Table 127. Princes Limited Company Information
Table 128. Princes Limited Description and Business Overview
Table 129. Princes Limited Canned Legumes Sales (Kilotons), Revenue (US$ Million), Price (US$/Ton), and Gross Margin (2021–2026)
Table 130. Princes Limited Canned Legumes Product
Table 131. Princes Limited Recent Developments/Updates
Table 132. COFCO Corporation Company Information
Table 133. COFCO Corporation Description and Business Overview
Table 134. COFCO Corporation Canned Legumes Sales (Kilotons), Revenue (US$ Million), Price (US$/Ton), and Gross Margin (2021–2026)
Table 135. COFCO Corporation Canned Legumes Product
Table 136. COFCO Corporation Recent Developments/Updates
Table 137. Zhangzhou Gangchang Industry & Trade Co., Ltd. Company Information
Table 138. Zhangzhou Gangchang Industry & Trade Co., Ltd. Description and Business Overview
Table 139. Zhangzhou Gangchang Industry & Trade Co., Ltd. Canned Legumes Sales (Kilotons), Revenue (US$ Million), Price (US$/Ton), and Gross Margin (2021–2026)
Table 140. Zhangzhou Gangchang Industry & Trade Co., Ltd. Canned Legumes Product
Table 141. Zhangzhou Gangchang Industry & Trade Co., Ltd. Recent Developments/Updates
Table 142. Fujian Chenggong Fruits & Vegetables Food Co., Ltd. Company Information
Table 143. Fujian Chenggong Fruits & Vegetables Food Co., Ltd. Description and Business Overview
Table 144. Fujian Chenggong Fruits & Vegetables Food Co., Ltd. Canned Legumes Sales (Kilotons), Revenue (US$ Million), Price (US$/Ton), and Gross Margin (2021–2026)
Table 145. Fujian Chenggong Fruits & Vegetables Food Co., Ltd. Canned Legumes Product
Table 146. Fujian Chenggong Fruits & Vegetables Food Co., Ltd. Recent Developments/Updates
Table 147. Xiamen Jiahe Food Co., Ltd. Company Information
Table 148. Xiamen Jiahe Food Co., Ltd. Description and Business Overview
Table 149. Xiamen Jiahe Food Co., Ltd. Canned Legumes Sales (Kilotons), Revenue (US$ Million), Price (US$/Ton), and Gross Margin (2021–2026)
Table 150. Xiamen Jiahe Food Co., Ltd. Canned Legumes Product
Table 151. Xiamen Jiahe Food Co., Ltd. Recent Developments/Updates
Table 152. Maruha Nichiro Corporation Company Information
Table 153. Maruha Nichiro Corporation Description and Business Overview
Table 154. Maruha Nichiro Corporation Canned Legumes Sales (Kilotons), Revenue (US$ Million), Price (US$/Ton), and Gross Margin (2021–2026)
Table 155. Maruha Nichiro Corporation Canned Legumes Product
Table 156. Maruha Nichiro Corporation Recent Developments/Updates
Table 157. Kokubu Group Corp. (K&K brand) Company Information
Table 158. Kokubu Group Corp. (K&K brand) Description and Business Overview
Table 159. Kokubu Group Corp. (K&K brand) Canned Legumes Sales (Kilotons), Revenue (US$ Million), Price (US$/Ton), and Gross Margin (2021–2026)
Table 160. Kokubu Group Corp. (K&K brand) Canned Legumes Product
Table 161. Kokubu Group Corp. (K&K brand) Recent Developments/Updates
Table 162. Hotei Foods Corporation Company Information
Table 163. Hotei Foods Corporation Description and Business Overview
Table 164. Hotei Foods Corporation Canned Legumes Sales (Kilotons), Revenue (US$ Million), Price (US$/Ton), and Gross Margin (2021–2026)
Table 165. Hotei Foods Corporation Canned Legumes Product
Table 166. Hotei Foods Corporation Recent Developments/Updates
Table 167. Seoljeong Food Co., Ltd. Company Information
Table 168. Seoljeong Food Co., Ltd. Description and Business Overview
Table 169. Seoljeong Food Co., Ltd. Canned Legumes Sales (Kilotons), Revenue (US$ Million), Price (US$/Ton), and Gross Margin (2021–2026)
Table 170. Seoljeong Food Co., Ltd. Canned Legumes Product
Table 171. Seoljeong Food Co., Ltd. Recent Developments/Updates
Table 172. Key Raw Materials Lists
Table 173. Raw Materials Key Suppliers Lists
Table 174. Canned Legumes Distributors List
Table 175. Canned Legumes Customers List
Table 176. Canned Legumes Market Trends
Table 177. Canned Legumes Market Drivers
Table 178. Canned Legumes Market Challenges
Table 179. Canned Legumes Market Restraints
Table 180. Research Programs/Design for This Report
Table 181. Key Data Information from Secondary Sources
Table 182. Key Data Information from Primary Sources
Table 183. Authors List of This Report
List of Figures
Figure 1. Product Picture of Canned Legumes
Figure 2. Global Canned Legumes Market Value by Type (US$ Million), 2021–2032
Figure 3. Global Canned Legumes Market Share by Type: 2025 & 2032
Figure 4. Kidney Beans Product Picture
Figure 5. Black Beans Product Picture
Figure 6. Pinto Beans Product Picture
Figure 7. Navy Beans / Haricot Beans Product Picture
Figure 8. Garbanzo Beans / Chickpeas Product Picture
Figure 9. Lentils Product Picture
Figure 10. Peas Product Picture
Figure 11. Mixed Legumes Product Picture
Figure 12. Global Canned Legumes Market Value by Packaging Format (US$ Million), 2021–2032
Figure 13. Global Canned Legumes Market Share by Packaging Format: 2025 vs 2032
Figure 14. 100g / Small Single-Serve Product Picture
Figure 15. 200g / Standard Can Product Picture
Figure 16. 400g / Family Can Product Picture
Figure 17. >800g / Bulk / Foodservice Can Product Picture
Figure 18. Global Canned Legumes Market Value by Cooking Status (US$ Million), 2021–2032
Figure 19. Global Canned Legumes Market Share by Cooking Status: 2025 vs 2032
Figure 20. Fully Cooked (Ready-to-Eat) Product Picture
Figure 21. Par-Cooked (Requires Heating) Product Picture
Figure 22. Global Canned Legumes Market Value by Application (US$ Million), 2021–2032
Figure 23. Global Canned Legumes Market Share by Application: 2025 & 2032
Figure 24. Supermarkets & Hypermarkets
Figure 25. Online Retail / E-commerce
Figure 26. Convenience Stores
Figure 27. Food Service Distributors
Figure 28. Manufacturer Direct (DTC)
Figure 29. Others
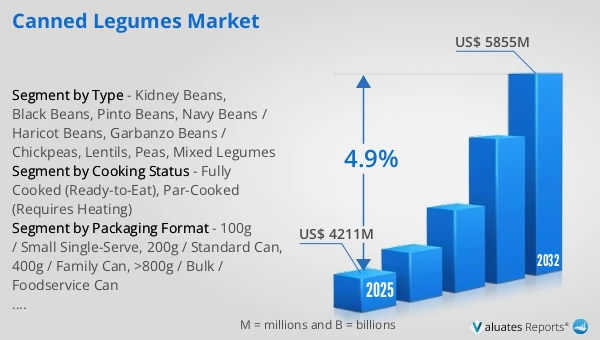
Figure 30. Global Canned Legumes Revenue, (US$ Million), 2021 vs 2025 vs 2032
Figure 31. Global Canned Legumes Market Size (US$ Million), 2021–2032
Figure 32. Global Canned Legumes Sales (Kilotons), 2021–2032
Figure 33. Global Canned Legumes Average Price (US$/Ton), 2021–2032
Figure 34. Canned Legumes Report Years Considered
Figure 35. Canned Legumes Sales Share by Manufacturers in 2025
Figure 36. Global Canned Legumes Revenue Share by Manufacturers in 2025
Figure 37. Top 5 and Top 10 Global Canned Legumes Players: Market Share by Revenue in Canned Legumes in 2025
Figure 38. Canned Legumes Market Share by Company Type (Tier 1, Tier 2, and Tier 3): 2021 vs 2025
Figure 39. Global Canned Legumes Market Size by Region (US$ Million): 2021 vs 2025 vs 2032
Figure 40. North America Canned Legumes Sales Market Share by Country (2021–2032)
Figure 41. North America Canned Legumes Revenue Market Share by Country (2021–2032)
Figure 42. United States Canned Legumes Revenue Growth Rate (US$ Million), 2021–2032
Figure 43. Canada Canned Legumes Revenue Growth Rate (US$ Million), 2021–2032
Figure 44. Europe Canned Legumes Sales Market Share by Country (2021–2032)
Figure 45. Europe Canned Legumes Revenue Market Share by Country (2021–2032)
Figure 46. Germany Canned Legumes Revenue Growth Rate (US$ Million), 2021–2032
Figure 47. France Canned Legumes Revenue Growth Rate (US$ Million), 2021–2032
Figure 48. U.K. Canned Legumes Revenue Growth Rate (US$ Million), 2021–2032
Figure 49. Italy Canned Legumes Revenue Growth Rate (US$ Million), 2021–2032
Figure 50. Russia Canned Legumes Revenue Growth Rate (US$ Million), 2021–2032
Figure 51. Asia Pacific Canned Legumes Sales Market Share by Region (2021–2032)
Figure 52. Asia Pacific Canned Legumes Revenue Market Share by Region (2021–2032)
Figure 53. China Canned Legumes Revenue Growth Rate (US$ Million), 2021–2032
Figure 54. Japan Canned Legumes Revenue Growth Rate (US$ Million), 2021–2032
Figure 55. South Korea Canned Legumes Revenue Growth Rate (US$ Million), 2021–2032
Figure 56. India Canned Legumes Revenue Growth Rate (US$ Million), 2021–2032
Figure 57. Australia Canned Legumes Revenue Growth Rate (US$ Million), 2021–2032
Figure 58. China Taiwan Canned Legumes Revenue Growth Rate (US$ Million), 2021–2032
Figure 59. Southeast Asia Canned Legumes Revenue Growth Rate (US$ Million), 2021–2032
Figure 60. Latin America Canned Legumes Sales Market Share by Country (2021–2032)
Figure 61. Latin America Canned Legumes Revenue Market Share by Country (2021–2032)
Figure 62. Mexico Canned Legumes Revenue Growth Rate (US$ Million), 2021–2032
Figure 63. Brazil Canned Legumes Revenue Growth Rate (US$ Million), 2021–2032
Figure 64. Argentina Canned Legumes Revenue Growth Rate (US$ Million), 2021–2032
Figure 65. Colombia Canned Legumes Revenue Growth Rate (US$ Million), 2021–2032
Figure 66. Middle East and Africa Canned Legumes Sales Market Share by Country (2021–2032)
Figure 67. Middle East and Africa Canned Legumes Revenue Market Share by Country (2021–2032)
Figure 68. Turkey Canned Legumes Revenue Growth Rate (US$ Million), 2021–2032
Figure 69. Saudi Arabia Canned Legumes Revenue Growth Rate (US$ Million), 2021–2032
Figure 70. UAE Canned Legumes Revenue Growth Rate (US$ Million), 2021–2032
Figure 71. Global Sales Market Share of Canned Legumes by Type (2021–2032)
Figure 72. Global Revenue Market Share of Canned Legumes by Type (2021–2032)
Figure 73. Global Canned Legumes Price (US$/Ton) by Type (2021–2032)
Figure 74. Global Sales Market Share of Canned Legumes by Application (2021–2032)
Figure 75. Global Revenue Market Share of Canned Legumes by Application (2021–2032)
Figure 76. Global Canned Legumes Price (US$/Ton) by Application (2021–2032)
Figure 77. Canned Legumes Value Chain
Figure 78. Channels of Distribution (Direct Vs Distribution)
Figure 79. Bottom-up and Top-down Approaches for This Report
Figure 80. Data Triangulation
Figure 81. Key Executives Interviewed