List of Tables
Table 1. Global Antibody-oligonucleotide Conjugates (AOCs) Market Size Growth Rate by Type (2026-2032) & (US$ Million)
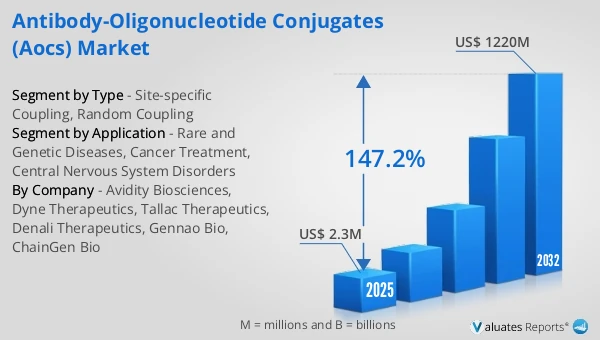
Table 2. Key Players of Site-specific Coupling
Table 3. Key Players of Random Coupling
Table 4. Global Antibody-oligonucleotide Conjugates (AOCs) Market Size Growth by Application (2026-2032) & (US$ Million)
Table 5. Global Antibody-oligonucleotide Conjugates (AOCs) Market Size by Region (2026-2032) & (US$ Million)
Table 6. Global Antibody-oligonucleotide Conjugates (AOCs) Market Size by Region (2026-2032) & (US$ Million)
Table 7. Global Antibody-oligonucleotide Conjugates (AOCs) Market Share by Region (2026-2032)
Table 8. Market Top Trends
Table 9. Market Use Cases
Table 10. Global Antibody-oligonucleotide Conjugates (AOCs) Revenue by Players (2026 & 2032) & (US$ Million)
Table 11. Global Antibody-oligonucleotide Conjugates (AOCs) Market Share by Players (2026 & 2032)
Table 12. Key Players Headquarters and Area Served
Table 13. Key Players Antibody-oligonucleotide Conjugates (AOCs) Product/Solution/Service
Table 14. Date of Enter into Antibody-oligonucleotide Conjugates (AOCs) Market
Table 15. Mergers & Acquisitions, Expansion Plans
Table 16. Global Antibody-oligonucleotide Conjugates (AOCs) Market Size by Type (2026-2032) & (US$ Million)
Table 17. Global Antibody-oligonucleotide Conjugates (AOCs) Market Size Share by Type (2026-2032)
Table 18. Global Antibody-oligonucleotide Conjugates (AOCs) Market Size by Application (2026-2032) & (US$ Million)
Table 19. Global Antibody-oligonucleotide Conjugates (AOCs) Market Size Share by Application (2026-2032)
Table 20. North America Key Players Antibody-oligonucleotide Conjugates (AOCs) Revenue (2026 & 2032) & (US$ Million)
Table 21. North America Key Players Antibody-oligonucleotide Conjugates (AOCs) Market Share (2026 & 2032)
Table 22. North America Antibody-oligonucleotide Conjugates (AOCs) Market Size by Type (2026-2032) & (US$ Million)
Table 23. North America Antibody-oligonucleotide Conjugates (AOCs) Market Share by Type (2026-2032)
Table 24. North America Antibody-oligonucleotide Conjugates (AOCs) Market Size by Application (2026-2032) & (US$ Million)
Table 25. North America Antibody-oligonucleotide Conjugates (AOCs) Market Share by Application (2026-2032)
Table 26. Europe Key Players Antibody-oligonucleotide Conjugates (AOCs) Revenue (2026 & 2032) & (US$ Million)
Table 27. Europe Key Players Antibody-oligonucleotide Conjugates (AOCs) Market Share (2026 & 2032)
Table 28. Europe Antibody-oligonucleotide Conjugates (AOCs) Market Size by Type (2026-2032) & (US$ Million)
Table 29. Europe Antibody-oligonucleotide Conjugates (AOCs) Market Share by Type (2026-2032)
Table 30. Europe Antibody-oligonucleotide Conjugates (AOCs) Market Size by Application (2026-2032) & (US$ Million)
Table 31. Europe Antibody-oligonucleotide Conjugates (AOCs) Market Share by Application (2026-2032)
Table 32. China Key Players Antibody-oligonucleotide Conjugates (AOCs) Revenue (2026 & 2032) & (US$ Million)
Table 33. China Key Players Antibody-oligonucleotide Conjugates (AOCs) Market Share (2026 & 2032)
Table 34. China Antibody-oligonucleotide Conjugates (AOCs) Market Size by Type (2026-2032) & (US$ Million)
Table 35. China Antibody-oligonucleotide Conjugates (AOCs) Market Share by Type (2026-2032)
Table 36. China Antibody-oligonucleotide Conjugates (AOCs) Market Size by Application (2026-2032) & (US$ Million)
Table 37. China Antibody-oligonucleotide Conjugates (AOCs) Market Share by Application (2026-2032)
Table 38. Key Players in Japan
Table 39. Avidity Biosciences Company Details
Table 40. Avidity Biosciences Description and Business Overview
Table 41. Avidity Biosciences Antibody-oligonucleotide Conjugates (AOCs) Product
Table 42. Avidity Biosciences Revenue in Antibody-oligonucleotide Conjugates (AOCs) Business: 2026 & 2032
Table 43. Avidity Biosciences Recent Development
Table 44. Dyne Therapeutics Company Details
Table 45. Dyne Therapeutics Description and Business Overview
Table 46. Dyne Therapeutics Antibody-oligonucleotide Conjugates (AOCs) Product
Table 47. Dyne Therapeutics Revenue in Antibody-oligonucleotide Conjugates (AOCs) Business: 2026 & 2032
Table 48. Dyne Therapeutics Recent Development
Table 49. Tallac Therapeutics Company Details
Table 50. Tallac Therapeutics Description and Business Overview
Table 51. Tallac Therapeutics Antibody-oligonucleotide Conjugates (AOCs) Product
Table 52. Tallac Therapeutics Revenue in Antibody-oligonucleotide Conjugates (AOCs) Business: 2026 & 2032
Table 53. Tallac Therapeutics Recent Development
Table 54. Denali Therapeutics Company Details
Table 55. Denali Therapeutics Description and Business Overview
Table 56. Denali Therapeutics Antibody-oligonucleotide Conjugates (AOCs) Product
Table 57. Denali Therapeutics Revenue in Antibody-oligonucleotide Conjugates (AOCs) Business: 2026 & 2032
Table 58. Denali Therapeutics Recent Development
Table 59. Gennao Bio Company Details
Table 60. Gennao Bio Description and Business Overview
Table 61. Gennao Bio Antibody-oligonucleotide Conjugates (AOCs) Product
Table 62. Gennao Bio Revenue in Antibody-oligonucleotide Conjugates (AOCs) Business: 2026 & 2032
Table 63. Gennao Bio Recent Development
Table 64. ChainGen Bio Company Details
Table 65. ChainGen Bio Description and Business Overview
Table 66. ChainGen Bio Antibody-oligonucleotide Conjugates (AOCs) Product
Table 67. ChainGen Bio Revenue in Antibody-oligonucleotide Conjugates (AOCs) Business: 2026 & 2032
Table 68. ChainGen Bio Recent Development
Table 69. Antibody-oligonucleotide Conjugates (AOCs) Market Trends
Table 70. Antibody-oligonucleotide Conjugates (AOCs) Market Drivers
Table 71. Antibody-oligonucleotide Conjugates (AOCs) Market Challenges
Table 72. Antibody-oligonucleotide Conjugates (AOCs) Market Restraints
Table 73. Research Programs/Design for This Report
Table 74. Key Data Information from Secondary Sources
Table 75. Key Data Information from Primary Sources
List of Figures
Figure 1. Global Antibody-oligonucleotide Conjugates (AOCs) Market Share by Type in 2026 & 2032
Figure 2. Site-specific Coupling Features
Figure 3. Random Coupling Features
Figure 4. Global Antibody-oligonucleotide Conjugates (AOCs) Market Share by Application in 2026 & 2032
Figure 5. Rare and Genetic Diseases Case Studies
Figure 6. Cancer Treatment Case Studies
Figure 7. Central Nervous System Disorders Case Studies
Figure 8. Antibody-oligonucleotide Conjugates (AOCs) Report Years Considered
Figure 9. Global Antibody-oligonucleotide Conjugates (AOCs) Market Size and Growth Rate 2026-2032 (US$ Million)
Figure 10. Global Antibody-oligonucleotide Conjugates (AOCs) Market Share by Region (2026-2032)
Figure 11. Global Antibody-oligonucleotide Conjugates (AOCs) Market Size Market Share by Type (2026-2032)
Figure 12. North America Antibody-oligonucleotide Conjugates (AOCs) Market Size 2026-2032 (US$ Million)
Figure 13. Europe Antibody-oligonucleotide Conjugates (AOCs) Market Size 2026-2032 (US$ Million)
Figure 14. China Antibody-oligonucleotide Conjugates (AOCs) Market Size 2026-2032 (US$ Million)
Figure 15. Antibody-oligonucleotide Conjugates (AOCs) Market Size in Japan (2026-2032) & (US$ Million)
Figure 16. Bottom-up and Top-down Approaches for This Report
Figure 17. Data Triangulation
Figure 18. Key Executives Interviewed