1 Market Overview
1.1 Hydrolyzed Elastin Product Introduction
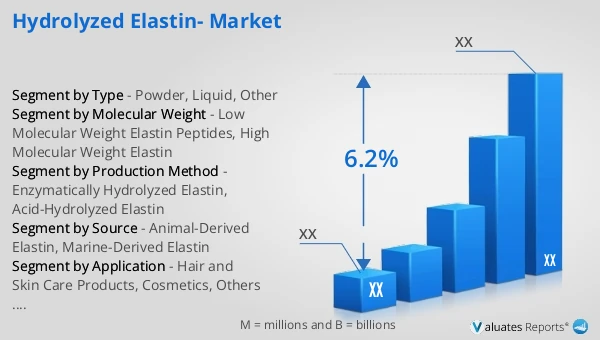
1.2 Global Hydrolyzed Elastin Market Size Forecast
1.2.1 Global Hydrolyzed Elastin Sales Value (2021–2032)
1.2.2 Global Hydrolyzed Elastin Sales Volume (2021–2032)
1.2.3 Global Hydrolyzed Elastin Sales Price (2021–2032)
1.3 Hydrolyzed Elastin Market Trends & Drivers
1.3.1 Hydrolyzed Elastin Industry Trends
1.3.2 Hydrolyzed Elastin Market Drivers & Opportunities
1.3.3 Hydrolyzed Elastin Market Challenges
1.3.4 Hydrolyzed Elastin Market Restraints
1.3.5 Impact of U.S. Tariffs
1.4 Assumptions and Limitations
1.5 Study Objectives
1.6 Years Considered
2 Competitive Analysis by Company
2.1 Global Hydrolyzed Elastin Players Revenue Ranking (2025)
2.2 Global Hydrolyzed Elastin Revenue by Company (2021–2026)
2.3 Global Hydrolyzed Elastin Sales Volume Ranking of Players (2025)
2.4 Global Hydrolyzed Elastin Sales Volume by Company (2021–2026)
2.5 Global Hydrolyzed Elastin Average Price by Company (2021–2026)
2.6 Key Manufacturers Hydrolyzed Elastin Manufacturing Base and Headquarters
2.7 Key Manufacturers Hydrolyzed Elastin Product Offerings
2.8 Key Manufacturers Start of Mass Production of Hydrolyzed Elastin
2.9 Hydrolyzed Elastin Market Competitive Analysis
2.9.1 Hydrolyzed Elastin Market Concentration Rate (2021–2026)
2.9.2 Global 5 and 10 Largest Manufacturers by Hydrolyzed Elastin Revenue in 2025
2.9.3 Global Companies by Tier (Tier 1, Tier 2, Tier 3), based on Hydrolyzed Elastin revenue, 2025
2.10 Mergers & Acquisitions and Expansion
3 Segmentation Hydrolyzed Elastin Market Classification
3.1 Introduction by Type
3.1.1 Powder
3.1.2 Liquid
3.1.3 Other
3.1.4 Global Hydrolyzed Elastin Sales Value by Type
3.1.4.1 Global Hydrolyzed Elastin Sales Value by Type (2021 vs 2025 vs 2032)
3.1.4.2 Global Hydrolyzed Elastin Sales Value, by Type (2021–2032)
3.1.4.3 Global Hydrolyzed Elastin Sales Value, by Type (%), 2021–2032
3.1.5 Global Hydrolyzed Elastin Sales Volume by Type
3.1.5.1 Global Hydrolyzed Elastin Sales Volume by Type (2021 vs 2025 vs 2032)
3.1.5.2 Global Hydrolyzed Elastin Sales Volume, by Type (2021–2032)
3.1.5.3 Global Hydrolyzed Elastin Sales Volume, by Type (%), 2021–2032
3.1.6 Global Hydrolyzed Elastin Average Price by Type (2021–2032)
3.2 Introduction by Source
3.2.1 Animal-Derived Elastin
3.2.2 Marine-Derived Elastin
3.2.3 Global Hydrolyzed Elastin Sales Value by Source
3.2.3.1 Global Hydrolyzed Elastin Sales Value by Source (2021 vs 2025 vs 2032)
3.2.3.2 Global Hydrolyzed Elastin Sales Value, by Source (2021–2032)
3.2.3.3 Global Hydrolyzed Elastin Sales Value, by Source (%), 2021–2032
3.2.4 Global Hydrolyzed Elastin Sales Volume by Source
3.2.4.1 Global Hydrolyzed Elastin Sales Volume by Source (2021 vs 2025 vs 2032)
3.2.4.2 Global Hydrolyzed Elastin Sales Volume, by Source (2021–2032)
3.2.4.3 Global Hydrolyzed Elastin Sales Volume, by Source (%), 2021–2032
3.2.5 Global Hydrolyzed Elastin Average Price by Source (2021–2032)
3.3 Introduction by Molecular Weight
3.3.1 Low Molecular Weight Elastin Peptides
3.3.2 High Molecular Weight Elastin
3.3.3 Global Hydrolyzed Elastin Sales Value by Molecular Weight
3.3.3.1 Global Hydrolyzed Elastin Sales Value by Molecular Weight (2021 vs 2025 vs 2032)
3.3.3.2 Global Hydrolyzed Elastin Sales Value, by Molecular Weight (2021–2032)
3.3.3.3 Global Hydrolyzed Elastin Sales Value, by Molecular Weight (%), 2021–2032
3.3.4 Global Hydrolyzed Elastin Sales Volume by Molecular Weight
3.3.4.1 Global Hydrolyzed Elastin Sales Volume by Molecular Weight (2021 vs 2025 vs 2032)
3.3.4.2 Global Hydrolyzed Elastin Sales Volume, by Molecular Weight (2021–2032)
3.3.4.3 Global Hydrolyzed Elastin Sales Volume, by Molecular Weight (%), 2021–2032
3.3.5 Global Hydrolyzed Elastin Average Price by Molecular Weight (2021–2032)
3.4 Introduction by Production Method
3.4.1 Enzymatically Hydrolyzed Elastin
3.4.2 Acid-Hydrolyzed Elastin
3.4.3 Global Hydrolyzed Elastin Sales Value by Production Method
3.4.3.1 Global Hydrolyzed Elastin Sales Value by Production Method (2021 vs 2025 vs 2032)
3.4.3.2 Global Hydrolyzed Elastin Sales Value, by Production Method (2021–2032)
3.4.3.3 Global Hydrolyzed Elastin Sales Value, by Production Method (%), 2021–2032
3.4.4 Global Hydrolyzed Elastin Sales Volume by Production Method
3.4.4.1 Global Hydrolyzed Elastin Sales Volume by Production Method (2021 vs 2025 vs 2032)
3.4.4.2 Global Hydrolyzed Elastin Sales Volume, by Production Method (2021–2032)
3.4.4.3 Global Hydrolyzed Elastin Sales Volume, by Production Method (%), 2021–2032
3.4.5 Global Hydrolyzed Elastin Average Price by Production Method (2021–2032)
4 Segmentation by Application
4.1 Introduction by Application
4.1.1 Hair and Skin Care Products
4.1.2 Cosmetics
4.1.3 Others
4.2 Global Hydrolyzed Elastin Sales Value by Application
4.2.1 Global Hydrolyzed Elastin Sales Value by Application (2021 vs 2025 vs 2032)
4.2.2 Global Hydrolyzed Elastin Sales Value, by Application (2021–2032)
4.2.3 Global Hydrolyzed Elastin Sales Value, by Application (%), 2021–2032
4.3 Global Hydrolyzed Elastin Sales Volume by Application
4.3.1 Global Hydrolyzed Elastin Sales Volume by Application (2021 vs 2025 vs 2032)
4.3.2 Global Hydrolyzed Elastin Sales Volume, by Application (2021–2032)
4.3.3 Global Hydrolyzed Elastin Sales Volume, by Application (%), 2021–2032
4.4 Global Hydrolyzed Elastin Average Price by Application (2021–2032)
5 Segmentation by Region
5.1 Global Hydrolyzed Elastin Sales Value by Region
5.1.1 Global Hydrolyzed Elastin Sales Value by Region: 2021 vs 2025 vs 2032
5.1.2 Global Hydrolyzed Elastin Sales Value by Region (2021–2026)
5.1.3 Global Hydrolyzed Elastin Sales Value by Region (2027–2032)
5.1.4 Global Hydrolyzed Elastin Sales Value by Region (%), 2021–2032
5.2 Global Hydrolyzed Elastin Sales Volume by Region
5.2.1 Global Hydrolyzed Elastin Sales Volume by Region: 2021 vs 2025 vs 2032
5.2.2 Global Hydrolyzed Elastin Sales Volume by Region (2021–2026)
5.2.3 Global Hydrolyzed Elastin Sales Volume by Region (2027–2032)
5.2.4 Global Hydrolyzed Elastin Sales Volume by Region (%), 2021–2032
5.3 Global Hydrolyzed Elastin Average Price by Region (2021–2032)
5.4 North America
5.4.1 North America Hydrolyzed Elastin Sales Value, 2021–2032
5.4.2 North America Hydrolyzed Elastin Sales Value by Country (%), 2025 vs 2032
5.5 Europe
5.5.1 Europe Hydrolyzed Elastin Sales Value, 2021–2032
5.5.2 Europe Hydrolyzed Elastin Sales Value by Country (%), 2025 vs 2032
5.6 Asia Pacific
5.6.1 Asia Pacific Hydrolyzed Elastin Sales Value, 2021–2032
5.6.2 Asia Pacific Hydrolyzed Elastin Sales Value by Region (%), 2025 vs 2032
5.7 South America
5.7.1 South America Hydrolyzed Elastin Sales Value, 2021–2032
5.7.2 South America Hydrolyzed Elastin Sales Value by Country (%), 2025 vs 2032
5.8 Middle East & Africa
5.8.1 Middle East & Africa Hydrolyzed Elastin Sales Value, 2021–2032
5.8.2 Middle East & Africa Hydrolyzed Elastin Sales Value by Country (%), 2025 vs 2032
6 Segmentation by Key Countries/Regions
6.1 Key Countries/Regions Hydrolyzed Elastin Sales Value Growth Trends, 2021 vs 2025 vs 2032
6.2 Key Countries/Regions Hydrolyzed Elastin Sales Value and Sales Volume
6.2.1 Key Countries/Regions Hydrolyzed Elastin Sales Value, 2021–2032
6.2.2 Key Countries/Regions Hydrolyzed Elastin Sales Volume, 2021–2032
6.3 United States
6.3.1 United States Hydrolyzed Elastin Sales Value, 2021–2032
6.3.2 United States Hydrolyzed Elastin Sales Value by Type (%), 2025 vs 2032
6.3.3 United States Hydrolyzed Elastin Sales Value by Application, 2025 vs 2032
6.4 Europe
6.4.1 Europe Hydrolyzed Elastin Sales Value, 2021–2032
6.4.2 Europe Hydrolyzed Elastin Sales Value by Type (%), 2025 vs 2032
6.4.3 Europe Hydrolyzed Elastin Sales Value by Application, 2025 vs 2032
6.5 China
6.5.1 China Hydrolyzed Elastin Sales Value, 2021–2032
6.5.2 China Hydrolyzed Elastin Sales Value by Type (%), 2025 vs 2032
6.5.3 China Hydrolyzed Elastin Sales Value by Application, 2025 vs 2032
6.6 Japan
6.6.1 Japan Hydrolyzed Elastin Sales Value, 2021–2032
6.6.2 Japan Hydrolyzed Elastin Sales Value by Type (%), 2025 vs 2032
6.6.3 Japan Hydrolyzed Elastin Sales Value by Application, 2025 vs 2032
6.7 South Korea
6.7.1 South Korea Hydrolyzed Elastin Sales Value, 2021–2032
6.7.2 South Korea Hydrolyzed Elastin Sales Value by Type (%), 2025 vs 2032
6.7.3 South Korea Hydrolyzed Elastin Sales Value by Application, 2025 vs 2032
6.8 Southeast Asia
6.8.1 Southeast Asia Hydrolyzed Elastin Sales Value, 2021–2032
6.8.2 Southeast Asia Hydrolyzed Elastin Sales Value by Type (%), 2025 vs 2032
6.8.3 Southeast Asia Hydrolyzed Elastin Sales Value by Application, 2025 vs 2032
6.9 India
6.9.1 India Hydrolyzed Elastin Sales Value, 2021–2032
6.9.2 India Hydrolyzed Elastin Sales Value by Type (%), 2025 vs 2032
6.9.3 India Hydrolyzed Elastin Sales Value by Application, 2025 vs 2032
7 Company Profiles
7.1 BASF
7.1.1 BASF Company Information
7.1.2 BASF Introduction and Business Overview
7.1.3 BASF Hydrolyzed Elastin Sales, Revenue, Price and Gross Margin (2021–2026)
7.1.4 BASF Hydrolyzed Elastin Product Offerings
7.1.5 BASF Recent Developments
7.2 Active Concepts
7.2.1 Active Concepts Company Information
7.2.2 Active Concepts Introduction and Business Overview
7.2.3 Active Concepts Hydrolyzed Elastin Sales, Revenue, Price and Gross Margin (2021–2026)
7.2.4 Active Concepts Hydrolyzed Elastin Product Offerings
7.2.5 Active Concepts Recent Developments
7.3 AQIA
7.3.1 AQIA Company Information
7.3.2 AQIA Introduction and Business Overview
7.3.3 AQIA Hydrolyzed Elastin Sales, Revenue, Price and Gross Margin (2021–2026)
7.3.4 AQIA Hydrolyzed Elastin Product Offerings
7.3.5 AQIA Recent Developments
7.4 Chemir
7.4.1 Chemir Company Information
7.4.2 Chemir Introduction and Business Overview
7.4.3 Chemir Hydrolyzed Elastin Sales, Revenue, Price and Gross Margin (2021–2026)
7.4.4 Chemir Hydrolyzed Elastin Product Offerings
7.4.5 Chemir Recent Developments
7.5 Dermalab
7.5.1 Dermalab Company Information
7.5.2 Dermalab Introduction and Business Overview
7.5.3 Dermalab Hydrolyzed Elastin Sales, Revenue, Price and Gross Margin (2021–2026)
7.5.4 Dermalab Hydrolyzed Elastin Product Offerings
7.5.5 Dermalab Recent Developments
7.6 Lonza
7.6.1 Lonza Company Information
7.6.2 Lonza Introduction and Business Overview
7.6.3 Lonza Hydrolyzed Elastin Sales, Revenue, Price and Gross Margin (2021–2026)
7.6.4 Lonza Hydrolyzed Elastin Product Offerings
7.6.5 Lonza Recent Developments
7.7 CLR Berlin
7.7.1 CLR Berlin Company Information
7.7.2 CLR Berlin Introduction and Business Overview
7.7.3 CLR Berlin Hydrolyzed Elastin Sales, Revenue, Price and Gross Margin (2021–2026)
7.7.4 CLR Berlin Hydrolyzed Elastin Product Offerings
7.7.5 CLR Berlin Recent Developments
7.8 BioOrganic Concepts
7.8.1 BioOrganic Concepts Company Information
7.8.2 BioOrganic Concepts Introduction and Business Overview
7.8.3 BioOrganic Concepts Hydrolyzed Elastin Sales, Revenue, Price and Gross Margin (2021–2026)
7.8.4 BioOrganic Concepts Hydrolyzed Elastin Product Offerings
7.8.5 BioOrganic Concepts Recent Developments
7.9 Cobiosa
7.9.1 Cobiosa Company Information
7.9.2 Cobiosa Introduction and Business Overview
7.9.3 Cobiosa Hydrolyzed Elastin Sales, Revenue, Price and Gross Margin (2021–2026)
7.9.4 Cobiosa Hydrolyzed Elastin Product Offerings
7.9.5 Cobiosa Recent Developments
7.10 Biogründl
7.10.1 Biogründl Company Information
7.10.2 Biogründl Introduction and Business Overview
7.10.3 Biogründl Hydrolyzed Elastin Sales, Revenue, Price and Gross Margin (2021–2026)
7.10.4 Biogründl Hydrolyzed Elastin Product Offerings
7.10.5 Biogründl Recent Developments
7.11 GfN
7.11.1 GfN Company Information
7.11.2 GfN Introduction and Business Overview
7.11.3 GfN Hydrolyzed Elastin Sales, Revenue, Price and Gross Margin (2021–2026)
7.11.4 GfN Hydrolyzed Elastin Product Offerings
7.11.5 GfN Recent Developments
8 Industry Chain Analysis
8.1 Hydrolyzed Elastin Industrial Chain
8.2 Hydrolyzed Elastin Upstream Analysis
8.2.1 Key Raw Materials
8.2.2 Key Suppliers of Raw Materials
8.2.3 Manufacturing Cost Structure
8.3 Midstream Analysis
8.4 Downstream Analysis (Customer Analysis)
8.5 Sales Model and Sales Channelss
8.5.1 Hydrolyzed Elastin Sales Model
8.5.2 Sales Channels
8.5.3 Hydrolyzed Elastin Distributors
9 Research Findings and Conclusion
10 Appendix
10.1 Research Methodology
10.1.1 Methodology/Research Approach
10.1.1.1 Research Programs/Design
10.1.1.2 Market Size Estimation
10.1.1.3 Market Breakdown and Data Triangulation
10.1.2 Data Source
10.1.2.1 Secondary Sources
10.1.2.2 Primary Sources
10.2 Author Details
10.3 Disclaimer