
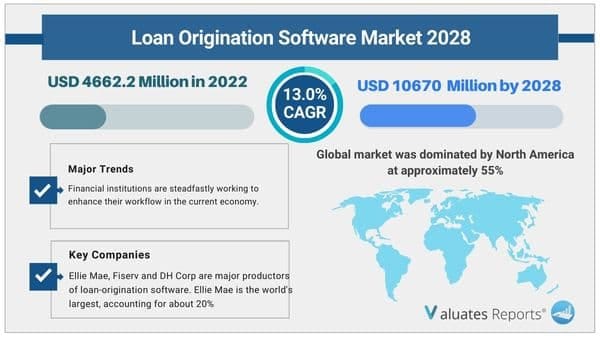
Considering the economic change due to COVID-19 and Russia-Ukraine War Influence, the global Loan Origination Software market is projected to reach USD 10670 Million by 2028 from an estimated USD 4662.2 Million in 2022, at a CAGR of 14.8% during 2023 and 2028.
This report studies the Loan Origination Software market. Loan Origination Software manages lending tasks including origination, underwriting, closing and documentation for contract servicers, title companies, credit unions, government agencies and private lenders.
Ellie Mae, Fiserv and DH Corp are major productors of loan-origination software. Ellie Mae is the world's largest, accounting for about 20%, and the top three accounted for about 35%. North America market took up about 55% the global market, while Europe and Asia-Pacific were about 23%, 15%.
With industry-standard accuracy in analysis and high data integrity, the report makes a brilliant attempt to unveil key opportunities available in the global Loan Origination Software market to help players in achieving a strong market position. Buyers of the report can access verified and reliable market forecasts, including those for the overall size of the global Loan Origination Software market in terms of revenue.
Overall, the report proves to be an effective tool that players can use to gain a competitive edge over their competitors and ensure lasting success in the global Loan Origination Software market. All of the findings, data, and information provided in the report are validated and revalidated with the help of trustworthy sources. The analysts who have authored the report took a unique and industry-best research and analysis approach for an in-depth study of the global Loan Origination Software market.
This section of the report has explored the overall status of the Covid scenario and has offered valuable insights into the changes in supply chain disruption, fluctuations in demand, etc. The analysts have also focused on the key measures that the companies are opting to withstand the harsh scenario.
The report has been segmented into product and application segments. The researchers have documented all the products present today in the Loan Origination Software market. They have also shed light on the new product innovations and launches by the key players. In the segmental analysis, the analysts have provided revenue forecast figures based on type and application for the period 2017-2028. They have also discussed about the growth rate and potential of each segment for the period 2017-2028.
| Report Metric | Details |
| Report Name | Loan Origination Software Market |
| The market size in 2022 | USD 4662.2 Million |
| The revenue forecast in 2028 | USD 10670 Million |
| Growth Rate | CAGR of 14.8% |
| Market size available for years | 2023-2028 |
| Forecast units | Value (USD) |
| Segments covered | Type, Application, Industry, Regions |
| Report coverage | Revenue & volume forecast, company share, competitive landscape, growth factors, and trends |
| Geographic regions covered | North America, Europe, Asia Pacific, Latin America, Middle East & Africa |
Ans. Yes, we do provide the option to buy chapters in a report. We also can customize the report based on your specific requirements.
Ans. Considering the economic change due to COVID-19 and Russia-Ukraine War Influence, the global Loan Origination Software market is projected to reach US$ 10670 million by 2028 from an estimated US$ 4662.2 million in 2022, at a CAGR of 14.8% during 2023 and 2028.
Ans. Ellie Mae, Fiserv and DH Corp are major productors of loan-origination software. Ellie Mae is the world's largest, accounting for about 20%, and the top three accounted for about 35%.
Ans. Yes, the report includes a COVID-19 impact analysis. Also, it is further extended into every individual segment of the report.
Ans. North America market took up about 55% the global market, while Europe and Asia-Pacific were about 23%, 15%.
List of Tables
Table 1. Global Loan Origination Software Market Size Growth Rate by Type (US$ Million): 2017 VS 2021 VS 2028
Table 2. Major Companies of Cloud Based
Table 3. Major Companies of On-premise
Table 4. Global Loan Origination Software Market Size Growth by Application (US$ Million): 2017 VS 2021 VS 2028
Table 5. Global Loan Origination Software Market Size by Region (US$ Million): 2022 VS 2028
Table 6. Global Loan Origination Software Revenue by Region (2017-2022) & (US$ Million)
Table 7. Global Loan Origination Software Revenue Forecast by Region (2023-2028) & (US$ Million)
Table 8. Loan Origination Software Revenue by Company (2017-2022) & (US$ Million)
Table 9. Loan Origination Software Revenue Share by Company (2017-2022)
Table 10. Ranking of Global Top Loan Origination Software Players by Revenue (US$ Million) in 2021
Table 11. Global Loan Origination Software Companies Market Concentration Ratio (CR5 and HHI) & (2017-2022)
Table 12. Global Loan Origination Software by Company Type (Tier 1, Tier 2 and Tier 3) & (based on the Revenue in Loan Origination Software as of 2021)
Table 13. Global Loan Origination Software Companies Headquarters
Table 14. Global Loan Origination Software Companies Product & Service
Table 15. Date of International Companies Enter into Loan Origination Software Market
Table 16. Global Loan Origination Software Mergers & Acquisitions, Expansion Plans
Table 17. Ellie Mae Corporation Information
Table 18. Ellie Mae Description and Business Overview
Table 19. Ellie Mae Loan Origination Software Revenue (US$ Million) and Gross Margin (2017-2022)
Table 20. Ellie Mae Loan Origination Software Product
Table 21. Ellie Mae Loan Origination Software Revenue Proportion of Loan Origination Software by Product in 2021
Table 22. Ellie Mae Loan Origination Software Revenue Proportion of Loan Origination Software by Application in 2021
Table 23. Ellie Mae Loan Origination Software Revenue Proportion of Loan Origination Software by Geographic Area in 2021
Table 24. Ellie Mae Recent Development
Table 25. Calyx Software Corporation Information
Table 26. Calyx Software Description and Business Overview
Table 27. Calyx Software Loan Origination Software Revenue (US$ Million) and Gross Margin (2017-2022)
Table 28. Calyx Software Loan Origination Software Product
Table 29. Calyx Software Loan Origination Software Revenue Proportion of Loan Origination Software by Product in 2021
Table 30. Calyx Software Loan Origination Software Revenue Proportion of Loan Origination Software by Application in 2021
Table 31. Calyx Software Loan Origination Software Revenue Proportion of Loan Origination Software by Geographic Area in 2021
Table 32. Calyx Software Recent Development
Table 33. FICS Corporation Information
Table 34. FICS Description and Business Overview
Table 35. FICS Loan Origination Software Revenue (US$ Million) and Gross Margin (2017-2022)
Table 36. FICS Loan Origination Software Product
Table 37. FICS Loan Origination Software Revenue Proportion of Loan Origination Software by Product in 2021
Table 38. FICS Loan Origination Software Revenue Proportion of Loan Origination Software by Application in 2021
Table 39. FICS Loan Origination Software Revenue Proportion of Loan Origination Software by Geographic Area in 2021
Table 40. FICS Recent Development
Table 41. Fiserv Corporation Information
Table 42. Fiserv Description and Business Overview
Table 43. Fiserv Loan Origination Software Revenue (US$ Million) and Gross Margin (2017-2022)
Table 44. Fiserv Loan Origination Software Product
Table 45. Fiserv Loan Origination Software Revenue Proportion of Loan Origination Software by Product in 2021
Table 46. Fiserv Loan Origination Software Revenue Proportion of Loan Origination Software by Application in 2021
Table 47. Fiserv Loan Origination Software Revenue Proportion of Loan Origination Software by Geographic Area in 2021
Table 48. Fiserv Recent Development
Table 49. Byte Software Corporation Information
Table 50. Byte Software Description and Business Overview
Table 51. Byte Software Loan Origination Software Revenue (US$ Million) and Gross Margin (2017-2022)
Table 52. Byte Software Loan Origination Software Product
Table 53. Byte Software Loan Origination Software Revenue Proportion of Loan Origination Software by Product in 2021
Table 54. Byte Software Loan Origination Software Revenue Proportion of Loan Origination Software by Application in 2021
Table 55. Byte Software Loan Origination Software Revenue Proportion of Loan Origination Software by Geographic Area in 2021
Table 56. Byte Software Recent Development
Table 57. White Clarke Group Corporation Information
Table 58. White Clarke Group Description and Business Overview
Table 59. White Clarke Group Loan Origination Software Revenue (US$ Million) and Gross Margin (2017-2022)
Table 60. White Clarke Group Loan Origination Software Product
Table 61. White Clarke Group Loan Origination Software Revenue Proportion of Loan Origination Software by Product in 2021
Table 62. White Clarke Group Loan Origination Software Revenue Proportion of Loan Origination Software by Application in 2021
Table 63. White Clarke Group Loan Origination Software Revenue Proportion of Loan Origination Software by Geographic Area in 2021
Table 64. Mortgage Builder Corporation Information
Table 65. Mortgage Builder Description and Business Overview
Table 66. Mortgage Builder Loan Origination Software Revenue (US$ Million) and Gross Margin (2017-2022)
Table 67. Mortgage Builder Loan Origination Software Product
Table 68. Mortgage Builder Loan Origination Software Revenue Proportion of Loan Origination Software by Product in 2021
Table 69. Mortgage Builder Loan Origination Software Revenue Proportion of Loan Origination Software by Application in 2021
Table 70. Mortgage Builder Loan Origination Software Revenue Proportion of Loan Origination Software by Geographic Area in 2021
Table 71. Mortgage Cadence (Accenture) Corporation Information
Table 72. Mortgage Cadence (Accenture) Description and Business Overview
Table 73. Mortgage Cadence (Accenture) Loan Origination Software Revenue (US$ Million) and Gross Margin (2017-2022)
Table 74. Mortgage Cadence (Accenture) Loan Origination Software Product
Table 75. Mortgage Cadence (Accenture) Loan Origination Software Revenue Proportion of Loan Origination Software by Product in 2021
Table 76. Mortgage Cadence (Accenture) Loan Origination Software Revenue Proportion of Loan Origination Software by Application in 2021
Table 77. Mortgage Cadence (Accenture) Loan Origination Software Revenue Proportion of Loan Origination Software by Geographic Area in 2021
Table 78. Wipro Corporation Information
Table 79. Wipro Description and Business Overview
Table 80. Wipro Loan Origination Software Revenue (US$ Million) and Gross Margin (2017-2022)
Table 81. Wipro Loan Origination Software Product
Table 82. Wipro Loan Origination Software Revenue Proportion of Loan Origination Software by Product in 2021
Table 83. Wipro Loan Origination Software Revenue Proportion of Loan Origination Software by Application in 2021
Table 84. Wipro Loan Origination Software Revenue Proportion of Loan Origination Software by Geographic Area in 2021
Table 85. Tavant Corporation Information
Table 86. Tavant Description and Business Overview
Table 87. Tavant Loan Origination Software Revenue (US$ Million) and Gross Margin (2017-2022)
Table 88. Tavant Loan Origination Software Product
Table 89. Tavant Loan Origination Software Revenue Proportion of Loan Origination Software by Product in 2021
Table 90. Tavant Loan Origination Software Revenue Proportion of Loan Origination Software by Application in 2021
Table 91. Tavant Loan Origination Software Revenue Proportion of Loan Origination Software by Geographic Area in 2021
Table 92. Finastra Corporation Information
Table 93. Finastra Description and Business Overview
Table 94. Finastra Loan Origination Software Revenue (US$ Million) and Gross Margin (2017-2022)
Table 95. Finastra Loan Origination Software Product
Table 96. Finastra Loan Origination Software Revenue Proportion of Loan Origination Software by Product in 2021
Table 97. Finastra Loan Origination Software Revenue Proportion of Loan Origination Software by Application in 2021
Table 98. Finastra Loan Origination Software Revenue Proportion of Loan Origination Software by Geographic Area in 2021
Table 99. MeridianLink Corporation Information
Table 100. MeridianLink Description and Business Overview
Table 101. MeridianLink Loan Origination Software Revenue (US$ Million) and Gross Margin (2017-2022)
Table 102. MeridianLink Loan Origination Software Product
Table 103. MeridianLink Loan Origination Software Revenue Proportion of Loan Origination Software by Product in 2021
Table 104. MeridianLink Loan Origination Software Revenue Proportion of Loan Origination Software by Application in 2021
Table 105. MeridianLink Loan Origination Software Revenue Proportion of Loan Origination Software by Geographic Area in 2021
Table 106. Black Knight Corporation Information
Table 107. Black Knight Description and Business Overview
Table 108. Black Knight Loan Origination Software Revenue (US$ Million) and Gross Margin (2017-2022)
Table 109. Black Knight Loan Origination Software Product
Table 110. Black Knight Loan Origination Software Revenue Proportion of Loan Origination Software by Product in 2021
Table 111. Black Knight Loan Origination Software Revenue Proportion of Loan Origination Software by Application in 2021
Table 112. Black Knight Loan Origination Software Revenue Proportion of Loan Origination Software by Geographic Area in 2021
Table 113. ISGN Corp Corporation Information
Table 114. ISGN Corp Description and Business Overview
Table 115. ISGN Corp Loan Origination Software Revenue (US$ Million) and Gross Margin (2017-2022)
Table 116. ISGN Corp Loan Origination Software Product
Table 117. ISGN Corp Loan Origination Software Revenue Proportion of Loan Origination Software by Product in 2021
Table 118. ISGN Corp Loan Origination Software Revenue Proportion of Loan Origination Software by Application in 2021
Table 119. ISGN Corp Loan Origination Software Revenue Proportion of Loan Origination Software by Geographic Area in 2021
Table 120. Pegasystems Corporation Information
Table 121. Pegasystems Description and Business Overview
Table 122. Pegasystems Loan Origination Software Revenue (US$ Million) and Gross Margin (2017-2022)
Table 123. Pegasystems Loan Origination Software Product
Table 124. Pegasystems Loan Origination Software Revenue Proportion of Loan Origination Software by Product in 2021
Table 125. Pegasystems Loan Origination Software Revenue Proportion of Loan Origination Software by Application in 2021
Table 126. Pegasystems Loan Origination Software Revenue Proportion of Loan Origination Software by Geographic Area in 2021
Table 127. Juris Technologies Corporation Information
Table 128. Juris Technologies Description and Business Overview
Table 129. Juris Technologies Loan Origination Software Revenue (US$ Million) and Gross Margin (2017-2022)
Table 130. Juris Technologies Loan Origination Software Product
Table 131. Juris Technologies Loan Origination Software Revenue Proportion of Loan Origination Software by Product in 2021
Table 132. Juris Technologies Loan Origination Software Revenue Proportion of Loan Origination Software by Application in 2021
Table 133. Juris Technologies Loan Origination Software Revenue Proportion of Loan Origination Software by Geographic Area in 2021
Table 134. Scorto Corporation Information
Table 135. Scorto Description and Business Overview
Table 136. Scorto Loan Origination Software Revenue (US$ Million) and Gross Margin (2017-2022)
Table 137. Scorto Loan Origination Software Product
Table 138. Scorto Loan Origination Software Revenue Proportion of Loan Origination Software by Product in 2021
Table 139. Scorto Loan Origination Software Revenue Proportion of Loan Origination Software by Application in 2021
Table 140. Scorto Loan Origination Software Revenue Proportion of Loan Origination Software by Geographic Area in 2021
Table 141. Axcess Consulting Corporation Information
Table 142. Axcess Consulting Description and Business Overview
Table 143. Axcess Consulting Loan Origination Software Revenue (US$ Million) and Gross Margin (2017-2022)
Table 144. Axcess Consulting Loan Origination Software Product
Table 145. Axcess Consulting Loan Origination Software Revenue Proportion of Loan Origination Software by Product in 2021
Table 146. Axcess Consulting Loan Origination Software Revenue Proportion of Loan Origination Software by Application in 2021
Table 147. Axcess Consulting Loan Origination Software Revenue Proportion of Loan Origination Software by Geographic Area in 2021
Table 148. Turnkey Lender Corporation Information
Table 149. Turnkey Lender Description and Business Overview
Table 150. Turnkey Lender Loan Origination Software Revenue (US$ Million) and Gross Margin (2017-2022)
Table 151. Turnkey Lender Loan Origination Software Product
Table 152. Turnkey Lender Loan Origination Software Revenue Proportion of Loan Origination Software by Product in 2021
Table 153. Turnkey Lender Loan Origination Software Revenue Proportion of Loan Origination Software by Application in 2021
Table 154. Turnkey Lender Loan Origination Software Revenue Proportion of Loan Origination Software by Geographic Area in 2021
Table 155. VSC Corporation Information
Table 156. VSC Description and Business Overview
Table 157. VSC Loan Origination Software Revenue (US$ Million) and Gross Margin (2017-2022)
Table 158. VSC Loan Origination Software Product
Table 159. VSC Loan Origination Software Revenue Proportion of Loan Origination Software by Product in 2021
Table 160. VSC Loan Origination Software Revenue Proportion of Loan Origination Software by Application in 2021
Table 161. VSC Loan Origination Software Revenue Proportion of Loan Origination Software by Geographic Area in 2021
Table 162. Global Loan Origination Software Revenue by Type (2017-2022) & (US$ Million)
Table 163. Global Loan Origination Software Revenue by Application (2017-2022) & (US$ Million)
Table 164. Global Loan Origination Software Revenue Forecast by Application (2023-2028) & (US$ Million)
Table 165. North America Loan Origination Software Revenue by Country (2017-2022) & (US$ Million)
Table 166. North America Loan Origination Software Revenue by Country (2023-2028) & (US$ Million)
Table 167. North America Loan Origination Software Revenue by Type (2017-2022) & (US$ Million)
Table 168. North America Loan Origination Software Revenue by Application (2017-2022) & (US$ Million)
Table 169. Asia-Pacific Loan Origination Software Revenue by Region (2017-2028) & (US$ Million)
Table 170. Asia-Pacific Loan Origination Software Revenue by Region (2023-2028) & (US$ Million)
Table 171. Asia-Pacific Loan Origination Software Revenue by Type (2017-2022) & (US$ Million)
Table 172. Asia-Pacific Loan Origination Software Revenue by Application (2017-2022) & (US$ Million)
Table 173. Europe Loan Origination Software Revenue by Country (2017-2022) & (US$ Million)
Table 174. Europe Loan Origination Software Revenue by Country (2023-2028) & (US$ Million)
Table 175. Europe Loan Origination Software Revenue by Type (2017-2022) & (US$ Million)
Table 176. Europe Loan Origination Software Revenue by Application (2017-2022) & (US$ Million)
Table 177. Latin America Loan Origination Software Revenue by Country (2017-2022) & (US$ Million)
Table 178. Latin America Loan Origination Software Revenue by Country (2023-2028) & (US$ Million)
Table 179. Latin America Loan Origination Software Revenue by Type (2017-2022) & (US$ Million)
Table 180. Latin America Loan Origination Software Revenue by Application (2017-2022) & (US$ Million)
Table 181. Middle East and Africa Loan Origination Software Revenue by Country (2017-2022) & (US$ Million)
Table 182. Middle East and Africa Loan Origination Software Revenue by Country (2023-2028) & (US$ Million)
Table 183. Middle East and Africa Loan Origination Software Revenue by Type (2017-2022) & (US$ Million)
Table 184. Middle East and Africa Loan Origination Software Revenue by Application (2017-2022) & (US$ Million)
Table 185. Loan Origination Software Key Raw Materials, Industry Status and Trend
Table 186. Loan Origination Software Key Raw Materials and Upstream Suppliers
Table 187. Loan Origination Software Clients Status and Trend
Table 188. Loan Origination Software Typical Clients
Table 189. Loan Origination Software Distributors
Table 190. Loan Origination Software Market Trends
Table 191. Loan Origination Software Market Drivers
Table 192. Loan Origination Software Market Challenges
Table 193. Loan Origination Software Market Restraints
Table 194. Research Programs/Design for This Report
Table 195. Key Data Information from Secondary Sources
Table 196. Key Data Information from Primary Sources
List of Figures
Figure 1. Loan Origination Software Product Picture
Figure 2. Global Loan Origination Software Revenue Market Share by Type in 2021 & 2028
Figure 3. Cloud Based Product Picture
Figure 4. On-premise Product Picture
Figure 5. Global Loan Origination Software Revenue Market Share by Application in 2021 & 2028
Figure 6. Banks
Figure 7. Credit Unions
Figure 8. Mortgage Lenders & Brokers
Figure 9. Others
Figure 10. Loan Origination Software Report Years Considered
Figure 11. Global Loan Origination Software Revenue, (US$ Million), 2017 VS 2021 VS 2028
Figure 12. Global Loan Origination Software Market Size 2017-2028 (US$ Million)
Figure 13. Global Loan Origination Software Market Size Market Share by Region: 2022 Versus 2028
Figure 14. Global Loan Origination Software Revenue Market Share by Region (2017-2028)
Figure 15. Loan Origination Software Market Share by Company Type (Tier 1, Tier 2 and Tier 3): 2017 VS 2021
Figure 16. Global Loan Origination Software Revenue Market Share Forecast by Type (2017-2028)
Figure 17. Global Loan Origination Software Revenue Market Share Forecast by Application (2017-2028)
Figure 18. North America Loan Origination Software Revenue 2017-2028 (US$ Million)
Figure 19. North America Loan Origination Software Revenue Market Share by Type (2017-2022)
Figure 20. North America Loan Origination Software Revenue Market Share by Application (2017-2022)
Figure 21. Asia-Pacific Loan Origination Software Revenue 2017-2028 (US$ Million)
Figure 22. Asia-Pacific Loan Origination Software Revenue Market Share by Region (2017-2028)
Figure 23. Asia-Pacific Loan Origination Software Revenue Market Share by Type (2017-2022)
Figure 24. Asia-Pacific Loan Origination Software Revenue Market Share by Application (2017-2022)
Figure 25. Europe Loan Origination Software Revenue Growth Rate 2017-2028 (US$ Million)
Figure 26. Europe Loan Origination Software Revenue Market Share by Country (2017-2028)
Figure 27. Europe Loan Origination Software Revenue Market Share by Type (2017-2022)
Figure 28. Europe Loan Origination Software Revenue Market Share by Application (2017-2022)
Figure 29. Latin America Loan Origination Software Revenue Growth Rate 2017-2028 (US$ Million)
Figure 30. Latin America Loan Origination Software Revenue Market Share by Country (2017-2022)
Figure 31. Latin America Loan Origination Software Revenue Market Share by Type (2017-2022)
Figure 32. Latin America Loan Origination Software Revenue Market Share by Application (2017-2022)
Figure 33. Middle East and Africa Loan Origination Software Revenue Growth Rate 2017-2028 (US$ Million)
Figure 34. Middle East and Africa Loan Origination Software Revenue Market Share by Country (2017-2028)
Figure 35. Middle East and Africa Loan Origination Software Revenue Market Share by Type (2017-2022)
Figure 36. Middle East and Africa Loan Origination Software Revenue Market Share by Application (2017-2022)
Figure 37. Loan Origination Software Supply Chain (Upstream and Downstream Market)
Figure 38. Global Production Market Share of Loan Origination Software Raw Materials by Region in 2021
Figure 39. Loan Origination Software Distribution Channels
Figure 40. Global Loan Origination Software Percentage 2017-2028: Indirect Sales VS Direct Sales
Figure 41. Global Loan Origination Software Percentage 2017-2028: Online Sales VS Offline Sales
Figure 42. Bottom-up and Top-down Approaches for This Report
Figure 43. Data Triangulation
Figure 44. Key Executives Interviewed
$5900
$11800
HAVE A QUERY?
OUR CUSTOMER
