List of Tables
Table 1. Global Human Resources M&A Consulting Services Market Size Growth Rate by Core Service Phases (US$ Million): 2021 vs 2025 vs 2032
Table 2. Key Players of Pre-transaction Due Diligence
Table 3. Key Players of Integration Strategy and Planning
Table 4. Key Players of Post-Merger Integration Implementation and Change Management
Table 5. Global Human Resources M&A Consulting Services Market Size Growth Rate by Professional Function Focus (US$ Million): 2021 vs 2025 vs 2032
Table 6. Key Players of Compensation and Benefits & Equity Integration
Table 7. Key Players of Talent Assessment & Leadership Development
Table 8. Key Players of Labour Relations & Compliance Management
Table 9. Key Players of Organizational Culture & Change Communication
Table 10. Global Human Resources M&A Consulting Services Market Size Growth Rate by Merger Transaction Types (US$ Million): 2021 vs 2025 vs 2032
Table 11. Key Players of Horizontal Merger & Acquisition Human Resource Integration
Table 12. Key Players of Vertical Merger & Acquisition Human Resource Integration
Table 13. Global Human Resources M&A Consulting Services Market Size Growth Rate by Service Models & Clients (US$ Million): 2021 vs 2025 vs 2032
Table 14. Key Players of Comprehensive Leadership Services
Table 15. Key Players of Modular Expert Support Services
Table 16. Key Players of Specific Context-Specific Services
Table 17. Global Human Resources M&A Consulting Services Market Size Growth by Application (US$ Million): 2021 vs 2025 vs 2032
Table 18. Global Human Resources M&A Consulting Services Market Size by Region (US$ Million): 2021 vs 2025 vs 2032
Table 19. Global Human Resources M&A Consulting Services Market Size by Region (US$ Million), 2021–2026
Table 20. Global Human Resources M&A Consulting Services Market Share by Region (2021–2026)
Table 21. Global Human Resources M&A Consulting Services Forecasted Market Size by Region (US$ Million), 2027–2032
Table 22. Global Human Resources M&A Consulting Services Market Share by Region (2027–2032)
Table 23. Human Resources M&A Consulting Services Market Trends
Table 24. Human Resources M&A Consulting Services Market Drivers
Table 25. Human Resources M&A Consulting Services Market Challenges
Table 26. Human Resources M&A Consulting Services Market Restraints
Table 27. Global Human Resources M&A Consulting Services Revenue by Players (US$ Million), 2021–2026
Table 28. Global Human Resources M&A Consulting Services Market Share by Players (2021–2026)
Table 29. Global Top Human Resources M&A Consulting Services Players by Tier (Tier 1, Tier 2, and Tier 3), based on Human Resources M&A Consulting Services Revenue, 2025
Table 30. Ranking of Global Top Human Resources M&A Consulting Services Companies by Revenue (US$ Million) in 2025
Table 31. Global 5 Largest Players Market Share by Human Resources M&A Consulting Services Revenue (CR5 and HHI), 2021–2026
Table 32. Global Key Players of Human Resources M&A Consulting Services, Headquarters and Area Served
Table 33. Global Key Players of Human Resources M&A Consulting Services, Products and Applications
Table 34. Global Key Players of Human Resources M&A Consulting Services, Date of General Availability (GA)
Table 35. Mergers and Acquisitions, Expansion Plans
Table 36. Global Human Resources M&A Consulting Services Market Size by Core Service Phases (US$ Million), 2021–2026
Table 37. Global Human Resources M&A Consulting Services Revenue Market Share by Core Service Phases (2021–2026)
Table 38. Global Human Resources M&A Consulting Services Forecasted Market Size by Core Service Phases (US$ Million), 2027–2032
Table 39. Global Human Resources M&A Consulting Services Revenue Market Share by Core Service Phases (2027–2032)
Table 40. Global Human Resources M&A Consulting Services Market Size by Application (US$ Million), 2021–2026
Table 41. Global Human Resources M&A Consulting Services Revenue Market Share by Application (2021–2026)
Table 42. Global Human Resources M&A Consulting Services Forecasted Market Size by Application (US$ Million), 2027–2032
Table 43. Global Human Resources M&A Consulting Services Revenue Market Share by Application (2027–2032)
Table 44. North America Human Resources M&A Consulting Services Market Size Growth Rate by Country (US$ Million): 2021 vs 2025 vs 2032
Table 45. North America Human Resources M&A Consulting Services Market Size by Country (US$ Million), 2021–2026
Table 46. North America Human Resources M&A Consulting Services Market Size by Country (US$ Million), 2027–2032
Table 47. Europe Human Resources M&A Consulting Services Market Size Growth Rate by Country (US$ Million): 2021 vs 2025 vs 2032
Table 48. Europe Human Resources M&A Consulting Services Market Size by Country (US$ Million), 2021–2026
Table 49. Europe Human Resources M&A Consulting Services Market Size by Country (US$ Million), 2027–2032
Table 50. Asia-Pacific Human Resources M&A Consulting Services Market Size Growth Rate by Region (US$ Million): 2021 vs 2025 vs 2032
Table 51. Asia-Pacific Human Resources M&A Consulting Services Market Size by Region (US$ Million), 2021–2026
Table 52. Asia-Pacific Human Resources M&A Consulting Services Market Size by Region (US$ Million), 2027–2032
Table 53. Latin America Human Resources M&A Consulting Services Market Size Growth Rate by Country (US$ Million): 2021 vs 2025 vs 2032
Table 54. Latin America Human Resources M&A Consulting Services Market Size by Country (US$ Million), 2021–2026
Table 55. Latin America Human Resources M&A Consulting Services Market Size by Country (US$ Million), 2027–2032
Table 56. Middle East & Africa Human Resources M&A Consulting Services Market Size Growth Rate by Country (US$ Million): 2021 vs 2025 vs 2032
Table 57. Middle East & Africa Human Resources M&A Consulting Services Market Size by Country (US$ Million), 2021–2026
Table 58. Middle East & Africa Human Resources M&A Consulting Services Market Size by Country (US$ Million), 2027–2032
Table 59. Aon Company Details
Table 60. Aon Business Overview
Table 61. Aon Human Resources M&A Consulting Services Product
Table 62. Aon Revenue in Human Resources M&A Consulting Services Business (US$ Million), 2021–2026
Table 63. Aon Recent Development
Table 64. Alvarez & Marsal Company Details
Table 65. Alvarez & Marsal Business Overview
Table 66. Alvarez & Marsal Human Resources M&A Consulting Services Product
Table 67. Alvarez & Marsal Revenue in Human Resources M&A Consulting Services Business (US$ Million), 2021–2026
Table 68. Alvarez & Marsal Recent Development
Table 69. Flex HR, LLC Company Details
Table 70. Flex HR, LLC Business Overview
Table 71. Flex HR, LLC Human Resources M&A Consulting Services Product
Table 72. Flex HR, LLC Revenue in Human Resources M&A Consulting Services Business (US$ Million), 2021–2026
Table 73. Flex HR, LLC Recent Development
Table 74. Hutchison Group Company Details
Table 75. Hutchison Group Business Overview
Table 76. Hutchison Group Human Resources M&A Consulting Services Product
Table 77. Hutchison Group Revenue in Human Resources M&A Consulting Services Business (US$ Million), 2021–2026
Table 78. Hutchison Group Recent Development
Table 79. MCR Consulting Company Details
Table 80. MCR Consulting Business Overview
Table 81. MCR Consulting Human Resources M&A Consulting Services Product
Table 82. MCR Consulting Revenue in Human Resources M&A Consulting Services Business (US$ Million), 2021–2026
Table 83. MCR Consulting Recent Development
Table 84. PwC Company Details
Table 85. PwC Business Overview
Table 86. PwC Human Resources M&A Consulting Services Product
Table 87. PwC Revenue in Human Resources M&A Consulting Services Business (US$ Million), 2021–2026
Table 88. PwC Recent Development
Table 89. Clover HR Company Details
Table 90. Clover HR Business Overview
Table 91. Clover HR Human Resources M&A Consulting Services Product
Table 92. Clover HR Revenue in Human Resources M&A Consulting Services Business (US$ Million), 2021–2026
Table 93. Clover HR Recent Development
Table 94. Nomura Research Institute (NRI) Company Details
Table 95. Nomura Research Institute (NRI) Business Overview
Table 96. Nomura Research Institute (NRI) Human Resources M&A Consulting Services Product
Table 97. Nomura Research Institute (NRI) Revenue in Human Resources M&A Consulting Services Business (US$ Million), 2021–2026
Table 98. Nomura Research Institute (NRI) Recent Development
Table 99. Shockingly Different Leadership Company Details
Table 100. Shockingly Different Leadership Business Overview
Table 101. Shockingly Different Leadership Human Resources M&A Consulting Services Product
Table 102. Shockingly Different Leadership Revenue in Human Resources M&A Consulting Services Business (US$ Million), 2021–2026
Table 103. Shockingly Different Leadership Recent Development
Table 104. EY Company Details
Table 105. EY Business Overview
Table 106. EY Human Resources M&A Consulting Services Product
Table 107. EY Revenue in Human Resources M&A Consulting Services Business (US$ Million), 2021–2026
Table 108. EY Recent Development
Table 109. S&K HR Consulting Company Details
Table 110. S&K HR Consulting Business Overview
Table 111. S&K HR Consulting Human Resources M&A Consulting Services Product
Table 112. S&K HR Consulting Revenue in Human Resources M&A Consulting Services Business (US$ Million), 2021–2026
Table 113. S&K HR Consulting Recent Development
Table 114. Deloitte Company Details
Table 115. Deloitte Business Overview
Table 116. Deloitte Human Resources M&A Consulting Services Product
Table 117. Deloitte Revenue in Human Resources M&A Consulting Services Business (US$ Million), 2021–2026
Table 118. Deloitte Recent Development
Table 119. O'Hare Management Company Details
Table 120. O'Hare Management Business Overview
Table 121. O'Hare Management Human Resources M&A Consulting Services Product
Table 122. O'Hare Management Revenue in Human Resources M&A Consulting Services Business (US$ Million), 2021–2026
Table 123. O'Hare Management Recent Development
Table 124. The WorkPlace Group Company Details
Table 125. The WorkPlace Group Business Overview
Table 126. The WorkPlace Group Human Resources M&A Consulting Services Product
Table 127. The WorkPlace Group Revenue in Human Resources M&A Consulting Services Business (US$ Million), 2021–2026
Table 128. The WorkPlace Group Recent Development
Table 129. Miller Cooper Company Details
Table 130. Miller Cooper Business Overview
Table 131. Miller Cooper Human Resources M&A Consulting Services Product
Table 132. Miller Cooper Revenue in Human Resources M&A Consulting Services Business (US$ Million), 2021–2026
Table 133. Miller Cooper Recent Development
Table 134. Gallagher Company Details
Table 135. Gallagher Business Overview
Table 136. Gallagher Human Resources M&A Consulting Services Product
Table 137. Gallagher Revenue in Human Resources M&A Consulting Services Business (US$ Million), 2021–2026
Table 138. Gallagher Recent Development
Table 139. Herbein HR Consulting Company Details
Table 140. Herbein HR Consulting Business Overview
Table 141. Herbein HR Consulting Human Resources M&A Consulting Services Product
Table 142. Herbein HR Consulting Revenue in Human Resources M&A Consulting Services Business (US$ Million), 2021–2026
Table 143. Herbein HR Consulting Recent Development
Table 144. Research Programs/Design for This Report
Table 145. Key Data Information from Secondary Sources
Table 146. Key Data Information from Primary Sources
Table 147. Authors List of This Report
List of Figures
Figure 1. Human Resources M&A Consulting Services Picture
Figure 2. Global Human Resources M&A Consulting Services Market Size Comparison by Core Service Phases (US$ Million), 2021–2032
Figure 3. Global Human Resources M&A Consulting Services Market Share by Core Service Phases: 2025 vs 2032
Figure 4. Pre-transaction Due Diligence Features
Figure 5. Integration Strategy and Planning Features
Figure 6. Post-Merger Integration Implementation and Change Management Features
Figure 7. Global Human Resources M&A Consulting Services Market Size Comparison by Professional Function Focus (US$ Million), 2021–2032
Figure 8. Compensation and Benefits & Equity Integration Features
Figure 9. Talent Assessment & Leadership Development Features
Figure 10. Labour Relations & Compliance Management Features
Figure 11. Organizational Culture & Change Communication Features
Figure 12. Global Human Resources M&A Consulting Services Market Size Comparison by Merger Transaction Types (US$ Million), 2021–2032
Figure 13. Horizontal Merger & Acquisition Human Resource Integration Features
Figure 14. Vertical Merger & Acquisition Human Resource Integration Features
Figure 15. Global Human Resources M&A Consulting Services Market Size Comparison by Service Models & Clients (US$ Million), 2021–2032
Figure 16. Comprehensive Leadership Services Features
Figure 17. Modular Expert Support Services Features
Figure 18. Specific Context-Specific Services Features
Figure 19. Global Human Resources M&A Consulting Services Market Size by Application (US$ Million), 2021–2032
Figure 20. Global Human Resources M&A Consulting Services Market Share by Application: 2025 vs 2032
Figure 21. Large Enterprises (≥1,000 Employees) Case Studies
Figure 22. Small and Medium-sized Enterprises (<1,000 Employees) Case Studies
Figure 23. Human Resources M&A Consulting Services Report Years Considered
Figure 24. Global Human Resources M&A Consulting Services Market Size (US$ Million), Year-over-Year: 2021–2032
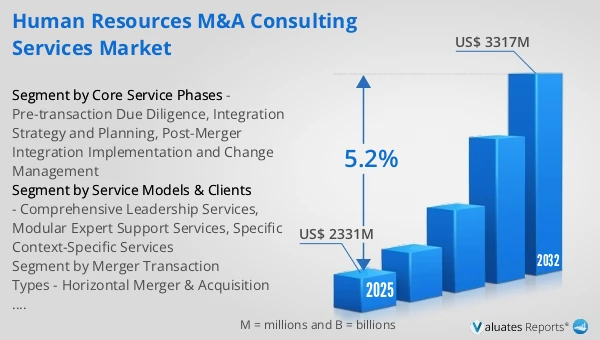
Figure 25. Global Human Resources M&A Consulting Services Market Size, (US$ Million), 2021 vs 2025 vs 2032
Figure 26. Global Human Resources M&A Consulting Services Market Share by Region: 2025 vs 2032
Figure 27. Global Human Resources M&A Consulting Services Market Share by Players in 2025
Figure 28. Global Human Resources M&A Consulting Services Market Share by Company Type (Tier 1, Tier 2, and Tier 3)
Figure 29. The Top 10 and 5 Players Market Share by Human Resources M&A Consulting Services Revenue in 2025
Figure 30. North America Human Resources M&A Consulting Services Market Size YoY Growth (US$ Million), 2021–2032
Figure 31. North America Human Resources M&A Consulting Services Market Share by Country (2021–2032)
Figure 32. United States Human Resources M&A Consulting Services Market Size YoY Growth (US$ Million), 2021–2032
Figure 33. Canada Human Resources M&A Consulting Services Market Size YoY Growth (US$ Million), 2021–2032
Figure 34. Europe Human Resources M&A Consulting Services Market Size YoY Growth (US$ Million), 2021–2032
Figure 35. Europe Human Resources M&A Consulting Services Market Share by Country (2021–2032)
Figure 36. Germany Human Resources M&A Consulting Services Market Size YoY Growth (US$ Million), 2021–2032
Figure 37. France Human Resources M&A Consulting Services Market Size YoY Growth (US$ Million), 2021–2032
Figure 38. U.K. Human Resources M&A Consulting Services Market Size YoY Growth (US$ Million), 2021–2032
Figure 39. Italy Human Resources M&A Consulting Services Market Size YoY Growth (US$ Million), 2021–2032
Figure 40. Russia Human Resources M&A Consulting Services Market Size YoY Growth (US$ Million), 2021–2032
Figure 41. Ireland Human Resources M&A Consulting Services Market Size YoY Growth (US$ Million), 2021–2032
Figure 42. Asia-Pacific Human Resources M&A Consulting Services Market Size YoY Growth (US$ Million), 2021–2032
Figure 43. Asia-Pacific Human Resources M&A Consulting Services Market Share by Region (2021–2032)
Figure 44. China Human Resources M&A Consulting Services Market Size YoY Growth (US$ Million), 2021–2032
Figure 45. Japan Human Resources M&A Consulting Services Market Size YoY Growth (US$ Million), 2021–2032
Figure 46. South Korea Human Resources M&A Consulting Services Market Size YoY Growth (US$ Million), 2021–2032
Figure 47. Southeast Asia Human Resources M&A Consulting Services Market Size YoY Growth (US$ Million), 2021–2032
Figure 48. India Human Resources M&A Consulting Services Market Size YoY Growth (US$ Million), 2021–2032
Figure 49. Australia & New Zealand Human Resources M&A Consulting Services Market Size YoY Growth (US$ Million), 2021–2032
Figure 50. Latin America Human Resources M&A Consulting Services Market Size YoY Growth (US$ Million), 2021–2032
Figure 51. Latin America Human Resources M&A Consulting Services Market Share by Country (2021–2032)
Figure 52. Mexico Human Resources M&A Consulting Services Market Size YoY Growth (US$ Million), 2021–2032
Figure 53. Brazil Human Resources M&A Consulting Services Market Size YoY Growth (US$ Million), 2021–2032
Figure 54. Middle East & Africa Human Resources M&A Consulting Services Market Size YoY Growth (US$ Million), 2021–2032
Figure 55. Middle East & Africa Human Resources M&A Consulting Services Market Share by Country (2021–2032)
Figure 56. Israel Human Resources M&A Consulting Services Market Size YoY Growth (US$ Million), 2021–2032
Figure 57. Saudi Arabia Human Resources M&A Consulting Services Market Size YoY Growth (US$ Million), 2021–2032
Figure 58. UAE Human Resources M&A Consulting Services Market Size YoY Growth (US$ Million), 2021–2032
Figure 59. Aon Revenue Growth Rate in Human Resources M&A Consulting Services Business (2021–2026)
Figure 60. Alvarez & Marsal Revenue Growth Rate in Human Resources M&A Consulting Services Business (2021–2026)
Figure 61. Flex HR, LLC Revenue Growth Rate in Human Resources M&A Consulting Services Business (2021–2026)
Figure 62. Hutchison Group Revenue Growth Rate in Human Resources M&A Consulting Services Business (2021–2026)
Figure 63. MCR Consulting Revenue Growth Rate in Human Resources M&A Consulting Services Business (2021–2026)
Figure 64. PwC Revenue Growth Rate in Human Resources M&A Consulting Services Business (2021–2026)
Figure 65. Clover HR Revenue Growth Rate in Human Resources M&A Consulting Services Business (2021–2026)
Figure 66. Nomura Research Institute (NRI) Revenue Growth Rate in Human Resources M&A Consulting Services Business (2021–2026)
Figure 67. Shockingly Different Leadership Revenue Growth Rate in Human Resources M&A Consulting Services Business (2021–2026)
Figure 68. EY Revenue Growth Rate in Human Resources M&A Consulting Services Business (2021–2026)
Figure 69. S&K HR Consulting Revenue Growth Rate in Human Resources M&A Consulting Services Business (2021–2026)
Figure 70. Deloitte Revenue Growth Rate in Human Resources M&A Consulting Services Business (2021–2026)
Figure 71. O'Hare Management Revenue Growth Rate in Human Resources M&A Consulting Services Business (2021–2026)
Figure 72. The WorkPlace Group Revenue Growth Rate in Human Resources M&A Consulting Services Business (2021–2026)
Figure 73. Miller Cooper Revenue Growth Rate in Human Resources M&A Consulting Services Business (2021–2026)
Figure 74. Gallagher Revenue Growth Rate in Human Resources M&A Consulting Services Business (2021–2026)
Figure 75. Herbein HR Consulting Revenue Growth Rate in Human Resources M&A Consulting Services Business (2021–2026)
Figure 76. Bottom-up and Top-down Approaches for This Report
Figure 77. Data Triangulation
Figure 78. Key Executives Interviewed