0
U.S. (TOLL FREE)
+1 (315) 215-3225
Automative

0
U.S. (TOLL FREE)
+1 (315) 215-3225
Organic Farming - Global Market Insights and Sales Trends 2024
Published Date: December 2023
|
Report Code: QYRE-Auto-6Q6362
Home | Market Reports | Food & Drink| Food
Global Organic Farming Market Insights Forecast to 2028
BUY CHAPTERS

Organic Farming - Global Market Insights and Sales Trends 2024

Code: QYRE-Auto-6Q6362
Report
December 2023
Pages:86
QYResearch
Buy Now with 15% Discount
DESCRIPTION
TABLE OF CONTENT
TABLES & FIGURES

Organic Farming - Market Size

The global Organic Farming market size is expected to reach US$ 82 million by 2029, growing at a CAGR of 5.9% from 2023 to 2029.

Organic Farming -  Market

Organic Farming - Market

Organic farming is a method that involves growing and nurturing crops with the use of biological materials preventing the use of synthetic based fertilizers and pesticides. Also, the use of genetically modified organisms is not permitted. Organic farming systems have a great potential to provide the world with healthy, high-quality food. Organic farming has several environmental benefits such that it improves the soil fertility, combats soil erosion and reduces the greenhouse gas emission when compared with other forms of agriculture. Organic foods help to mitigate dietary risks from pesticides to human health than conventional foods. Foods from organic farms are loaded with nutrients such as vitamins, enzymes, minerals and other micro-nutrients compared to those from conventional farms. Those that have tasted organically farmed foods would attest to the fact that they have a natural and better taste.
The market is mainly driven by the significant applications of Organic Farming in various end use industries. The expanding demands from the Agricultural Companies and Organic Farms, are propelling Organic Farming market. Pure Organic Farming, one of the segments analysed in this report, is projected to record % CAGR and reach US$ million by the end of the analysis period. Growth in the Integrated Organic Farming segment is estimated at % CAGR for the next seven-year period.
Organic production systems do not use genetically modified (GM) seed, synthetic pesticides or fertilizers. Some of the essential characteristics of organic systems include design and implementation of an organic system plan that describes the practices used in producing crops and livestock products; a detailed recordkeeping system that tracks all products from the field to point of sale; and maintenance of buffer zones to prevent inadvertent contamination by synthetic farm chemicals from adjacent conventional fields.

Report Objectives

This report provides market insight on the different segments, by players, by Type, by Application. Market size and forecast (2018-2029) has been provided in the report. The primary objectives of this report are to provide 1) global market size and forecasts, growth rates, market dynamics, industry structure and developments, market situation, trends; 2) global market share and ranking by company; 3) comprehensive presentation of the global market for Organic Farming, with both quantitative and qualitative analysis through detailed segmentation; 4) detailed value chain analysis and review of growth factors essential for the existing market players and new entrants; 5) emerging opportunities in the market and the future impact of major drivers and restraints of the market.

Key Features of The Study:

This report provides in-depth analysis of the global Organic Farming market, and provides market size (US$ million) and CAGR for the forecast period (2023-2029), considering 2022 as the base year.
This report profiles key players in the global Organic Farming market based on the following parameters - company details (found date, headquarters, manufacturing bases), products portfolio, Organic Farming sales data, market share and ranking.
This report elucidates potential market opportunities across different segments and explains attractive investment proposition matrices for this market.
This report illustrates key insights about market drivers, restraints, opportunities, market trends, regional outlook.
Key companies of Organic Farming covered in this report include Monsanto, KiuShi, Blue Yonder, Vero-Bio, Sikkim, Amalgamated Plantations, Bunge, DowDuPont and Eden Foods, etc.
The global Organic Farming market report caters to various stakeholders in this industry including investors, suppliers, product players, distributors, new entrants, and financial analysts.
Market Segmentation
Company Profiles:
Monsanto
KiuShi
Blue Yonder
Vero-Bio
Sikkim
Amalgamated Plantations
Bunge
DowDuPont
Eden Foods

Scope of Organic Farming - Market Report

Report Metric Details
Report Name Organic Farming - Market
Forecasted market size in 2029 US$ 82 million
CAGR 5.9%
Forecasted years 2023 - 2029
Global Organic Farming market, by region:
  • North America (U.S., Canada, Mexico)
  • Europe (Germany, France, UK, Italy, etc.)
  • Asia Pacific (China, Japan, South Korea, Southeast Asia, India, etc.)
  • South America (Brazil, etc.)
  • Middle East and Africa (Turkey, GCC Countries, Africa, etc.)
Global Organic Farming market, Segment by Type:
  • Pure Organic Farming
  • Integrated Organic Farming
Global Organic Farming market, by Application
  • Agricultural Companies
  • Organic Farms
Forecast units USD million in value
Report coverage Revenue and volume forecast, company share, competitive landscape, growth factors and trends

Core Chapters

  • Chapter One: Introduces the report scope of the report, executive summary of global and regional market size and CAGR for the history and forecast period (2018-2023, 2024-2029). It offers a high-level view of the current state of the market and its likely evolution in the short to mid-term, and long term.
  • Chapter Two: Provides the analysis of various market segments by Type, covering the market size and development potential of each market segment, to help readers find the blue ocean market in different market segments.
  • Chapter Three: Provides the analysis of various market segments by Application, covering the market size and development potential of each market segment, to help readers find the blue ocean market in different downstream markets.
  • Chapter Four: Detailed analysis of Organic Farming companies’ competitive landscape, revenue, market share and ranking, latest development plan, merger, and acquisition information, etc.
  • Chapter Five: Provides profiles of key players, introducing the basic situation of the main companies in the market in detail, including product introduction, revenue, recent development, etc.
  • Chapter Six, Seven, Eight, Nine and Ten: North America, Europe, Asia Pacific, Latin America, Middle East & Africa, revenue by country.
  • Chapter Eleven: this section also introduces the market dynamics, latest developments of the market, the driving factors and restrictive factors of the market, the challenges and risks faced by companies in the industry, and the analysis of relevant policies in the industry.
  • Chapter Twelve: Research Finding/Conclusion

FAQ for this report

What is the Organic Farming - Market size in 2029?

Ans: The Organic Farming - Market size in 2029 will be US$ 82 million.

What are the Application segmentation covered in the Organic Farming - Market report?

Ans: The Applications covered in the Organic Farming - Market report are Agricultural Companies, Organic Farms

What are the Type segmentation covered in the Organic Farming - Market report?

Ans: The Types covered in the Organic Farming - Market report are Pure Organic Farming, Integrated Organic Farming

Recommended Reports

Organic Food Products

Organic Crop Inputs

Farming Techniques

1 Market Overview of Organic Farming
1.1 Organic Farming Market Overview
1.1.1 Organic Farming Product Scope
1.1.2 Organic Farming Market Status and Outlook
1.2 Global Organic Farming Market Size Overview by Region 2018 VS 2022 VS 2029
1.3 Global Organic Farming Market Size by Region (2018-2029)
1.4 Global Organic Farming Historic Market Size by Region (2018-2023)
1.5 Global Organic Farming Market Size Forecast by Region (2024-2029)
1.6 Key Regions, Organic Farming Market Size (2018-2029)
1.6.1 North America Organic Farming Market Size (2018-2029)
1.6.2 Europe Organic Farming Market Size (2018-2029)
1.6.3 Asia-Pacific Organic Farming Market Size (2018-2029)
1.6.4 Latin America Organic Farming Market Size (2018-2029)
1.6.5 Middle East & Africa Organic Farming Market Size (2018-2029)
2 Organic Farming Market by Type
2.1 Introduction
2.1.1 Pure Organic Farming
2.1.2 Integrated Organic Farming
2.2 Global Organic Farming Market Size by Type: 2018 VS 2022 VS 2029
2.2.1 Global Organic Farming Historic Market Size by Type (2018-2023)
2.2.2 Global Organic Farming Forecasted Market Size by Type (2024-2029)
2.3 Key Regions Market Size by Type
2.3.1 North America Organic Farming Revenue Breakdown by Type (2018-2029)
2.3.2 Europe Organic Farming Revenue Breakdown by Type (2018-2029)
2.3.3 Asia-Pacific Organic Farming Revenue Breakdown by Type (2018-2029)
2.3.4 Latin America Organic Farming Revenue Breakdown by Type (2018-2029)
2.3.5 Middle East and Africa Organic Farming Revenue Breakdown by Type (2018-2029)
3 Organic Farming Market Overview by Application
3.1 Introduction
3.1.1 Agricultural Companies
3.1.2 Organic Farms
3.2 Global Organic Farming Market Size by Application: 2018 VS 2022 VS 2029
3.2.1 Global Organic Farming Historic Market Size by Application (2018-2023)
3.2.2 Global Organic Farming Forecasted Market Size by Application (2024-2029)
3.3 Key Regions Market Size by Application
3.3.1 North America Organic Farming Revenue Breakdown by Application (2018-2029)
3.3.2 Europe Organic Farming Revenue Breakdown by Application (2018-2029)
3.3.3 Asia-Pacific Organic Farming Revenue Breakdown by Application (2018-2029)
3.3.4 Latin America Organic Farming Revenue Breakdown by Application (2018-2029)
3.3.5 Middle East and Africa Organic Farming Revenue Breakdown by Application (2018-2029)
4 Organic Farming Competition Analysis by Players
4.1 Global Organic Farming Market Size by Players (2018-2023)
4.2 Global Top Players by Company Type (Tier 1, Tier 2 and Tier 3) & (based on the Revenue in Organic Farming as of 2022)
4.3 Date of Key Players Enter into Organic Farming Market
4.4 Global Top Players Organic Farming Headquarters and Area Served
4.5 Key Players Organic Farming Product Solution and Service
4.6 Competitive Status
4.6.1 Organic Farming Market Concentration Rate
4.6.2 Mergers & Acquisitions, Expansion Plans
5 Company (Top Players) Profiles
5.1 Monsanto
5.1.1 Monsanto Profile
5.1.2 Monsanto Main Business
5.1.3 Monsanto Organic Farming Products, Services and Solutions
5.1.4 Monsanto Organic Farming Revenue (US$ Million) & (2018-2023)
5.1.5 Monsanto Recent Developments
5.2 KiuShi
5.2.1 KiuShi Profile
5.2.2 KiuShi Main Business
5.2.3 KiuShi Organic Farming Products, Services and Solutions
5.2.4 KiuShi Organic Farming Revenue (US$ Million) & (2018-2023)
5.2.5 KiuShi Recent Developments
5.3 Blue Yonder
5.3.1 Blue Yonder Profile
5.3.2 Blue Yonder Main Business
5.3.3 Blue Yonder Organic Farming Products, Services and Solutions
5.3.4 Blue Yonder Organic Farming Revenue (US$ Million) & (2018-2023)
5.3.5 Vero-Bio Recent Developments
5.4 Vero-Bio
5.4.1 Vero-Bio Profile
5.4.2 Vero-Bio Main Business
5.4.3 Vero-Bio Organic Farming Products, Services and Solutions
5.4.4 Vero-Bio Organic Farming Revenue (US$ Million) & (2018-2023)
5.4.5 Vero-Bio Recent Developments
5.5 Sikkim
5.5.1 Sikkim Profile
5.5.2 Sikkim Main Business
5.5.3 Sikkim Organic Farming Products, Services and Solutions
5.5.4 Sikkim Organic Farming Revenue (US$ Million) & (2018-2023)
5.5.5 Sikkim Recent Developments
5.6 Amalgamated Plantations
5.6.1 Amalgamated Plantations Profile
5.6.2 Amalgamated Plantations Main Business
5.6.3 Amalgamated Plantations Organic Farming Products, Services and Solutions
5.6.4 Amalgamated Plantations Organic Farming Revenue (US$ Million) & (2018-2023)
5.6.5 Amalgamated Plantations Recent Developments
5.7 Bunge
5.7.1 Bunge Profile
5.7.2 Bunge Main Business
5.7.3 Bunge Organic Farming Products, Services and Solutions
5.7.4 Bunge Organic Farming Revenue (US$ Million) & (2018-2023)
5.7.5 Bunge Recent Developments
5.8 DowDuPont
5.8.1 DowDuPont Profile
5.8.2 DowDuPont Main Business
5.8.3 DowDuPont Organic Farming Products, Services and Solutions
5.8.4 DowDuPont Organic Farming Revenue (US$ Million) & (2018-2023)
5.8.5 DowDuPont Recent Developments
5.9 Eden Foods
5.9.1 Eden Foods Profile
5.9.2 Eden Foods Main Business
5.9.3 Eden Foods Organic Farming Products, Services and Solutions
5.9.4 Eden Foods Organic Farming Revenue (US$ Million) & (2018-2023)
5.9.5 Eden Foods Recent Developments
6 North America
6.1 North America Organic Farming Market Size by Country (2018-2029)
6.2 U.S.
6.3 Canada
7 Europe
7.1 Europe Organic Farming Market Size by Country (2018-2029)
7.2 Germany
7.3 France
7.4 U.K.
7.5 Italy
7.6 Russia
7.7 Nordic Countries
7.8 Rest of Europe
8 Asia-Pacific
8.1 Asia-Pacific Organic Farming Market Size by Region (2018-2029)
8.2 China
8.3 Japan
8.4 South Korea
8.5 Southeast Asia
8.6 India
8.7 Australia
8.8 Rest of Asia-Pacific
9 Latin America
9.1 Latin America Organic Farming Market Size by Country (2018-2029)
9.2 Mexico
9.3 Brazil
9.4 Rest of Latin America
10 Middle East & Africa
10.1 Middle East & Africa Organic Farming Market Size by Country (2018-2029)
10.2 Turkey
10.3 Saudi Arabia
10.4 UAE
10.5 Rest of Middle East & Africa
11 Organic Farming Market Dynamics
11.1 Organic Farming Industry Trends
11.2 Organic Farming Market Drivers
11.3 Organic Farming Market Challenges
11.4 Organic Farming Market Restraints
12 Research Finding /Conclusion
13 Methodology and Data Source
13.1 Methodology/Research Approach
13.1.1 Research Programs/Design
13.1.2 Market Size Estimation
13.1.3 Market Breakdown and Data Triangulation
13.2 Data Source
13.2.1 Secondary Sources
13.2.2 Primary Sources
13.3 Disclaimer
13.4 Author List
List of Tables
    Table 1. Global Market Organic Farming Market Size (US$ Million) Comparison by Region 2018 VS 2022 VS 2029
    Table 2. Global Organic Farming Market Size by Region (2018-2023) & (US$ Million)
    Table 3. Global Organic Farming Market Size Share by Region (2018-2023)
    Table 4. Global Organic Farming Forecasted Market Size by Region (2024-2029) & (US$ Million)
    Table 5. Global Organic Farming Forecasted Market Size Share by Region (2024-2029)
    Table 6. Global Organic Farming Market Size (US$ Million) by Type: 2018 VS 2022 VS 2029
    Table 7. Global Organic Farming Market Size by Type (2018-2023) & (US$ Million)
    Table 8. Global Organic Farming Revenue Market Share by Type (2018-2023)
    Table 9. Global Organic Farming Forecasted Market Size by Type (2024-2029) & (US$ Million)
    Table 10. Global Organic Farming Revenue Market Share by Type (2024-2029)
    Table 11. North America Organic Farming Revenue by Type (2018-2023) & (US$ Million)
    Table 12. North America Organic Farming Revenue by Type (2024-2029) & (US$ Million)
    Table 13. Europe Organic Farming Revenue by Type (2018-2023) & (US$ Million)
    Table 14. Europe Organic Farming Revenue by Type (2024-2029) & (US$ Million)
    Table 15. Asia-Pacific Organic Farming Revenue by Type (2018-2023) & (US$ Million)
    Table 16. Asia-Pacific Organic Farming Revenue by Type (2024-2029) & (US$ Million)
    Table 17. Latin America Organic Farming Revenue by Type (2018-2023) & (US$ Million)
    Table 18. Latin America Organic Farming Revenue by Type (2024-2029) & (US$ Million)
    Table 19. Middle East and Africa Organic Farming Revenue by Type (2018-2023) & (US$ Million)
    Table 20. Middle East and Africa Organic Farming Revenue by Type (2024-2029) & (US$ Million)
    Table 21. Global Organic Farming Market Size (US$ Million) by Application: 2018 VS 2022 VS 2029
    Table 22. Global Organic Farming Market Size by Application (2018-2023) & (US$ Million)
    Table 23. Global Organic Farming Revenue Market Share by Application (2018-2023)
    Table 24. Global Organic Farming Forecasted Market Size by Application (2024-2029) & (US$ Million)
    Table 25. Global Organic Farming Revenue Market Share by Application (2024-2029)
    Table 26. North America Organic Farming Revenue by Application (2018-2023) & (US$ Million)
    Table 27. North America Organic Farming Revenue by Application (2024-2029) & (US$ Million)
    Table 28. Europe Organic Farming Revenue by Application (2018-2023) & (US$ Million)
    Table 29. Europe Organic Farming Revenue by Application (2024-2029) & (US$ Million)
    Table 30. Asia-Pacific Organic Farming Revenue by Application (2018-2023) & (US$ Million)
    Table 31. Asia-Pacific Organic Farming Revenue by Application (2024-2029) & (US$ Million)
    Table 32. Latin America Organic Farming Revenue by Application (2018-2023) & (US$ Million)
    Table 33. Latin America Organic Farming Revenue by Application (2024-2029) & (US$ Million)
    Table 34. Middle East and Africa Organic Farming Revenue by Application (2018-2023) & (US$ Million)
    Table 35. Middle East and Africa Organic Farming Revenue by Application (2024-2029) & (US$ Million)
    Table 36. Global Organic Farming Revenue (US$ Million) by Players (2018-2023)
    Table 37. Global Organic Farming Revenue Market Share by Players (2018-2023)
    Table 38. Global Top Players Market Share by Company Type (Tier 1, Tier 2 and Tier 3) & (based on the Revenue in Organic Farming as of 2022)
    Table 39. Date of Key Players Enter into Organic Farming Market
    Table 40. Global Organic Farming Key Players Headquarters and Area Served
    Table 41. Organic Farming Product Solution and Service
    Table 42. Global Organic Farming Players Market Concentration Ratio (CR5 and HHI)
    Table 43. Mergers & Acquisitions, Expansion Plans
    Table 44. Monsanto Basic Information List
    Table 45. Monsanto Description and Business Overview
    Table 46. Monsanto Organic Farming Products, Services and Solutions
    Table 47. Revenue (US$ Million) in Organic Farming Business of Monsanto (2018-2023)
    Table 48. Monsanto Recent Developments
    Table 49. KiuShi Basic Information List
    Table 50. KiuShi Description and Business Overview
    Table 51. KiuShi Organic Farming Products, Services and Solutions
    Table 52. Revenue (US$ Million) in Organic Farming Business of KiuShi (2018-2023)
    Table 53. KiuShi Recent Developments
    Table 54. Blue Yonder Basic Information List
    Table 55. Blue Yonder Description and Business Overview
    Table 56. Blue Yonder Organic Farming Products, Services and Solutions
    Table 57. Revenue (US$ Million) in Organic Farming Business of Blue Yonder (2018-2023)
    Table 58. Blue Yonder Recent Developments
    Table 59. Vero-Bio Basic Information List
    Table 60. Vero-Bio Description and Business Overview
    Table 61. Vero-Bio Organic Farming Products, Services and Solutions
    Table 62. Revenue (US$ Million) in Organic Farming Business of Vero-Bio (2018-2023)
    Table 63. Vero-Bio Recent Developments
    Table 64. Sikkim Basic Information List
    Table 65. Sikkim Description and Business Overview
    Table 66. Sikkim Organic Farming Products, Services and Solutions
    Table 67. Revenue (US$ Million) in Organic Farming Business of Sikkim (2018-2023)
    Table 68. Sikkim Recent Developments
    Table 69. Amalgamated Plantations Basic Information List
    Table 70. Amalgamated Plantations Description and Business Overview
    Table 71. Amalgamated Plantations Organic Farming Products, Services and Solutions
    Table 72. Revenue (US$ Million) in Organic Farming Business of Amalgamated Plantations (2018-2023)
    Table 73. Amalgamated Plantations Recent Developments
    Table 74. Bunge Basic Information List
    Table 75. Bunge Description and Business Overview
    Table 76. Bunge Organic Farming Products, Services and Solutions
    Table 77. Revenue (US$ Million) in Organic Farming Business of Bunge (2018-2023)
    Table 78. Bunge Recent Developments
    Table 79. DowDuPont Basic Information List
    Table 80. DowDuPont Description and Business Overview
    Table 81. DowDuPont Organic Farming Products, Services and Solutions
    Table 82. Revenue (US$ Million) in Organic Farming Business of DowDuPont (2018-2023)
    Table 83. DowDuPont Recent Developments
    Table 84. Eden Foods Basic Information List
    Table 85. Eden Foods Description and Business Overview
    Table 86. Eden Foods Organic Farming Products, Services and Solutions
    Table 87. Revenue (US$ Million) in Organic Farming Business of Eden Foods (2018-2023)
    Table 88. Eden Foods Recent Developments
    Table 89. North America Organic Farming Market Size by Country (2018-2023) & (US$ Million)
    Table 90. North America Organic Farming Market Size by Country (2024-2029) & (US$ Million)
    Table 91. Europe Organic Farming Market Size by Country (2018-2023) & (US$ Million)
    Table 92. Europe Organic Farming Market Size by Country (2024-2029) & (US$ Million)
    Table 93. Asia-Pacific Organic Farming Market Size Growth Rate (CAGR) by Region (US$ Million): 2018 VS 2022 VS 2029
    Table 94. Asia-Pacific Organic Farming Market Size by Region (2018-2023) & (US$ Million)
    Table 95. Asia-Pacific Organic Farming Market Size by Region (2024-2029) & (US$ Million)
    Table 96. Asia-Pacific Organic Farming Market Share by Region (2018-2023)
    Table 97. Asia-Pacific Organic Farming Market Share by Region (2024-2029)
    Table 98. Latin America Organic Farming Market Size Growth Rate (CAGR) by Region (US$ Million): 2018 VS 2022 VS 2029
    Table 99. Latin America Organic Farming Market Size by Country (2018-2023) & (US$ Million)
    Table 100. Latin America Organic Farming Market Size by Country (2024-2029) & (US$ Million)
    Table 101. Middle East & Africa Organic Farming Market Size Growth Rate (CAGR) by Region (US$ Million): 2018 VS 2022 VS 2029
    Table 102. Middle East & Africa Organic Farming Market Size by Country (2018-2023) & (US$ Million)
    Table 103. Middle East & Africa Organic Farming Market Size by Country (2024-2029) & (US$ Million)
    Table 104. Organic Farming Market Trends
    Table 105. Organic Farming Market Drivers
    Table 106. Organic Farming Market Challenges
    Table 107. Organic Farming Market Restraints
    Table 108. Research Programs/Design for This Report
    Table 109. Key Data Information from Secondary Sources
    Table 110. Key Data Information from Primary Sources
List of Figures
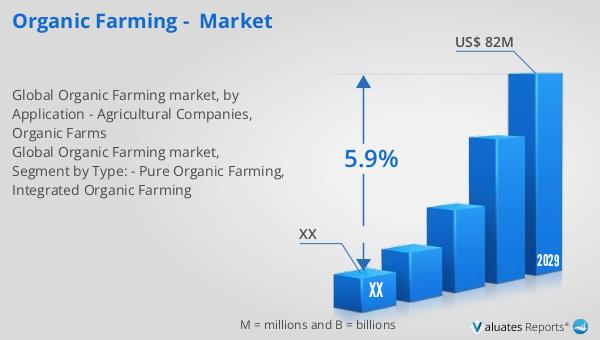
    Figure 1. Global Organic Farming Market Size Year-over-Year 2018-2029 & (US$ Million)
    Figure 2. Global Organic Farming Market Size (US$ Million), 2018 VS 2022 VS 2029
    Figure 3. Global Organic Farming Market Share by Regions: 2022 VS 2029
    Figure 4. Global Organic Farming Forecasted Market Size Share by Region (2024-2029)
    Figure 5. North America Organic Farming Market Size Growth Rate (2018-2029) & (US$ Million)
    Figure 6. Europe Organic Farming Market Size Growth Rate (2018-2029) & (US$ Million)
    Figure 7. Asia-Pacific Organic Farming Market Size Growth Rate (2018-2029) & (US$ Million)
    Figure 8. Latin America Organic Farming Market Size Growth Rate (2018-2029) & (US$ Million)
    Figure 9. Middle East & Africa Organic Farming Market Size Growth Rate (2018-2029) & (US$ Million)
    Figure 10. Product Picture of Pure Organic Farming
    Figure 11. Global Pure Organic Farming Market Size (US$ Million) & YoY Growth (2018-2029)
    Figure 12. Product Picture of Integrated Organic Farming
    Figure 13. Global Integrated Organic Farming Market Size (US$ Million) & YoY Growth (2018-2029)
    Figure 14. Global Organic Farming Market Size Share by Type: 2022 & 2029
    Figure 15. North America Organic Farming Revenue Market Share by Type (2018-2029)
    Figure 16. Europe Organic Farming Revenue Market Share by Type (2018-2029)
    Figure 17. Asia-Pacific Organic Farming Revenue Market Share by Type (2018-2029)
    Figure 18. Latin America Organic Farming Revenue Market Share by Type (2018-2029)
    Figure 19. Middle East and Africa Organic Farming Revenue Market Share by Type (2018-2029)
    Figure 20. Agricultural Companies Market Size (US$ Million) & YoY Growth (2018-2029)
    Figure 21. Organic Farms Market Size (US$ Million) & YoY Growth (2018-2029)
    Figure 22. Global Organic Farming Market Size Share by Application: 2022 & 2029
    Figure 23. North America Organic Farming Revenue Market Share by Application (2018-2029)
    Figure 24. Europe Organic Farming Revenue Market Share by Application (2018-2029)
    Figure 25. Asia-Pacific Organic Farming Revenue Market Share by Application (2018-2029)
    Figure 26. Latin America Organic Farming Revenue Market Share by Application (2018-2029)
    Figure 27. Middle East and Africa Organic Farming Revenue Market Share by Application (2018-2029)
    Figure 28. Organic Farming Market Share by Company Type (Tier 1, Tier 2 and Tier 3): 2018 VS 2022
    Figure 29. Global Top 5 and Top 10 Players Organic Farming Market Share in 2022
    Figure 30. North America Organic Farming Market Share by Country (2018-2029)
    Figure 31. U.S. Organic Farming Market Size (2018-2029) & (US$ Million)
    Figure 32. Canada Organic Farming Market Size (2018-2029) & (US$ Million)
    Figure 33. Germany Organic Farming Market Size (2018-2029) & (US$ Million)
    Figure 34. France Organic Farming Market Size (2018-2029) & (US$ Million)
    Figure 35. U.K. Organic Farming Market Size (2018-2029) & (US$ Million)
    Figure 36. Italy Organic Farming Market Size (2018-2029) & (US$ Million)
    Figure 37. Russia Organic Farming Market Size (2018-2029) & (US$ Million)
    Figure 38. Nordic Countries Organic Farming Market Size (2018-2029) & (US$ Million)
    Figure 39. Asia-Pacific Organic Farming Market Share by Region (2018-2029)
    Figure 40. China Organic Farming Market Size (2018-2029) & (US$ Million)
    Figure 41. Japan Organic Farming Market Size (2018-2029) & (US$ Million)
    Figure 42. South Korea Organic Farming Market Size (2018-2029) & (US$ Million)
    Figure 43. Southeast Asia Organic Farming Market Size (2018-2029) & (US$ Million)
    Figure 44. India Organic Farming Market Size (2018-2029) & (US$ Million)
    Figure 45. Australia Organic Farming Market Size (2018-2029) & (US$ Million)
    Figure 46. Latin America Organic Farming Market Share by Country (2018-2029)
    Figure 47. Mexico Organic Farming Market Size (2018-2029) & (US$ Million)
    Figure 48. Brazil Organic Farming Market Size (2018-2029) & (US$ Million)
    Figure 49. Middle East & Africa Organic Farming Market Share by Country (2018-2029)
    Figure 50. Turkey Organic Farming Market Size (2018-2029) & (US$ Million)
    Figure 51. Saudi Arabia Organic Farming Market Size (2018-2029) & (US$ Million)
    Figure 52. UAE Organic Farming Market Size (2018-2029) & (US$ Million)
    Figure 53. Bottom-up and Top-down Approaches for This Report
SELECT A FORMAT
Added to Cart
Electronic (PDF)

$3350

This license allows only one user to access the PDF.
Electronic (PDF)

$5025

This license allows 1 - 5 user to access the PDF, license is suitable for small groups of 5 users working together
Electronic (PDF)

$6700

This license allows users/teams in a same Enterprise to use this report, various departments within an enterpise can use this report
Add to Cart
Buy Now (15% Discount)

OUR CUSTOMER

SecuX Technology Inc

SIMILAR REPORTS