List of Tables
Table 1. Global Library Automation Services and System Market Size Growth Rate by Type (US$ Million): 2020 VS 2024 VS 2031
Table 2. Key Players of Windows
Table 3. Key Players of Linux
Table 4. Key Players of OS
Table 5. Global Library Automation Services and System Market Size Growth by Application (US$ Million): 2020 VS 2024 VS 2031
Table 6. Global Library Automation Services and System Market Size by Region (US$ Million): 2020 VS 2024 VS 2031
Table 7. Global Library Automation Services and System Market Size by Region (2020-2025) & (US$ Million)
Table 8. Global Library Automation Services and System Market Share by Region (2020-2025)
Table 9. Global Library Automation Services and System Forecasted Market Size by Region (2026-2031) & (US$ Million)
Table 10. Global Library Automation Services and System Market Share by Region (2026-2031)
Table 11. Library Automation Services and System Market Trends
Table 12. Library Automation Services and System Market Drivers
Table 13. Library Automation Services and System Market Challenges
Table 14. Library Automation Services and System Market Restraints
Table 15. Global Library Automation Services and System Revenue by Players (2020-2025) & (US$ Million)
Table 16. Global Library Automation Services and System Market Share by Players (2020-2025)
Table 17. Global Top Library Automation Services and System Players by Company Type (Tier 1, Tier 2, and Tier 3) & (based on the Revenue in Library Automation Services and System as of 2024)
Table 18. Ranking of Global Top Library Automation Services and System Companies by Revenue (US$ Million) in 2024
Table 19. Global 5 Largest Players Market Share by Library Automation Services and System Revenue (CR5 and HHI) & (2020-2025)
Table 20. Global Key Players of Library Automation Services and System, Headquarters and Area Served
Table 21. Global Key Players of Library Automation Services and System, Product and Application
Table 22. Global Key Players of Library Automation Services and System, Date of Enter into This Industry
Table 23. Mergers & Acquisitions, Expansion Plans
Table 24. Global Library Automation Services and System Market Size by Type (2020-2025) & (US$ Million)
Table 25. Global Library Automation Services and System Revenue Market Share by Type (2020-2025)
Table 26. Global Library Automation Services and System Forecasted Market Size by Type (2026-2031) & (US$ Million)
Table 27. Global Library Automation Services and System Revenue Market Share by Type (2026-2031)
Table 28. Global Library Automation Services and System Market Size by Application (2020-2025) & (US$ Million)
Table 29. Global Library Automation Services and System Revenue Market Share by Application (2020-2025)
Table 30. Global Library Automation Services and System Forecasted Market Size by Application (2026-2031) & (US$ Million)
Table 31. Global Library Automation Services and System Revenue Market Share by Application (2026-2031)
Table 32. North America Library Automation Services and System Market Size Growth Rate by Country (US$ Million): 2020 VS 2024 VS 2031
Table 33. North America Library Automation Services and System Market Size by Country (2020-2025) & (US$ Million)
Table 34. North America Library Automation Services and System Market Size by Country (2026-2031) & (US$ Million)
Table 35. Europe Library Automation Services and System Market Size Growth Rate by Country (US$ Million): 2020 VS 2024 VS 2031
Table 36. Europe Library Automation Services and System Market Size by Country (2020-2025) & (US$ Million)
Table 37. Europe Library Automation Services and System Market Size by Country (2026-2031) & (US$ Million)
Table 38. Asia-Pacific Library Automation Services and System Market Size Growth Rate by Region (US$ Million): 2020 VS 2024 VS 2031
Table 39. Asia-Pacific Library Automation Services and System Market Size by Region (2020-2025) & (US$ Million)
Table 40. Asia-Pacific Library Automation Services and System Market Size by Region (2026-2031) & (US$ Million)
Table 41. Latin America Library Automation Services and System Market Size Growth Rate by Country (US$ Million): 2020 VS 2024 VS 2031
Table 42. Latin America Library Automation Services and System Market Size by Country (2020-2025) & (US$ Million)
Table 43. Latin America Library Automation Services and System Market Size by Country (2026-2031) & (US$ Million)
Table 44. Middle East & Africa Library Automation Services and System Market Size Growth Rate by Country (US$ Million): 2020 VS 2024 VS 2031
Table 45. Middle East & Africa Library Automation Services and System Market Size by Country (2020-2025) & (US$ Million)
Table 46. Middle East & Africa Library Automation Services and System Market Size by Country (2026-2031) & (US$ Million)
Table 47. Auto-Graphics Company Details
Table 48. Auto-Graphics Business Overview
Table 49. Auto-Graphics Library Automation Services and System Product
Table 50. Auto-Graphics Revenue in Library Automation Services and System Business (2020-2025) & (US$ Million)
Table 51. Auto-Graphics Recent Development
Table 52. Brodart Company Details
Table 53. Brodart Business Overview
Table 54. Brodart Library Automation Services and System Product
Table 55. Brodart Revenue in Library Automation Services and System Business (2020-2025) & (US$ Million)
Table 56. Brodart Recent Development
Table 57. CASPR Library Systems Company Details
Table 58. CASPR Library Systems Business Overview
Table 59. CASPR Library Systems Library Automation Services and System Product
Table 60. CASPR Library Systems Revenue in Library Automation Services and System Business (2020-2025) & (US$ Million)
Table 61. CASPR Library Systems Recent Development
Table 62. COMPanion Corporation Company Details
Table 63. COMPanion Corporation Business Overview
Table 64. COMPanion Corporation Library Automation Services and System Product
Table 65. COMPanion Corporation Revenue in Library Automation Services and System Business (2020-2025) & (US$ Million)
Table 66. COMPanion Corporation Recent Development
Table 67. CyberTools Company Details
Table 68. CyberTools Business Overview
Table 69. CyberTools Library Automation Services and System Product
Table 70. CyberTools Revenue in Library Automation Services and System Business (2020-2025) & (US$ Million)
Table 71. CyberTools Recent Development
Table 72. Eloquent Systems Company Details
Table 73. Eloquent Systems Business Overview
Table 74. Eloquent Systems Library Automation Services and System Product
Table 75. Eloquent Systems Revenue in Library Automation Services and System Business (2020-2025) & (US$ Million)
Table 76. Eloquent Systems Recent Development
Table 77. Ex Libris Group Company Details
Table 78. Ex Libris Group Business Overview
Table 79. Ex Libris Group Library Automation Services and System Product
Table 80. Ex Libris Group Revenue in Library Automation Services and System Business (2020-2025) & (US$ Million)
Table 81. Ex Libris Group Recent Development
Table 82. Electronic Online Systems Company Details
Table 83. Electronic Online Systems Business Overview
Table 84. Electronic Online Systems Library Automation Services and System Product
Table 85. Electronic Online Systems Revenue in Library Automation Services and System Business (2020-2025) & (US$ Million)
Table 86. Electronic Online Systems Recent Development
Table 87. Follett Software Company Company Details
Table 88. Follett Software Company Business Overview
Table 89. Follett Software Company Library Automation Services and System Product
Table 90. Follett Software Company Revenue in Library Automation Services and System Business (2020-2025) & (US$ Million)
Table 91. Follett Software Company Recent Development
Table 92. Infor Library and Information Solutions Company Details
Table 93. Infor Library and Information Solutions Business Overview
Table 94. Infor Library and Information Solutions Library Automation Services and System Product
Table 95. Infor Library and Information Solutions Revenue in Library Automation Services and System Business (2020-2025) & (US$ Million)
Table 96. Infor Library and Information Solutions Recent Development
Table 97. Inmagic Company Details
Table 98. Inmagic Business Overview
Table 99. Inmagic Library Automation Services and System Product
Table 100. Inmagic Revenue in Library Automation Services and System Business (2020-2025) & (US$ Million)
Table 101. Inmagic Recent Development
Table 102. Innovative Interfaces Company Details
Table 103. Innovative Interfaces Business Overview
Table 104. Innovative Interfaces Library Automation Services and System Product
Table 105. Innovative Interfaces Revenue in Library Automation Services and System Business (2020-2025) & (US$ Million)
Table 106. Innovative Interfaces Recent Development
Table 107. Insignia Software Company Details
Table 108. Insignia Software Business Overview
Table 109. Insignia Software Library Automation Services and System Product
Table 110. Insignia Software Revenue in Library Automation Services and System Business (2020-2025) & (US$ Million)
Table 111. Insignia Software Recent Development
Table 112. Isacsoft Company Details
Table 113. Isacsoft Business Overview
Table 114. Isacsoft Library Automation Services and System Product
Table 115. Isacsoft Revenue in Library Automation Services and System Business (2020-2025) & (US$ Million)
Table 116. Isacsoft Recent Development
Table 117. Keystone Systems Company Details
Table 118. Keystone Systems Business Overview
Table 119. Keystone Systems Library Automation Services and System Product
Table 120. Keystone Systems Revenue in Library Automation Services and System Business (2020-2025) & (US$ Million)
Table 121. Keystone Systems Recent Development
Table 122. LibLime Company Details
Table 123. LibLime Business Overview
Table 124. LibLime Library Automation Services and System Product
Table 125. LibLime Revenue in Library Automation Services and System Business (2020-2025) & (US$ Million)
Table 126. LibLime Recent Development
Table 127. Mandarin Library Automation Company Details
Table 128. Mandarin Library Automation Business Overview
Table 129. Mandarin Library Automation Library Automation Services and System Product
Table 130. Mandarin Library Automation Revenue in Library Automation Services and System Business (2020-2025) & (US$ Million)
Table 131. Mandarin Library Automation Recent Development
Table 132. New Generation Technologies Company Details
Table 133. New Generation Technologies Business Overview
Table 134. New Generation Technologies Library Automation Services and System Product
Table 135. New Generation Technologies Revenue in Library Automation Services and System Business (2020-2025) & (US$ Million)
Table 136. New Generation Technologies Recent Development
Table 137. Open Text Company Details
Table 138. Open Text Business Overview
Table 139. Open Text Library Automation Services and System Product
Table 140. Open Text Revenue in Library Automation Services and System Business (2020-2025) & (US$ Million)
Table 141. Open Text Recent Development
Table 142. Polaris Library Systems Company Details
Table 143. Polaris Library Systems Business Overview
Table 144. Polaris Library Systems Library Automation Services and System Product
Table 145. Polaris Library Systems Revenue in Library Automation Services and System Business (2020-2025) & (US$ Million)
Table 146. Polaris Library Systems Recent Development
Table 147. SirsiDynix Company Details
Table 148. SirsiDynix Business Overview
Table 149. SirsiDynix Library Automation Services and System Product
Table 150. SirsiDynix Revenue in Library Automation Services and System Business (2020-2025) & (US$ Million)
Table 151. SirsiDynix Recent Development
Table 152. Softlink Company Details
Table 153. Softlink Business Overview
Table 154. Softlink Library Automation Services and System Product
Table 155. Softlink Revenue in Library Automation Services and System Business (2020-2025) & (US$ Million)
Table 156. Softlink Recent Development
Table 157. Surpass Software Company Details
Table 158. Surpass Software Business Overview
Table 159. Surpass Software Library Automation Services and System Product
Table 160. Surpass Software Revenue in Library Automation Services and System Business (2020-2025) & (US$ Million)
Table 161. Surpass Software Recent Development
Table 162. SydneyPLUS International Library Systems Company Details
Table 163. SydneyPLUS International Library Systems Business Overview
Table 164. SydneyPLUS International Library Systems Library Automation Services and System Product
Table 165. SydneyPLUS International Library Systems Revenue in Library Automation Services and System Business (2020-2025) & (US$ Million)
Table 166. SydneyPLUS International Library Systems Recent Development
Table 167. The Library Corporation Company Details
Table 168. The Library Corporation Business Overview
Table 169. The Library Corporation Library Automation Services and System Product
Table 170. The Library Corporation Revenue in Library Automation Services and System Business (2020-2025) & (US$ Million)
Table 171. The Library Corporation Recent Development
Table 172. Visionary Technology In Library Solutions Company Details
Table 173. Visionary Technology In Library Solutions Business Overview
Table 174. Visionary Technology In Library Solutions Library Automation Services and System Product
Table 175. Visionary Technology In Library Solutions Revenue in Library Automation Services and System Business (2020-2025) & (US$ Million)
Table 176. Visionary Technology In Library Solutions Recent Development
Table 177. Research Programs/Design for This Report
Table 178. Key Data Information from Secondary Sources
Table 179. Key Data Information from Primary Sources
Table 180. Authors List of This Report
List of Figures
Figure 1. Library Automation Services and System Picture
Figure 2. Global Library Automation Services and System Market Size Comparison by Type (2020-2031) & (US$ Million)
Figure 3. Global Library Automation Services and System Market Share by Type: 2024 VS 2031
Figure 4. Windows Features
Figure 5. Linux Features
Figure 6. OS Features
Figure 7. Global Library Automation Services and System Market Size by Application (2020-2031) & (US$ Million)
Figure 8. Global Library Automation Services and System Market Share by Application: 2024 VS 2031
Figure 9. Public Library Case Studies
Figure 10. K-12 Library Case Studies
Figure 11. Higher Education Library Case Studies
Figure 12. Library Automation Services and System Report Years Considered
Figure 13. Global Library Automation Services and System Market Size (US$ Million), Year-over-Year: 2020-2031
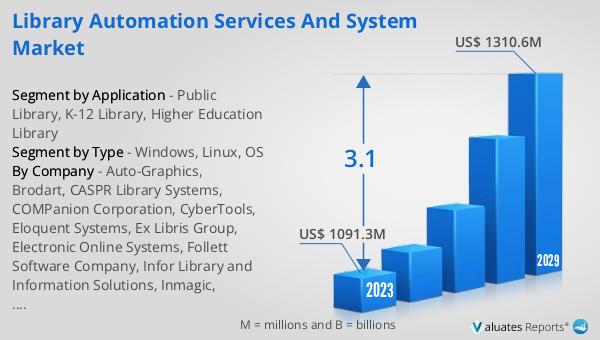
Figure 14. Global Library Automation Services and System Market Size, (US$ Million), 2020 VS 2024 VS 2031
Figure 15. Global Library Automation Services and System Market Share by Region: 2024 VS 2031
Figure 16. Global Library Automation Services and System Market Share by Players in 2024
Figure 17. Global Top Library Automation Services and System Players by Company Type (Tier 1, Tier 2, and Tier 3) & (based on the Revenue in Library Automation Services and System as of 2024)
Figure 18. The Top 10 and 5 Players Market Share by Library Automation Services and System Revenue in 2024
Figure 19. North America Library Automation Services and System Market Size YoY Growth (2020-2031) & (US$ Million)
Figure 20. North America Library Automation Services and System Market Share by Country (2020-2031)
Figure 21. United States Library Automation Services and System Market Size YoY Growth (2020-2031) & (US$ Million)
Figure 22. Canada Library Automation Services and System Market Size YoY Growth (2020-2031) & (US$ Million)
Figure 23. Europe Library Automation Services and System Market Size YoY Growth (2020-2031) & (US$ Million)
Figure 24. Europe Library Automation Services and System Market Share by Country (2020-2031)
Figure 25. Germany Library Automation Services and System Market Size YoY Growth (2020-2031) & (US$ Million)
Figure 26. France Library Automation Services and System Market Size YoY Growth (2020-2031) & (US$ Million)
Figure 27. U.K. Library Automation Services and System Market Size YoY Growth (2020-2031) & (US$ Million)
Figure 28. Italy Library Automation Services and System Market Size YoY Growth (2020-2031) & (US$ Million)
Figure 29. Russia Library Automation Services and System Market Size YoY Growth (2020-2031) & (US$ Million)
Figure 30. Nordic Countries Library Automation Services and System Market Size YoY Growth (2020-2031) & (US$ Million)
Figure 31. Asia-Pacific Library Automation Services and System Market Size YoY Growth (2020-2031) & (US$ Million)
Figure 32. Asia-Pacific Library Automation Services and System Market Share by Region (2020-2031)
Figure 33. China Library Automation Services and System Market Size YoY Growth (2020-2031) & (US$ Million)
Figure 34. Japan Library Automation Services and System Market Size YoY Growth (2020-2031) & (US$ Million)
Figure 35. South Korea Library Automation Services and System Market Size YoY Growth (2020-2031) & (US$ Million)
Figure 36. Southeast Asia Library Automation Services and System Market Size YoY Growth (2020-2031) & (US$ Million)
Figure 37. India Library Automation Services and System Market Size YoY Growth (2020-2031) & (US$ Million)
Figure 38. Australia Library Automation Services and System Market Size YoY Growth (2020-2031) & (US$ Million)
Figure 39. Latin America Library Automation Services and System Market Size YoY Growth (2020-2031) & (US$ Million)
Figure 40. Latin America Library Automation Services and System Market Share by Country (2020-2031)
Figure 41. Mexico Library Automation Services and System Market Size YoY Growth (2020-2031) & (US$ Million)
Figure 42. Brazil Library Automation Services and System Market Size YoY Growth (2020-2031) & (US$ Million)
Figure 43. Middle East & Africa Library Automation Services and System Market Size YoY Growth (2020-2031) & (US$ Million)
Figure 44. Middle East & Africa Library Automation Services and System Market Share by Country (2020-2031)
Figure 45. Turkey Library Automation Services and System Market Size YoY Growth (2020-2031) & (US$ Million)
Figure 46. Saudi Arabia Library Automation Services and System Market Size YoY Growth (2020-2031) & (US$ Million)
Figure 47. UAE Library Automation Services and System Market Size YoY Growth (2020-2031) & (US$ Million)
Figure 48. Auto-Graphics Revenue Growth Rate in Library Automation Services and System Business (2020-2025)
Figure 49. Brodart Revenue Growth Rate in Library Automation Services and System Business (2020-2025)
Figure 50. CASPR Library Systems Revenue Growth Rate in Library Automation Services and System Business (2020-2025)
Figure 51. COMPanion Corporation Revenue Growth Rate in Library Automation Services and System Business (2020-2025)
Figure 52. CyberTools Revenue Growth Rate in Library Automation Services and System Business (2020-2025)
Figure 53. Eloquent Systems Revenue Growth Rate in Library Automation Services and System Business (2020-2025)
Figure 54. Ex Libris Group Revenue Growth Rate in Library Automation Services and System Business (2020-2025)
Figure 55. Electronic Online Systems Revenue Growth Rate in Library Automation Services and System Business (2020-2025)
Figure 56. Follett Software Company Revenue Growth Rate in Library Automation Services and System Business (2020-2025)
Figure 57. Infor Library and Information Solutions Revenue Growth Rate in Library Automation Services and System Business (2020-2025)
Figure 58. Inmagic Revenue Growth Rate in Library Automation Services and System Business (2020-2025)
Figure 59. Innovative Interfaces Revenue Growth Rate in Library Automation Services and System Business (2020-2025)
Figure 60. Insignia Software Revenue Growth Rate in Library Automation Services and System Business (2020-2025)
Figure 61. Isacsoft Revenue Growth Rate in Library Automation Services and System Business (2020-2025)
Figure 62. Keystone Systems Revenue Growth Rate in Library Automation Services and System Business (2020-2025)
Figure 63. LibLime Revenue Growth Rate in Library Automation Services and System Business (2020-2025)
Figure 64. Mandarin Library Automation Revenue Growth Rate in Library Automation Services and System Business (2020-2025)
Figure 65. New Generation Technologies Revenue Growth Rate in Library Automation Services and System Business (2020-2025)
Figure 66. Open Text Revenue Growth Rate in Library Automation Services and System Business (2020-2025)
Figure 67. Polaris Library Systems Revenue Growth Rate in Library Automation Services and System Business (2020-2025)
Figure 68. SirsiDynix Revenue Growth Rate in Library Automation Services and System Business (2020-2025)
Figure 69. Softlink Revenue Growth Rate in Library Automation Services and System Business (2020-2025)
Figure 70. Surpass Software Revenue Growth Rate in Library Automation Services and System Business (2020-2025)
Figure 71. SydneyPLUS International Library Systems Revenue Growth Rate in Library Automation Services and System Business (2020-2025)
Figure 72. The Library Corporation Revenue Growth Rate in Library Automation Services and System Business (2020-2025)
Figure 73. Visionary Technology In Library Solutions Revenue Growth Rate in Library Automation Services and System Business (2020-2025)
Figure 74. Bottom-up and Top-down Approaches for This Report
Figure 75. Data Triangulation
Figure 76. Key Executives Interviewed