List of Tables
Table 1. Global Pet Shops Market Size Growth Rate by Type (US$ Million): 2020 VS 2024 VS 2031
Table 2. Key Players of Live Pets
Table 3. Key Players of Pet Treats
Table 4. Key Players of Others
Table 5. Global Pet Shops Market Size Growth Rate by Service Types (US$ Million): 2020 VS 2024 VS 2031
Table 6. Key Players of Pet Grooming Salon
Table 7. Key Players of Pet Care Service Shop
Table 8. Key Players of Pet Boarding Shop
Table 9. Key Players of Pet Training Center
Table 10. Key Players of Pet Bathing & Grooming Shop
Table 11. Global Pet Shops Market Size Growth Rate by Consumer Levels (US$ Million): 2020 VS 2024 VS 2031
Table 12. Key Players of Mass-Market Pet Store
Table 13. Key Players of Premium Pet Store
Table 14. Key Players of Luxury Pet Boutique
Table 15. Global Pet Shops Market Size Growth by Application (US$ Million): 2020 VS 2024 VS 2031
Table 16. Global Pet Shops Market Size by Region (US$ Million): 2020 VS 2024 VS 2031
Table 17. Global Pet Shops Market Size by Region (2020-2025) & (US$ Million)
Table 18. Global Pet Shops Market Share by Region (2020-2025)
Table 19. Global Pet Shops Forecasted Market Size by Region (2026-2031) & (US$ Million)
Table 20. Global Pet Shops Market Share by Region (2026-2031)
Table 21. Pet Shops Market Trends
Table 22. Pet Shops Market Drivers
Table 23. Pet Shops Market Challenges
Table 24. Pet Shops Market Restraints
Table 25. Global Pet Shops Revenue by Players (2020-2025) & (US$ Million)
Table 26. Global Pet Shops Market Share by Players (2020-2025)
Table 27. Global Top Pet Shops Players by Company Type (Tier 1, Tier 2, and Tier 3) & (based on the Revenue in Pet Shops as of 2024)
Table 28. Ranking of Global Top Pet Shops Companies by Revenue (US$ Million) in 2024
Table 29. Global 5 Largest Players Market Share by Pet Shops Revenue (CR5 and HHI) & (2020-2025)
Table 30. Global Key Players of Pet Shops, Headquarters and Area Served
Table 31. Global Key Players of Pet Shops, Product and Application
Table 32. Global Key Players of Pet Shops, Date of Enter into This Industry
Table 33. Mergers & Acquisitions, Expansion Plans
Table 34. Global Pet Shops Market Size by Type (2020-2025) & (US$ Million)
Table 35. Global Pet Shops Revenue Market Share by Type (2020-2025)
Table 36. Global Pet Shops Forecasted Market Size by Type (2026-2031) & (US$ Million)
Table 37. Global Pet Shops Revenue Market Share by Type (2026-2031)
Table 38. Global Pet Shops Market Size by Application (2020-2025) & (US$ Million)
Table 39. Global Pet Shops Revenue Market Share by Application (2020-2025)
Table 40. Global Pet Shops Forecasted Market Size by Application (2026-2031) & (US$ Million)
Table 41. Global Pet Shops Revenue Market Share by Application (2026-2031)
Table 42. North America Pet Shops Market Size Growth Rate by Country (US$ Million): 2020 VS 2024 VS 2031
Table 43. North America Pet Shops Market Size by Country (2020-2025) & (US$ Million)
Table 44. North America Pet Shops Market Size by Country (2026-2031) & (US$ Million)
Table 45. Europe Pet Shops Market Size Growth Rate by Country (US$ Million): 2020 VS 2024 VS 2031
Table 46. Europe Pet Shops Market Size by Country (2020-2025) & (US$ Million)
Table 47. Europe Pet Shops Market Size by Country (2026-2031) & (US$ Million)
Table 48. Asia-Pacific Pet Shops Market Size Growth Rate by Region (US$ Million): 2020 VS 2024 VS 2031
Table 49. Asia-Pacific Pet Shops Market Size by Region (2020-2025) & (US$ Million)
Table 50. Asia-Pacific Pet Shops Market Size by Region (2026-2031) & (US$ Million)
Table 51. Latin America Pet Shops Market Size Growth Rate by Country (US$ Million): 2020 VS 2024 VS 2031
Table 52. Latin America Pet Shops Market Size by Country (2020-2025) & (US$ Million)
Table 53. Latin America Pet Shops Market Size by Country (2026-2031) & (US$ Million)
Table 54. Middle East & Africa Pet Shops Market Size Growth Rate by Country (US$ Million): 2020 VS 2024 VS 2031
Table 55. Middle East & Africa Pet Shops Market Size by Country (2020-2025) & (US$ Million)
Table 56. Middle East & Africa Pet Shops Market Size by Country (2026-2031) & (US$ Million)
Table 57. PETSMART Company Details
Table 58. PETSMART Business Overview
Table 59. PETSMART Pet Shops Product
Table 60. PETSMART Revenue in Pet Shops Business (2020-2025) & (US$ Million)
Table 61. PETSMART Recent Development
Table 62. PETCO Company Details
Table 63. PETCO Business Overview
Table 64. PETCO Pet Shops Product
Table 65. PETCO Revenue in Pet Shops Business (2020-2025) & (US$ Million)
Table 66. PETCO Recent Development
Table 67. PET VALU Company Details
Table 68. PET VALU Business Overview
Table 69. PET VALU Pet Shops Product
Table 70. PET VALU Revenue in Pet Shops Business (2020-2025) & (US$ Million)
Table 71. PET VALU Recent Development
Table 72. PET SUPPLIES PLUS Company Details
Table 73. PET SUPPLIES PLUS Business Overview
Table 74. PET SUPPLIES PLUS Pet Shops Product
Table 75. PET SUPPLIES PLUS Revenue in Pet Shops Business (2020-2025) & (US$ Million)
Table 76. PET SUPPLIES PLUS Recent Development
Table 77. PETSENSE Company Details
Table 78. PETSENSE Business Overview
Table 79. PETSENSE Pet Shops Product
Table 80. PETSENSE Revenue in Pet Shops Business (2020-2025) & (US$ Million)
Table 81. PETSENSE Recent Development
Table 82. PETLAND Company Details
Table 83. PETLAND Business Overview
Table 84. PETLAND Pet Shops Product
Table 85. PETLAND Revenue in Pet Shops Business (2020-2025) & (US$ Million)
Table 86. PETLAND Recent Development
Table 87. WOOF GANG BAKERY Company Details
Table 88. WOOF GANG BAKERY Business Overview
Table 89. WOOF GANG BAKERY Pet Shops Product
Table 90. WOOF GANG BAKERY Revenue in Pet Shops Business (2020-2025) & (US$ Million)
Table 91. WOOF GANG BAKERY Recent Development
Table 92. HOLLYWOOD FEED Company Details
Table 93. HOLLYWOOD FEED Business Overview
Table 94. HOLLYWOOD FEED Pet Shops Product
Table 95. HOLLYWOOD FEED Revenue in Pet Shops Business (2020-2025) & (US$ Million)
Table 96. HOLLYWOOD FEED Recent Development
Table 97. PETLAND DISCOUNTS Company Details
Table 98. PETLAND DISCOUNTS Business Overview
Table 99. PETLAND DISCOUNTS Pet Shops Product
Table 100. PETLAND DISCOUNTS Revenue in Pet Shops Business (2020-2025) & (US$ Million)
Table 101. PETLAND DISCOUNTS Recent Development
Table 102. UNLEASHED BY PETCO Company Details
Table 103. UNLEASHED BY PETCO Business Overview
Table 104. UNLEASHED BY PETCO Pet Shops Product
Table 105. UNLEASHED BY PETCO Revenue in Pet Shops Business (2020-2025) & (US$ Million)
Table 106. UNLEASHED BY PETCO Recent Development
Table 107. MONDOU Company Details
Table 108. MONDOU Business Overview
Table 109. MONDOU Pet Shops Product
Table 110. MONDOU Revenue in Pet Shops Business (2020-2025) & (US$ Million)
Table 111. MONDOU Recent Development
Table 112. PET PLANET Company Details
Table 113. PET PLANET Business Overview
Table 114. PET PLANET Pet Shops Product
Table 115. PET PLANET Revenue in Pet Shops Business (2020-2025) & (US$ Million)
Table 116. PET PLANET Recent Development
Table 117. PET PEOPLE Company Details
Table 118. PET PEOPLE Business Overview
Table 119. PET PEOPLE Pet Shops Product
Table 120. PET PEOPLE Revenue in Pet Shops Business (2020-2025) & (US$ Million)
Table 121. PET PEOPLE Recent Development
Table 122. MUD BAY Company Details
Table 123. MUD BAY Business Overview
Table 124. MUD BAY Pet Shops Product
Table 125. MUD BAY Revenue in Pet Shops Business (2020-2025) & (US$ Million)
Table 126. MUD BAY Recent Development
Table 127. PET DEPOT Company Details
Table 128. PET DEPOT Business Overview
Table 129. PET DEPOT Pet Shops Product
Table 130. PET DEPOT Revenue in Pet Shops Business (2020-2025) & (US$ Million)
Table 131. PET DEPOT Recent Development
Table 132. CONCORD PET Company Details
Table 133. CONCORD PET Business Overview
Table 134. CONCORD PET Pet Shops Product
Table 135. CONCORD PET Revenue in Pet Shops Business (2020-2025) & (US$ Million)
Table 136. CONCORD PET Recent Development
Table 137. PETKIT Network Technology Company Details
Table 138. PETKIT Network Technology Business Overview
Table 139. PETKIT Network Technology Pet Shops Product
Table 140. PETKIT Network Technology Revenue in Pet Shops Business (2020-2025) & (US$ Million)
Table 141. PETKIT Network Technology Recent Development
Table 142. TYGRIN Company Details
Table 143. TYGRIN Business Overview
Table 144. TYGRIN Pet Shops Product
Table 145. TYGRIN Revenue in Pet Shops Business (2020-2025) & (US$ Million)
Table 146. TYGRIN Recent Development
Table 147. Beijing Leepet Company Details
Table 148. Beijing Leepet Business Overview
Table 149. Beijing Leepet Pet Shops Product
Table 150. Beijing Leepet Revenue in Pet Shops Business (2020-2025) & (US$ Million)
Table 151. Beijing Leepet Recent Development
Table 152. Beijing HaoTang Company Details
Table 153. Beijing HaoTang Business Overview
Table 154. Beijing HaoTang Pet Shops Product
Table 155. Beijing HaoTang Revenue in Pet Shops Business (2020-2025) & (US$ Million)
Table 156. Beijing HaoTang Recent Development
Table 157. Shenzhen Zhuazhua Company Details
Table 158. Shenzhen Zhuazhua Business Overview
Table 159. Shenzhen Zhuazhua Pet Shops Product
Table 160. Shenzhen Zhuazhua Revenue in Pet Shops Business (2020-2025) & (US$ Million)
Table 161. Shenzhen Zhuazhua Recent Development
Table 162. Wuhu Brgon Company Details
Table 163. Wuhu Brgon Business Overview
Table 164. Wuhu Brgon Pet Shops Product
Table 165. Wuhu Brgon Revenue in Pet Shops Business (2020-2025) & (US$ Million)
Table 166. Wuhu Brgon Recent Development
Table 167. Shanghai Chong'er Company Details
Table 168. Shanghai Chong'er Business Overview
Table 169. Shanghai Chong'er Pet Shops Product
Table 170. Shanghai Chong'er Revenue in Pet Shops Business (2020-2025) & (US$ Million)
Table 171. Shanghai Chong'er Recent Development
Table 172. Guangzhou Yourpet Company Details
Table 173. Guangzhou Yourpet Business Overview
Table 174. Guangzhou Yourpet Pet Shops Product
Table 175. Guangzhou Yourpet Revenue in Pet Shops Business (2020-2025) & (US$ Million)
Table 176. Guangzhou Yourpet Recent Development
Table 177. Beijing Petdog Company Details
Table 178. Beijing Petdog Business Overview
Table 179. Beijing Petdog Pet Shops Product
Table 180. Beijing Petdog Revenue in Pet Shops Business (2020-2025) & (US$ Million)
Table 181. Beijing Petdog Recent Development
Table 182. Beijing Wangshidai Company Details
Table 183. Beijing Wangshidai Business Overview
Table 184. Beijing Wangshidai Pet Shops Product
Table 185. Beijing Wangshidai Revenue in Pet Shops Business (2020-2025) & (US$ Million)
Table 186. Beijing Wangshidai Recent Development
Table 187. Research Programs/Design for This Report
Table 188. Key Data Information from Secondary Sources
Table 189. Key Data Information from Primary Sources
Table 190. Authors List of This Report
List of Figures
Figure 1. Pet Shops Picture
Figure 2. Global Pet Shops Market Size Comparison by Type (2020-2031) & (US$ Million)
Figure 3. Global Pet Shops Market Share by Type: 2024 VS 2031
Figure 4. Live Pets Features
Figure 5. Pet Treats Features
Figure 6. Others Features
Figure 7. Global Pet Shops Market Size Comparison by Service Types (2020-2031) & (US$ Million)
Figure 8. Pet Grooming Salon Features
Figure 9. Pet Care Service Shop Features
Figure 10. Pet Boarding Shop Features
Figure 11. Pet Training Center Features
Figure 12. Pet Bathing & Grooming Shop Features
Figure 13. Global Pet Shops Market Size Comparison by Consumer Levels (2020-2031) & (US$ Million)
Figure 14. Mass-Market Pet Store Features
Figure 15. Premium Pet Store Features
Figure 16. Luxury Pet Boutique Features
Figure 17. Global Pet Shops Market Size by Application (2020-2031) & (US$ Million)
Figure 18. Global Pet Shops Market Share by Application: 2024 VS 2031
Figure 19. Exclusive Management Case Studies
Figure 20. Franchise Stores Case Studies
Figure 21. Pet Shops Report Years Considered
Figure 22. Global Pet Shops Market Size (US$ Million), Year-over-Year: 2020-2031
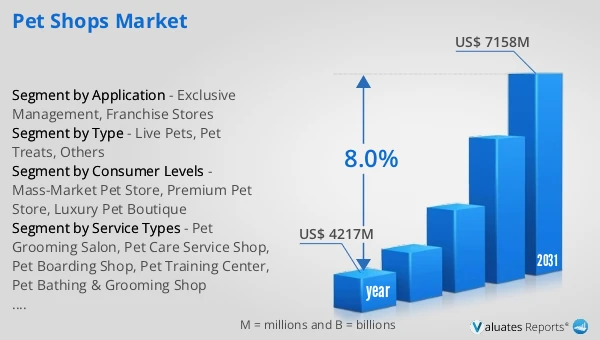
Figure 23. Global Pet Shops Market Size, (US$ Million), 2020 VS 2024 VS 2031
Figure 24. Global Pet Shops Market Share by Region: 2024 VS 2031
Figure 25. Global Pet Shops Market Share by Players in 2024
Figure 26. Global Pet Shops Market Share by Company Type (Tier 1, Tier 2, and Tier 3)
Figure 27. The Top 10 and 5 Players Market Share by Pet Shops Revenue in 2024
Figure 28. North America Pet Shops Market Size YoY Growth (2020-2031) & (US$ Million)
Figure 29. North America Pet Shops Market Share by Country (2020-2031)
Figure 30. United States Pet Shops Market Size YoY Growth (2020-2031) & (US$ Million)
Figure 31. Canada Pet Shops Market Size YoY Growth (2020-2031) & (US$ Million)
Figure 32. Europe Pet Shops Market Size YoY Growth (2020-2031) & (US$ Million)
Figure 33. Europe Pet Shops Market Share by Country (2020-2031)
Figure 34. Germany Pet Shops Market Size YoY Growth (2020-2031) & (US$ Million)
Figure 35. France Pet Shops Market Size YoY Growth (2020-2031) & (US$ Million)
Figure 36. U.K. Pet Shops Market Size YoY Growth (2020-2031) & (US$ Million)
Figure 37. Italy Pet Shops Market Size YoY Growth (2020-2031) & (US$ Million)
Figure 38. Russia Pet Shops Market Size YoY Growth (2020-2031) & (US$ Million)
Figure 39. Ireland Pet Shops Market Size YoY Growth (2020-2031) & (US$ Million)
Figure 40. Asia-Pacific Pet Shops Market Size YoY Growth (2020-2031) & (US$ Million)
Figure 41. Asia-Pacific Pet Shops Market Share by Region (2020-2031)
Figure 42. China Pet Shops Market Size YoY Growth (2020-2031) & (US$ Million)
Figure 43. Japan Pet Shops Market Size YoY Growth (2020-2031) & (US$ Million)
Figure 44. South Korea Pet Shops Market Size YoY Growth (2020-2031) & (US$ Million)
Figure 45. Southeast Asia Pet Shops Market Size YoY Growth (2020-2031) & (US$ Million)
Figure 46. India Pet Shops Market Size YoY Growth (2020-2031) & (US$ Million)
Figure 47. Australia & New Zealand Pet Shops Market Size YoY Growth (2020-2031) & (US$ Million)
Figure 48. Latin America Pet Shops Market Size YoY Growth (2020-2031) & (US$ Million)
Figure 49. Latin America Pet Shops Market Share by Country (2020-2031)
Figure 50. Mexico Pet Shops Market Size YoY Growth (2020-2031) & (US$ Million)
Figure 51. Brazil Pet Shops Market Size YoY Growth (2020-2031) & (US$ Million)
Figure 52. Middle East & Africa Pet Shops Market Size YoY Growth (2020-2031) & (US$ Million)
Figure 53. Middle East & Africa Pet Shops Market Share by Country (2020-2031)
Figure 54. Israel Pet Shops Market Size YoY Growth (2020-2031) & (US$ Million)
Figure 55. Saudi Arabia Pet Shops Market Size YoY Growth (2020-2031) & (US$ Million)
Figure 56. UAE Pet Shops Market Size YoY Growth (2020-2031) & (US$ Million)
Figure 57. PETSMART Revenue Growth Rate in Pet Shops Business (2020-2025)
Figure 58. PETCO Revenue Growth Rate in Pet Shops Business (2020-2025)
Figure 59. PET VALU Revenue Growth Rate in Pet Shops Business (2020-2025)
Figure 60. PET SUPPLIES PLUS Revenue Growth Rate in Pet Shops Business (2020-2025)
Figure 61. PETSENSE Revenue Growth Rate in Pet Shops Business (2020-2025)
Figure 62. PETLAND Revenue Growth Rate in Pet Shops Business (2020-2025)
Figure 63. WOOF GANG BAKERY Revenue Growth Rate in Pet Shops Business (2020-2025)
Figure 64. HOLLYWOOD FEED Revenue Growth Rate in Pet Shops Business (2020-2025)
Figure 65. PETLAND DISCOUNTS Revenue Growth Rate in Pet Shops Business (2020-2025)
Figure 66. UNLEASHED BY PETCO Revenue Growth Rate in Pet Shops Business (2020-2025)
Figure 67. MONDOU Revenue Growth Rate in Pet Shops Business (2020-2025)
Figure 68. PET PLANET Revenue Growth Rate in Pet Shops Business (2020-2025)
Figure 69. PET PEOPLE Revenue Growth Rate in Pet Shops Business (2020-2025)
Figure 70. MUD BAY Revenue Growth Rate in Pet Shops Business (2020-2025)
Figure 71. PET DEPOT Revenue Growth Rate in Pet Shops Business (2020-2025)
Figure 72. CONCORD PET Revenue Growth Rate in Pet Shops Business (2020-2025)
Figure 73. PETKIT Network Technology Revenue Growth Rate in Pet Shops Business (2020-2025)
Figure 74. TYGRIN Revenue Growth Rate in Pet Shops Business (2020-2025)
Figure 75. Beijing Leepet Revenue Growth Rate in Pet Shops Business (2020-2025)
Figure 76. Beijing HaoTang Revenue Growth Rate in Pet Shops Business (2020-2025)
Figure 77. Shenzhen Zhuazhua Revenue Growth Rate in Pet Shops Business (2020-2025)
Figure 78. Wuhu Brgon Revenue Growth Rate in Pet Shops Business (2020-2025)
Figure 79. Shanghai Chong'er Revenue Growth Rate in Pet Shops Business (2020-2025)
Figure 80. Guangzhou Yourpet Revenue Growth Rate in Pet Shops Business (2020-2025)
Figure 81. Beijing Petdog Revenue Growth Rate in Pet Shops Business (2020-2025)
Figure 82. Beijing Wangshidai Revenue Growth Rate in Pet Shops Business (2020-2025)
Figure 83. Bottom-up and Top-down Approaches for This Report
Figure 84. Data Triangulation
Figure 85. Key Executives Interviewed