List of Tables
Table 1. Global Lake Pigment Market Value by Type (US$ Million), 2025 vs 2032
Table 2. Global Lake Pigment Market Value by Application Grade (US$ Million), 2025 vs 2032
Table 3. Global Lake Pigment Market Value by Application (US$ Million), 2025 vs 2032
Table 4. Global Lake Pigment Production Capacity (Tons) by Manufacturers in 2025
Table 5. Global Lake Pigment Production by Manufacturers (Tons), 2021–2026
Table 6. Global Lake Pigment Production Market Share by Manufacturers (2021–2026)
Table 7. Global Lake Pigment Production Value by Manufacturers (US$ Million), 2021–2026
Table 8. Global Lake Pigment Production Value Share by Manufacturers (2021–2026)
Table 9. Global Key Players of Lake Pigment, Industry Ranking, 2024 vs 2025
Table 10. Classification of Companies by Tier (Tier 1, Tier 2, Tier 3), based on Lake Pigment Production Value, 2025
Table 11. Global Market Lake Pigment Average Price by Manufacturers (US$/Ton), 2021–2026
Table 12. Global Key Manufacturers of Lake Pigment, Manufacturing Footprints and Headquarters
Table 13. Global Key Manufacturers of Lake Pigment, Product Offerings and Applications
Table 14. Global Key Manufacturers of Lake Pigment, Date of Entry into the Industry
Table 15. Global Lake Pigment Manufacturers Market Concentration Ratio (CR5 and HHI)
Table 16. Mergers & Acquisitions and Expansion Plans
Table 17. Global Lake Pigment Production Value by Region: 2021 vs 2025 vs 2032 (US$ Million)
Table 18. Global Lake Pigment Production Value (US$ Million) by Region (2021–2026)
Table 19. Global Lake Pigment Production Value Market Share by Region (2021–2026)
Table 20. Global Lake Pigment Production Value (US$ Million) Forecast by Region (2027–2032)
Table 21. Global Lake Pigment Production Value Market Share Forecast by Region (2027–2032)
Table 22. Global Lake Pigment Production Comparison by Region: 2021 vs 2025 vs 2032 (Tons)
Table 23. Global Lake Pigment Production (Tons) by Region (2021–2026)
Table 24. Global Lake Pigment Production Market Share by Region (2021–2026)
Table 25. Global Lake Pigment Production (Tons) Forecast by Region (2027–2032)
Table 26. Global Lake Pigment Production Market Share Forecast by Region (2027–2032)
Table 27. Global Lake Pigment Market Average Price (US$/Ton) by Region (2021–2026)
Table 28. Global Lake Pigment Market Average Price (US$/Ton) by Region (2027–2032)
Table 29. Global Lake Pigment Consumption Growth Rate by Region: 2021 vs 2025 vs 2032 (Tons)
Table 30. Global Lake Pigment Consumption by Region (Tons), 2021–2026
Table 31. Global Lake Pigment Consumption Market Share by Region (2021–2026)
Table 32. Global Lake Pigment Forecasted Consumption by Region (Tons), 2027–2032
Table 33. Global Lake Pigment Forecasted Consumption Market Share by Region (2027–2032)
Table 34. North America Lake Pigment Consumption Growth Rate by Country: 2021 vs 2025 vs 2032 (Tons)
Table 35. North America Lake Pigment Consumption by Country (Tons), 2021–2026
Table 36. North America Lake Pigment Consumption by Country (Tons), 2027–2032
Table 37. Europe Lake Pigment Consumption Growth Rate by Country: 2021 vs 2025 vs 2032 (Tons)
Table 38. Europe Lake Pigment Consumption by Country (Tons), 2021–2026
Table 39. Europe Lake Pigment Consumption by Country (Tons), 2027–2032
Table 40. Asia Pacific Lake Pigment Consumption Growth Rate by Region: 2021 vs 2025 vs 2032 (Tons)
Table 41. Asia Pacific Lake Pigment Consumption by Region (Tons), 2021–2026
Table 42. Asia Pacific Lake Pigment Consumption by Region (Tons), 2027–2032
Table 43. Latin America, Middle East & Africa Lake Pigment Consumption Growth Rate by Country: 2021 vs 2025 vs 2032 (Tons)
Table 44. Latin America, Middle East & Africa Lake Pigment Consumption by Country (Tons), 2021–2026
Table 45. Latin America, Middle East & Africa Lake Pigment Consumption by Country (Tons), 2027–2032
Table 46. Global Lake Pigment Production (Tons) by Type (2021–2026)
Table 47. Global Lake Pigment Production (Tons) by Type (2027–2032)
Table 48. Global Lake Pigment Production Market Share by Type (2021–2026)
Table 49. Global Lake Pigment Production Market Share by Type (2027–2032)
Table 50. Global Lake Pigment Production Value (US$ Million) by Type (2021–2026)
Table 51. Global Lake Pigment Production Value (US$ Million) by Type (2027–2032)
Table 52. Global Lake Pigment Production Value Market Share by Type (2021–2026)
Table 53. Global Lake Pigment Production Value Market Share by Type (2027–2032)
Table 54. Global Lake Pigment Price (US$/Ton) by Type (2021–2026)
Table 55. Global Lake Pigment Price (US$/Ton) by Type (2027–2032)
Table 56. Global Lake Pigment Production (Tons) by Application (2021–2026)
Table 57. Global Lake Pigment Production (Tons) by Application (2027–2032)
Table 58. Global Lake Pigment Production Market Share by Application (2021–2026)
Table 59. Global Lake Pigment Production Market Share by Application (2027–2032)
Table 60. Global Lake Pigment Production Value (US$ Million) by Application (2021–2026)
Table 61. Global Lake Pigment Production Value (US$ Million) by Application (2027–2032)
Table 62. Global Lake Pigment Production Value Market Share by Application (2021–2026)
Table 63. Global Lake Pigment Production Value Market Share by Application (2027–2032)
Table 64. Global Lake Pigment Price (US$/Ton) by Application (2021–2026)
Table 65. Global Lake Pigment Price (US$/Ton) by Application (2027–2032)
Table 66. BASF Lake Pigment Company Information
Table 67. BASF Lake Pigment Specification and Application
Table 68. BASF Lake Pigment Production (Tons), Value (US$ Million), Price (US$/Ton) and Gross Margin (2021–2026)
Table 69. BASF Main Business and Markets Served
Table 70. BASF Recent Developments/Updates
Table 71. Clariant Lake Pigment Company Information
Table 72. Clariant Lake Pigment Specification and Application
Table 73. Clariant Lake Pigment Production (Tons), Value (US$ Million), Price (US$/Ton) and Gross Margin (2021–2026)
Table 74. Clariant Main Business and Markets Served
Table 75. Clariant Recent Developments/Updates
Table 76. DIC Lake Pigment Company Information
Table 77. DIC Lake Pigment Specification and Application
Table 78. DIC Lake Pigment Production (Tons), Value (US$ Million), Price (US$/Ton) and Gross Margin (2021–2026)
Table 79. DIC Main Business and Markets Served
Table 80. DIC Recent Developments/Updates
Table 81. Dainichiseika Color & Chemicals Lake Pigment Company Information
Table 82. Dainichiseika Color & Chemicals Lake Pigment Specification and Application
Table 83. Dainichiseika Color & Chemicals Lake Pigment Production (Tons), Value (US$ Million), Price (US$/Ton) and Gross Margin (2021–2026)
Table 84. Dainichiseika Color & Chemicals Main Business and Markets Served
Table 85. Dainichiseika Color & Chemicals Recent Developments/Updates
Table 86. Heubach Lake Pigment Company Information
Table 87. Heubach Lake Pigment Specification and Application
Table 88. Heubach Lake Pigment Production (Tons), Value (US$ Million), Price (US$/Ton) and Gross Margin (2021–2026)
Table 89. Heubach Main Business and Markets Served
Table 90. Heubach Recent Developments/Updates
Table 91. Sensient Technologies Lake Pigment Company Information
Table 92. Sensient Technologies Lake Pigment Specification and Application
Table 93. Sensient Technologies Lake Pigment Production (Tons), Value (US$ Million), Price (US$/Ton) and Gross Margin (2021–2026)
Table 94. Sensient Technologies Main Business and Markets Served
Table 95. Sensient Technologies Recent Developments/Updates
Table 96. Proquimac Color Lake Pigment Company Information
Table 97. Proquimac Color Lake Pigment Specification and Application
Table 98. Proquimac Color Lake Pigment Production (Tons), Value (US$ Million), Price (US$/Ton) and Gross Margin (2021–2026)
Table 99. Proquimac Color Main Business and Markets Served
Table 100. Proquimac Color Recent Developments/Updates
Table 101. Neelikon Lake Pigment Company Information
Table 102. Neelikon Lake Pigment Specification and Application
Table 103. Neelikon Lake Pigment Production (Tons), Value (US$ Million), Price (US$/Ton) and Gross Margin (2021–2026)
Table 104. Neelikon Main Business and Markets Served
Table 105. Neelikon Recent Developments/Updates
Table 106. Pylam Products Lake Pigment Company Information
Table 107. Pylam Products Lake Pigment Specification and Application
Table 108. Pylam Products Lake Pigment Production (Tons), Value (US$ Million), Price (US$/Ton) and Gross Margin (2021–2026)
Table 109. Pylam Products Main Business and Markets Served
Table 110. Pylam Products Recent Developments/Updates
Table 111. DyStar Lake Pigment Company Information
Table 112. DyStar Lake Pigment Specification and Application
Table 113. DyStar Lake Pigment Production (Tons), Value (US$ Million), Price (US$/Ton) and Gross Margin (2021–2026)
Table 114. DyStar Main Business and Markets Served
Table 115. DyStar Recent Developments/Updates
Table 116. Sudarshan Chemical Lake Pigment Company Information
Table 117. Sudarshan Chemical Lake Pigment Specification and Application
Table 118. Sudarshan Chemical Lake Pigment Production (Tons), Value (US$ Million), Price (US$/Ton) and Gross Margin (2021–2026)
Table 119. Sudarshan Chemical Main Business and Markets Served
Table 120. Sudarshan Chemical Recent Developments/Updates
Table 121. Trust Chem Lake Pigment Company Information
Table 122. Trust Chem Lake Pigment Specification and Application
Table 123. Trust Chem Lake Pigment Production (Tons), Value (US$ Million), Price (US$/Ton) and Gross Margin (2021–2026)
Table 124. Trust Chem Main Business and Markets Served
Table 125. Trust Chem Recent Developments/Updates
Table 126. Shanghai Dyestuffs Research Institute Lake Pigment Company Information
Table 127. Shanghai Dyestuffs Research Institute Lake Pigment Specification and Application
Table 128. Shanghai Dyestuffs Research Institute Lake Pigment Production (Tons), Value (US$ Million), Price (US$/Ton) and Gross Margin (2021–2026)
Table 129. Shanghai Dyestuffs Research Institute Main Business and Markets Served
Table 130. Shanghai Dyestuffs Research Institute Recent Developments/Updates
Table 131. Wujiang Shanhu Pigment Lake Pigment Company Information
Table 132. Wujiang Shanhu Pigment Lake Pigment Specification and Application
Table 133. Wujiang Shanhu Pigment Lake Pigment Production (Tons), Value (US$ Million), Price (US$/Ton) and Gross Margin (2021–2026)
Table 134. Wujiang Shanhu Pigment Main Business and Markets Served
Table 135. Wujiang Shanhu Pigment Recent Developments/Updates
Table 136. Hangzhou Hongyan Pigment Chemical Lake Pigment Company Information
Table 137. Hangzhou Hongyan Pigment Chemical Lake Pigment Specification and Application
Table 138. Hangzhou Hongyan Pigment Chemical Lake Pigment Production (Tons), Value (US$ Million), Price (US$/Ton) and Gross Margin (2021–2026)
Table 139. Hangzhou Hongyan Pigment Chemical Main Business and Markets Served
Table 140. Hangzhou Hongyan Pigment Chemical Recent Developments/Updates
Table 141. Wuxi Xinguang Chemical Industry Lake Pigment Company Information
Table 142. Wuxi Xinguang Chemical Industry Lake Pigment Specification and Application
Table 143. Wuxi Xinguang Chemical Industry Lake Pigment Production (Tons), Value (US$ Million), Price (US$/Ton) and Gross Margin (2021–2026)
Table 144. Wuxi Xinguang Chemical Industry Main Business and Markets Served
Table 145. Wuxi Xinguang Chemical Industry Recent Developments/Updates
Table 146. Zhejiang Xinshao Lake Pigment Company Information
Table 147. Zhejiang Xinshao Lake Pigment Specification and Application
Table 148. Zhejiang Xinshao Lake Pigment Production (Tons), Value (US$ Million), Price (US$/Ton) and Gross Margin (2021–2026)
Table 149. Zhejiang Xinshao Main Business and Markets Served
Table 150. Zhejiang Xinshao Recent Developments/Updates
Table 151. Vipul Organics Lake Pigment Company Information
Table 152. Vipul Organics Lake Pigment Specification and Application
Table 153. Vipul Organics Lake Pigment Production (Tons), Value (US$ Million), Price (US$/Ton) and Gross Margin (2021–2026)
Table 154. Vipul Organics Main Business and Markets Served
Table 155. Vipul Organics Recent Developments/Updates
Table 156. Ajanta Food Colours Lake Pigment Company Information
Table 157. Ajanta Food Colours Lake Pigment Specification and Application
Table 158. Ajanta Food Colours Lake Pigment Production (Tons), Value (US$ Million), Price (US$/Ton) and Gross Margin (2021–2026)
Table 159. Ajanta Food Colours Main Business and Markets Served
Table 160. Ajanta Food Colours Recent Developments/Updates
Table 161. Matrix Pharma Chem Lake Pigment Company Information
Table 162. Matrix Pharma Chem Lake Pigment Specification and Application
Table 163. Matrix Pharma Chem Lake Pigment Production (Tons), Value (US$ Million), Price (US$/Ton) and Gross Margin (2021–2026)
Table 164. Matrix Pharma Chem Main Business and Markets Served
Table 165. Matrix Pharma Chem Recent Developments/Updates
Table 166. Alliance Organics Lake Pigment Company Information
Table 167. Alliance Organics Lake Pigment Specification and Application
Table 168. Alliance Organics Lake Pigment Production (Tons), Value (US$ Million), Price (US$/Ton) and Gross Margin (2021–2026)
Table 169. Alliance Organics Main Business and Markets Served
Table 170. Alliance Organics Recent Developments/Updates
Table 171. Dynemic Products Lake Pigment Company Information
Table 172. Dynemic Products Lake Pigment Specification and Application
Table 173. Dynemic Products Lake Pigment Production (Tons), Value (US$ Million), Price (US$/Ton) and Gross Margin (2021–2026)
Table 174. Dynemic Products Main Business and Markets Served
Table 175. Dynemic Products Recent Developments/Updates
Table 176. Jiangsu Wucai Fine Chemical Lake Pigment Company Information
Table 177. Jiangsu Wucai Fine Chemical Lake Pigment Specification and Application
Table 178. Jiangsu Wucai Fine Chemical Lake Pigment Production (Tons), Value (US$ Million), Price (US$/Ton) and Gross Margin (2021–2026)
Table 179. Jiangsu Wucai Fine Chemical Main Business and Markets Served
Table 180. Jiangsu Wucai Fine Chemical Recent Developments/Updates
Table 181. Longkou Union Chemical Lake Pigment Company Information
Table 182. Longkou Union Chemical Lake Pigment Specification and Application
Table 183. Longkou Union Chemical Lake Pigment Production (Tons), Value (US$ Million), Price (US$/Ton) and Gross Margin (2021–2026)
Table 184. Longkou Union Chemical Main Business and Markets Served
Table 185. Longkou Union Chemical Recent Developments/Updates
Table 186. Windstar Chemical Lake Pigment Company Information
Table 187. Windstar Chemical Lake Pigment Specification and Application
Table 188. Windstar Chemical Lake Pigment Production (Tons), Value (US$ Million), Price (US$/Ton) and Gross Margin (2021–2026)
Table 189. Windstar Chemical Main Business and Markets Served
Table 190. Windstar Chemical Recent Developments/Updates
Table 191. Gansu Xiangda New Pigment Technology Lake Pigment Company Information
Table 192. Gansu Xiangda New Pigment Technology Lake Pigment Specification and Application
Table 193. Gansu Xiangda New Pigment Technology Lake Pigment Production (Tons), Value (US$ Million), Price (US$/Ton) and Gross Margin (2021–2026)
Table 194. Gansu Xiangda New Pigment Technology Main Business and Markets Served
Table 195. Gansu Xiangda New Pigment Technology Recent Developments/Updates
Table 196. Wanlong Chemical Lake Pigment Company Information
Table 197. Wanlong Chemical Lake Pigment Specification and Application
Table 198. Wanlong Chemical Lake Pigment Production (Tons), Value (US$ Million), Price (US$/Ton) and Gross Margin (2021–2026)
Table 199. Wanlong Chemical Main Business and Markets Served
Table 200. Wanlong Chemical Recent Developments/Updates
Table 201. Hangzhou Jiekai Chemical Lake Pigment Company Information
Table 202. Hangzhou Jiekai Chemical Lake Pigment Specification and Application
Table 203. Hangzhou Jiekai Chemical Lake Pigment Production (Tons), Value (US$ Million), Price (US$/Ton) and Gross Margin (2021–2026)
Table 204. Hangzhou Jiekai Chemical Main Business and Markets Served
Table 205. Hangzhou Jiekai Chemical Recent Developments/Updates
Table 206. Hangzhou Dingcai Technology Lake Pigment Company Information
Table 207. Hangzhou Dingcai Technology Lake Pigment Specification and Application
Table 208. Hangzhou Dingcai Technology Lake Pigment Production (Tons), Value (US$ Million), Price (US$/Ton) and Gross Margin (2021–2026)
Table 209. Hangzhou Dingcai Technology Main Business and Markets Served
Table 210. Hangzhou Dingcai Technology Recent Developments/Updates
Table 211. Key Raw Materials Lists
Table 212. Raw Materials Key Suppliers Lists
Table 213. Lake Pigment Distributors List
Table 214. Lake Pigment Customers List
Table 215. Lake Pigment Market Trends
Table 216. Lake Pigment Market Drivers
Table 217. Lake Pigment Market Challenges
Table 218. Lake Pigment Market Restraints
Table 219. Research Programs/Design for This Report
Table 220. Key Data Information from Secondary Sources
Table 221. Key Data Information from Primary Sources
Table 222. Authors List of This Report
List of Figures
Figure 1. Product Picture of Lake Pigment
Figure 2. Global Lake Pigment Market Value by Type (US$ Million), 2021–2032
Figure 3. Global Lake Pigment Market Share by Type: 2025 vs 2032
Figure 4. Aluminum Lake Product Picture
Figure 5. Barium Lake Product Picture
Figure 6. Calcium Lake Product Picture
Figure 7. Global Lake Pigment Market Value by Application Grade (US$ Million), 2021–2032
Figure 8. Global Lake Pigment Market Share by Application Grade: 2025 vs 2032
Figure 9. Food, Drug & Cosmetic Grade (FD&C)(High purity, FDA/EU/GB compliant, heavy metals <10 ppm, no PCBs) Product Picture
Figure 10. Printing Ink & Paint Grade(Good dispersibility, heat resistance >200°C, migration resistance ≥Grade 4) Product Picture
Figure 11. Plastics & Rubber Grade(Heat resistance >250°C, lightfastness ≥6, no migration) Product Picture
Figure 12. Industrial & Low‑End Grade(Low cost, wide particle size, no certification) Product Picture
Figure 13. Global Lake Pigment Market Value by Application (US$ Million), 2021–2032
Figure 14. Global Lake Pigment Market Share by Application: 2025 vs 2032
Figure 15. Food & Beverage
Figure 16. Pharmaceuticals
Figure 17. Cosmetics & Personal Care
Figure 18. Printing Inks
Figure 19. Paints & Coatings
Figure 20. Plastics & Rubber
Figure 21. Others
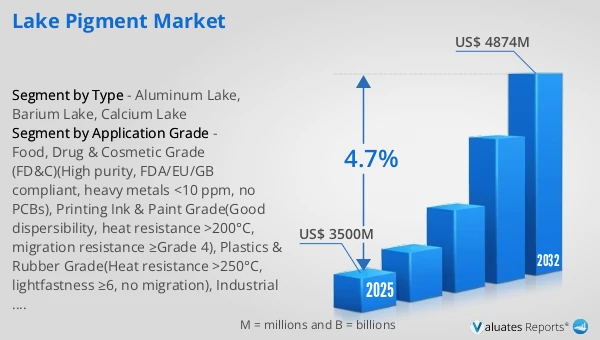
Figure 22. Global Lake Pigment Production Value (US$ Million), 2021 vs 2025 vs 2032
Figure 23. Global Lake Pigment Production Value (US$ Million), 2021–2032
Figure 24. Global Lake Pigment Production Capacity (Tons), 2021–2032
Figure 25. Global Lake Pigment Production (Tons), 2021–2032
Figure 26. Global Lake Pigment Average Price (US$/Ton), 2021–2032
Figure 27. Lake Pigment Report Years Considered
Figure 28. Lake Pigment Production Share by Manufacturers in 2025
Figure 29. Global Lake Pigment Production Value Share by Manufacturers (2025)
Figure 30. Lake Pigment Market Share by Company Type (Tier 1, Tier 2, and Tier 3): 2021 vs 2025
Figure 31. Top 5 and Top 10 Global Players: Market Share by Lake Pigment Revenue in 2025
Figure 32. Global Lake Pigment Production Value by Region: 2021 vs 2025 vs 2032 (US$ Million)
Figure 33. Global Lake Pigment Production Value Market Share by Region: 2021 vs 2025 vs 2032
Figure 34. Global Lake Pigment Production Comparison by Region: 2021 vs 2025 vs 2032 (Tons)
Figure 35. Global Lake Pigment Production Market Share by Region: 2021 vs 2025 vs 2032
Figure 36. North America Lake Pigment Production Value (US$ Million) Growth Rate (2021–2032)
Figure 37. Europe Lake Pigment Production Value (US$ Million) Growth Rate (2021–2032)
Figure 38. China Lake Pigment Production Value (US$ Million) Growth Rate (2021–2032)
Figure 39. Japan Lake Pigment Production Value (US$ Million) Growth Rate (2021–2032)
Figure 40. India Lake Pigment Production Value (US$ Million) Growth Rate (2021–2032)
Figure 41. Southeast Asia Lake Pigment Production Value (US$ Million) Growth Rate (2021–2032)
Figure 42. Global Lake Pigment Consumption by Region: 2021 vs 2025 vs 2032 (Tons)
Figure 43. Global Lake Pigment Consumption Market Share by Region: 2021 vs 2025 vs 2032
Figure 44. North America Lake Pigment Consumption and Growth Rate (Tons), 2021–2032
Figure 45. North America Lake Pigment Consumption Market Share by Country (2021–2032)
Figure 46. U.S. Lake Pigment Consumption and Growth Rate (Tons), 2021–2032
Figure 47. Canada Lake Pigment Consumption and Growth Rate (Tons), 2021–2032
Figure 48. Europe Lake Pigment Consumption and Growth Rate (Tons), 2021–2032
Figure 49. Europe Lake Pigment Consumption Market Share by Country (2021–2032)
Figure 50. Germany Lake Pigment Consumption and Growth Rate (Tons), 2021–2032
Figure 51. France Lake Pigment Consumption and Growth Rate (Tons), 2021–2032
Figure 52. U.K. Lake Pigment Consumption and Growth Rate (Tons), 2021–2032
Figure 53. Italy Lake Pigment Consumption and Growth Rate (Tons), 2021–2032
Figure 54. Russia Lake Pigment Consumption and Growth Rate (Tons), 2021–2032
Figure 55. Asia Pacific Lake Pigment Consumption and Growth Rate (Tons), 2021–2032
Figure 56. Asia Pacific Lake Pigment Consumption Market Share by Region (2021–2032)
Figure 57. China Lake Pigment Consumption and Growth Rate (Tons), 2021–2032
Figure 58. Japan Lake Pigment Consumption and Growth Rate (Tons), 2021–2032
Figure 59. South Korea Lake Pigment Consumption and Growth Rate (Tons), 2021–2032
Figure 60. China Taiwan Lake Pigment Consumption and Growth Rate (Tons), 2021–2032
Figure 61. Southeast Asia Lake Pigment Consumption and Growth Rate (Tons), 2021–2032
Figure 62. India Lake Pigment Consumption and Growth Rate (Tons), 2021–2032
Figure 63. Latin America, Middle East & Africa Lake Pigment Consumption and Growth Rate (Tons), 2021–2032
Figure 64. Latin America, Middle East & Africa Lake Pigment Consumption Market Share by Country (2021–2032)
Figure 65. Mexico Lake Pigment Consumption and Growth Rate (Tons), 2021–2032
Figure 66. Brazil Lake Pigment Consumption and Growth Rate (Tons), 2021–2032
Figure 67. Turkey Lake Pigment Consumption and Growth Rate (Tons), 2021–2032
Figure 68. GCC Countries Lake Pigment Consumption and Growth Rate (Tons), 2021–2032
Figure 69. Global Production Market Share of Lake Pigment by Type (2021–2032)
Figure 70. Global Production Value Market Share of Lake Pigment by Type (2021–2032)
Figure 71. Global Lake Pigment Price (US$/Ton) by Type (2021–2032)
Figure 72. Global Production Market Share of Lake Pigment by Application (2021–2032)
Figure 73. Global Production Value Market Share of Lake Pigment by Application (2021–2032)
Figure 74. Global Lake Pigment Price (US$/Ton) by Application (2021–2032)
Figure 75. Lake Pigment Value Chain
Figure 76. Channels of Distribution (Direct Vs Distribution)
Figure 77. Bottom-up and Top-down Approaches for This Report
Figure 78. Data Triangulation