0
U.S. (TOLL FREE)
+1 (315) 215-3225
Automative

0
U.S. (TOLL FREE)
+1 (315) 215-3225
Global Scientific Research Instruments Market Research Report 2025
Published Date: June 2025
|
Report Code: QYRE-Auto-7E5721
Home | Market Reports | Science
Global Scientific Research Instruments Market Insights Forecast to 2028
BUY CHAPTERS

Global Scientific Research Instruments Market Research Report 2025

Code: QYRE-Auto-7E5721
Report
June 2025
Pages:134
QYResearch
Buy Now with 15% Discount
DESCRIPTION
TABLE OF CONTENT
TABLES & FIGURES

Scientific Research Instruments Market Size

The global market for Scientific Research Instruments was valued at US$ 75700 million in the year 2024 and is projected to reach a revised size of US$ 100560 million by 2031, growing at a CAGR of 4.2% during the forecast period.

Scientific Research Instruments Market

Scientific Research Instruments Market

Scientific instruments are an important material basis for conducting scientific research, supporting knowledge innovation and technological innovation, and are an important manifestation of scientific and technological strength and competitiveness. Scientific instruments mainly include analytical instruments, physical performance testing instruments, metrological instruments, electronic measuring instruments, oceanographic instruments, earth exploration instruments, atmospheric exploration instruments, astronomical instruments, medical diagnostic instruments, process experimental equipment, computers and their supporting equipment, lasers and other instruments.
Market situation
There are various types of scientific research instruments. From the perspective of the overall market share, they are mainly occupied by several leading international companies, such as Thermo Fisher, Danaher, Zeiss, HORIBA, Agilent, Hitachi, Bruker, etc. The core companies are mainly distributed in the United States, Europe and Japan. The degree of advancement of scientific research instruments is a key indicator to measure the national scientific research strength and industrial development level. The R&D and manufacturing capabilities of high-end scientific instruments demonstrate a country's scientific and technological heritage, and their widespread use has greatly promoted the technological innovation and development of various industries.
Development trend
With the continuous advancement of science and technology, scientific instruments are rapidly developing in the direction of high precision and intelligence. By introducing advanced sensors and data processing technologies, the measurement accuracy and stability of these instruments have been significantly improved. For example, highly sensitive sensors can capture tiny changes, while powerful data processing algorithms can effectively reduce noise interference and ensure the accuracy and reliability of measurement results. At the same time, modern scientific instruments usually have multiple functions, and these functional modules are integrated together through integrated design, which greatly improves the user experience. Multifunctional integration not only simplifies the operation process, but also enables the instrument to adapt to more diverse application scenarios. For example, a comprehensive analyzer can simultaneously perform chemical composition analysis, physical property testing, and biological sample testing, greatly improving the work efficiency of the laboratory. In addition, with the rapid development of the Internet of Things and automation technology, scientific instruments are gradually realizing remote control and automated operation. This not only greatly improves the efficiency of the experiment, but also significantly reduces human errors. Researchers can remotely monitor and control instruments through the Internet, obtain experimental data in real time, and adjust experimental parameters in time. Automated operation can achieve a continuous and stable experimental process to ensure the consistency and repeatability of experimental results. For example, automatic samplers and intelligent control systems can complete complex experimental tasks without human supervision, greatly saving manpower and time costs. In short, high-precision, multi-functional integration, remote control, and automated operation are the main trends in the development of modern scientific instruments. The advancement of these technologies not only improves the efficiency and accuracy of scientific research, but also brings more possibilities for scientific research.
This report aims to provide a comprehensive presentation of the global market for Scientific Research Instruments, with both quantitative and qualitative analysis, to help readers develop business/growth strategies, assess the market competitive situation, analyze their position in the current marketplace, and make informed business decisions regarding Scientific Research Instruments.
The Scientific Research Instruments market size, estimations, and forecasts are provided in terms of and revenue ($ millions), considering 2024 as the base year, with history and forecast data for the period from 2020 to 2031. This report segments the global Scientific Research Instruments market comprehensively. Regional market sizes, concerning products by Type, by Application, and by players, are also provided.
For a more in-depth understanding of the market, the report provides profiles of the competitive landscape, key competitors, and their respective market ranks. The report also discusses technological trends and new product developments.
The report will help the Scientific Research Instruments companies, new entrants, and industry chain related companies in this market with information on the revenues for the overall market and the sub-segments across the different segments, by company, by Type, by Application, and by regions.
Market Segmentation

Scope of Scientific Research Instruments Market Report

Report Metric Details
Report Name Scientific Research Instruments Market
Accounted market size in year US$ 75700 million
Forecasted market size in 2031 US$ 100560 million
CAGR 4.2%
Base Year year
Forecasted years 2025 - 2031
Segment by Type
Segment by Application
  • Biomedicine
  • Food
  • Agriculture and Forestry
  • Environmental Testing
  • Chemical
  • Scientific Research
  • Others
By Region
  • North America (United States, Canada)
  • Europe (Germany, France, UK, Italy, Russia) Rest of Europe
  • Nordic Countries
  • Asia-Pacific (China, Japan, South Korea)
  • Southeast Asia (India, Australia)
  • Rest of Asia
  • Latin America (Mexico, Brazil)
  • Rest of Latin America
  • Middle East & Africa (Turkey, Saudi Arabia, UAE, Rest of MEA)
By Company Thermo Fisher Scientific, Roche, Agilent Technologies, Danaher Corporation, SHIMADZU, Techcomp, HORIBA Scientific, PerkinElmer, Hitachi, Zeiss, Ametek, JEOL, LECO, Bruker, Yokogawa Electric, VIAVI Solutions, Coherent, Anritsu, EXFO, Thorlabs, Optoplex, Anyeep, Focused Photonics, Tianjin Honour Instrument, Hanon Advanced Technology Group, Ningbo Scientz Biotechnology, INFICON, Waters, Ceyear Technologies, VeEX, Olympus (Evident), Nikon, Leica, Celestron, Ningbo Yongxin Optics, Sunny Optical Technology, Guilin Guiguang Instrument, CHONGQING OPTEC INSTRUMENT, Motic
Forecast units USD million in value
Report coverage Revenue and volume forecast, company share, competitive landscape, growth factors and trends

Chapter Outline

  • Chapter 1: Introduces the report scope of the report, executive summary of different market segments (by Type, by Application, etc), including the market size of each market segment, future development potential, and so on. It offers a high-level view of the current state of the market and its likely evolution in the short to mid-term, and long term.
  • Chapter 2: Introduces executive summary of global market size, regional market size, this section also introduces the market dynamics, latest developments of the market, the driving factors and restrictive factors of the market, the challenges and risks faced by companies in the industry, and the analysis of relevant policies in the industry.
  • Chapter 3: Detailed analysis of Scientific Research Instruments company competitive landscape, revenue market share, latest development plan, merger, and acquisition information, etc.
  • Chapter 4: Provides the analysis of various market segments by Type, covering the market size and development potential of each market segment, to help readers find the blue ocean market in different market segments.
  • Chapter 5: Provides the analysis of various market segments by Application, covering the market size and development potential of each market segment, to help readers find the blue ocean market in different downstream markets.
  • Chapter 6, 7, 8, 9, 10: North America, Europe, Asia Pacific, Latin America, Middle East and Africa segment by country. It provides a quantitative analysis of the market size and development potential of each region and its main countries and introduces the market development, future development prospects, market space, and capacity of each country in the world.
  • Chapter 11: Provides profiles of key players, introducing the basic situation of the main companies in the market in detail, including product sales, revenue, price, gross margin, product introduction, recent development, etc.
  • Chapter 12: The main points and conclusions of the report.

FAQ for this report

How fast is Scientific Research Instruments Market growing?

Ans: The Scientific Research Instruments Market witnessing a CAGR of 4.2% during the forecast period 2025-2031.

What is the Scientific Research Instruments Market size in 2031?

Ans: The Scientific Research Instruments Market size in 2031 will be US$ 100560 million.

Who are the main players in the Scientific Research Instruments Market report?

Ans: The main players in the Scientific Research Instruments Market are Thermo Fisher Scientific, Roche, Agilent Technologies, Danaher Corporation, SHIMADZU, Techcomp, HORIBA Scientific, PerkinElmer, Hitachi, Zeiss, Ametek, JEOL, LECO, Bruker, Yokogawa Electric, VIAVI Solutions, Coherent, Anritsu, EXFO, Thorlabs, Optoplex, Anyeep, Focused Photonics, Tianjin Honour Instrument, Hanon Advanced Technology Group, Ningbo Scientz Biotechnology, INFICON, Waters, Ceyear Technologies, VeEX, Olympus (Evident), Nikon, Leica, Celestron, Ningbo Yongxin Optics, Sunny Optical Technology, Guilin Guiguang Instrument, CHONGQING OPTEC INSTRUMENT, Motic

What are the Application segmentation covered in the Scientific Research Instruments Market report?

Ans: The Applications covered in the Scientific Research Instruments Market report are Biomedicine, Food, Agriculture and Forestry, Environmental Testing, Chemical, Scientific Research, Others

What are the Type segmentation covered in the Scientific Research Instruments Market report?

Ans: The Types covered in the Scientific Research Instruments Market report are Biochemical Separation and Analysis Instruments, Mass Spectrometers, Spectrometers, Chromatographic Instruments, Microscopes and Image Analysis Instruments, Electronic Optical Instruments, X-ray Instruments, Others

Recommended Reports

Analytical Instruments

Measurement Instruments

Scientific Lab Equipment

1 Report Overview
1.1 Study Scope
1.2 Market Analysis by Type
1.2.1 Global Scientific Research Instruments Market Size Growth Rate by Type: 2020 VS 2024 VS 2031
1.2.2 Biochemical Separation and Analysis Instruments
1.2.3 Mass Spectrometers
1.2.4 Spectrometers
1.2.5 Chromatographic Instruments
1.2.6 Microscopes and Image Analysis Instruments
1.2.7 Electronic Optical Instruments
1.2.8 X-ray Instruments
1.2.9 Others
1.3 Market by Application
1.3.1 Global Scientific Research Instruments Market Growth by Application: 2020 VS 2024 VS 2031
1.3.2 Biomedicine
1.3.3 Food
1.3.4 Agriculture and Forestry
1.3.5 Environmental Testing
1.3.6 Chemical
1.3.7 Scientific Research
1.3.8 Others
1.4 Assumptions and Limitations
1.5 Study Objectives
1.6 Years Considered
2 Global Growth Trends
2.1 Global Scientific Research Instruments Market Perspective (2020-2031)
2.2 Global Scientific Research Instruments Growth Trends by Region
2.2.1 Global Scientific Research Instruments Market Size by Region: 2020 VS 2024 VS 2031
2.2.2 Scientific Research Instruments Historic Market Size by Region (2020-2025)
2.2.3 Scientific Research Instruments Forecasted Market Size by Region (2026-2031)
2.3 Scientific Research Instruments Market Dynamics
2.3.1 Scientific Research Instruments Industry Trends
2.3.2 Scientific Research Instruments Market Drivers
2.3.3 Scientific Research Instruments Market Challenges
2.3.4 Scientific Research Instruments Market Restraints
3 Competition Landscape by Key Players
3.1 Global Top Scientific Research Instruments Players by Revenue
3.1.1 Global Top Scientific Research Instruments Players by Revenue (2020-2025)
3.1.2 Global Scientific Research Instruments Revenue Market Share by Players (2020-2025)
3.2 Global Scientific Research Instruments Market Share by Company Type (Tier 1, Tier 2, and Tier 3)
3.3 Global Key Players Ranking by Scientific Research Instruments Revenue
3.4 Global Scientific Research Instruments Market Concentration Ratio
3.4.1 Global Scientific Research Instruments Market Concentration Ratio (CR5 and HHI)
3.4.2 Global Top 10 and Top 5 Companies by Scientific Research Instruments Revenue in 2024
3.5 Global Key Players of Scientific Research Instruments Head office and Area Served
3.6 Global Key Players of Scientific Research Instruments, Product and Application
3.7 Global Key Players of Scientific Research Instruments, Date of Enter into This Industry
3.8 Mergers & Acquisitions, Expansion Plans
4 Scientific Research Instruments Breakdown Data by Type
4.1 Global Scientific Research Instruments Historic Market Size by Type (2020-2025)
4.2 Global Scientific Research Instruments Forecasted Market Size by Type (2026-2031)
5 Scientific Research Instruments Breakdown Data by Application
5.1 Global Scientific Research Instruments Historic Market Size by Application (2020-2025)
5.2 Global Scientific Research Instruments Forecasted Market Size by Application (2026-2031)
6 North America
6.1 North America Scientific Research Instruments Market Size (2020-2031)
6.2 North America Scientific Research Instruments Market Growth Rate by Country: 2020 VS 2024 VS 2031
6.3 North America Scientific Research Instruments Market Size by Country (2020-2025)
6.4 North America Scientific Research Instruments Market Size by Country (2026-2031)
6.5 United States
6.6 Canada
7 Europe
7.1 Europe Scientific Research Instruments Market Size (2020-2031)
7.2 Europe Scientific Research Instruments Market Growth Rate by Country: 2020 VS 2024 VS 2031
7.3 Europe Scientific Research Instruments Market Size by Country (2020-2025)
7.4 Europe Scientific Research Instruments Market Size by Country (2026-2031)
7.5 Germany
7.6 France
7.7 U.K.
7.8 Italy
7.9 Russia
7.10 Nordic Countries
8 Asia-Pacific
8.1 Asia-Pacific Scientific Research Instruments Market Size (2020-2031)
8.2 Asia-Pacific Scientific Research Instruments Market Growth Rate by Region: 2020 VS 2024 VS 2031
8.3 Asia-Pacific Scientific Research Instruments Market Size by Region (2020-2025)
8.4 Asia-Pacific Scientific Research Instruments Market Size by Region (2026-2031)
8.5 China
8.6 Japan
8.7 South Korea
8.8 Southeast Asia
8.9 India
8.10 Australia
9 Latin America
9.1 Latin America Scientific Research Instruments Market Size (2020-2031)
9.2 Latin America Scientific Research Instruments Market Growth Rate by Country: 2020 VS 2024 VS 2031
9.3 Latin America Scientific Research Instruments Market Size by Country (2020-2025)
9.4 Latin America Scientific Research Instruments Market Size by Country (2026-2031)
9.5 Mexico
9.6 Brazil
10 Middle East & Africa
10.1 Middle East & Africa Scientific Research Instruments Market Size (2020-2031)
10.2 Middle East & Africa Scientific Research Instruments Market Growth Rate by Country: 2020 VS 2024 VS 2031
10.3 Middle East & Africa Scientific Research Instruments Market Size by Country (2020-2025)
10.4 Middle East & Africa Scientific Research Instruments Market Size by Country (2026-2031)
10.5 Turkey
10.6 Saudi Arabia
10.7 UAE
11 Key Players Profiles
11.1 Thermo Fisher Scientific
11.1.1 Thermo Fisher Scientific Company Details
11.1.2 Thermo Fisher Scientific Business Overview
11.1.3 Thermo Fisher Scientific Scientific Research Instruments Introduction
11.1.4 Thermo Fisher Scientific Revenue in Scientific Research Instruments Business (2020-2025)
11.1.5 Thermo Fisher Scientific Recent Development
11.2 Roche
11.2.1 Roche Company Details
11.2.2 Roche Business Overview
11.2.3 Roche Scientific Research Instruments Introduction
11.2.4 Roche Revenue in Scientific Research Instruments Business (2020-2025)
11.2.5 Roche Recent Development
11.3 Agilent Technologies
11.3.1 Agilent Technologies Company Details
11.3.2 Agilent Technologies Business Overview
11.3.3 Agilent Technologies Scientific Research Instruments Introduction
11.3.4 Agilent Technologies Revenue in Scientific Research Instruments Business (2020-2025)
11.3.5 Agilent Technologies Recent Development
11.4 Danaher Corporation
11.4.1 Danaher Corporation Company Details
11.4.2 Danaher Corporation Business Overview
11.4.3 Danaher Corporation Scientific Research Instruments Introduction
11.4.4 Danaher Corporation Revenue in Scientific Research Instruments Business (2020-2025)
11.4.5 Danaher Corporation Recent Development
11.5 SHIMADZU
11.5.1 SHIMADZU Company Details
11.5.2 SHIMADZU Business Overview
11.5.3 SHIMADZU Scientific Research Instruments Introduction
11.5.4 SHIMADZU Revenue in Scientific Research Instruments Business (2020-2025)
11.5.5 SHIMADZU Recent Development
11.6 Techcomp
11.6.1 Techcomp Company Details
11.6.2 Techcomp Business Overview
11.6.3 Techcomp Scientific Research Instruments Introduction
11.6.4 Techcomp Revenue in Scientific Research Instruments Business (2020-2025)
11.6.5 Techcomp Recent Development
11.7 HORIBA Scientific
11.7.1 HORIBA Scientific Company Details
11.7.2 HORIBA Scientific Business Overview
11.7.3 HORIBA Scientific Scientific Research Instruments Introduction
11.7.4 HORIBA Scientific Revenue in Scientific Research Instruments Business (2020-2025)
11.7.5 HORIBA Scientific Recent Development
11.8 PerkinElmer
11.8.1 PerkinElmer Company Details
11.8.2 PerkinElmer Business Overview
11.8.3 PerkinElmer Scientific Research Instruments Introduction
11.8.4 PerkinElmer Revenue in Scientific Research Instruments Business (2020-2025)
11.8.5 PerkinElmer Recent Development
11.9 Hitachi
11.9.1 Hitachi Company Details
11.9.2 Hitachi Business Overview
11.9.3 Hitachi Scientific Research Instruments Introduction
11.9.4 Hitachi Revenue in Scientific Research Instruments Business (2020-2025)
11.9.5 Hitachi Recent Development
11.10 Zeiss
11.10.1 Zeiss Company Details
11.10.2 Zeiss Business Overview
11.10.3 Zeiss Scientific Research Instruments Introduction
11.10.4 Zeiss Revenue in Scientific Research Instruments Business (2020-2025)
11.10.5 Zeiss Recent Development
11.11 Ametek
11.11.1 Ametek Company Details
11.11.2 Ametek Business Overview
11.11.3 Ametek Scientific Research Instruments Introduction
11.11.4 Ametek Revenue in Scientific Research Instruments Business (2020-2025)
11.11.5 Ametek Recent Development
11.12 JEOL
11.12.1 JEOL Company Details
11.12.2 JEOL Business Overview
11.12.3 JEOL Scientific Research Instruments Introduction
11.12.4 JEOL Revenue in Scientific Research Instruments Business (2020-2025)
11.12.5 JEOL Recent Development
11.13 LECO
11.13.1 LECO Company Details
11.13.2 LECO Business Overview
11.13.3 LECO Scientific Research Instruments Introduction
11.13.4 LECO Revenue in Scientific Research Instruments Business (2020-2025)
11.13.5 LECO Recent Development
11.14 Bruker
11.14.1 Bruker Company Details
11.14.2 Bruker Business Overview
11.14.3 Bruker Scientific Research Instruments Introduction
11.14.4 Bruker Revenue in Scientific Research Instruments Business (2020-2025)
11.14.5 Bruker Recent Development
11.15 Yokogawa Electric
11.15.1 Yokogawa Electric Company Details
11.15.2 Yokogawa Electric Business Overview
11.15.3 Yokogawa Electric Scientific Research Instruments Introduction
11.15.4 Yokogawa Electric Revenue in Scientific Research Instruments Business (2020-2025)
11.15.5 Yokogawa Electric Recent Development
11.16 VIAVI Solutions
11.16.1 VIAVI Solutions Company Details
11.16.2 VIAVI Solutions Business Overview
11.16.3 VIAVI Solutions Scientific Research Instruments Introduction
11.16.4 VIAVI Solutions Revenue in Scientific Research Instruments Business (2020-2025)
11.16.5 VIAVI Solutions Recent Development
11.17 Coherent
11.17.1 Coherent Company Details
11.17.2 Coherent Business Overview
11.17.3 Coherent Scientific Research Instruments Introduction
11.17.4 Coherent Revenue in Scientific Research Instruments Business (2020-2025)
11.17.5 Coherent Recent Development
11.18 Anritsu
11.18.1 Anritsu Company Details
11.18.2 Anritsu Business Overview
11.18.3 Anritsu Scientific Research Instruments Introduction
11.18.4 Anritsu Revenue in Scientific Research Instruments Business (2020-2025)
11.18.5 Anritsu Recent Development
11.19 EXFO
11.19.1 EXFO Company Details
11.19.2 EXFO Business Overview
11.19.3 EXFO Scientific Research Instruments Introduction
11.19.4 EXFO Revenue in Scientific Research Instruments Business (2020-2025)
11.19.5 EXFO Recent Development
11.20 Thorlabs
11.20.1 Thorlabs Company Details
11.20.2 Thorlabs Business Overview
11.20.3 Thorlabs Scientific Research Instruments Introduction
11.20.4 Thorlabs Revenue in Scientific Research Instruments Business (2020-2025)
11.20.5 Thorlabs Recent Development
11.21 Optoplex
11.21.1 Optoplex Company Details
11.21.2 Optoplex Business Overview
11.21.3 Optoplex Scientific Research Instruments Introduction
11.21.4 Optoplex Revenue in Scientific Research Instruments Business (2020-2025)
11.21.5 Optoplex Recent Development
11.22 Anyeep
11.22.1 Anyeep Company Details
11.22.2 Anyeep Business Overview
11.22.3 Anyeep Scientific Research Instruments Introduction
11.22.4 Anyeep Revenue in Scientific Research Instruments Business (2020-2025)
11.22.5 Anyeep Recent Development
11.23 Focused Photonics
11.23.1 Focused Photonics Company Details
11.23.2 Focused Photonics Business Overview
11.23.3 Focused Photonics Scientific Research Instruments Introduction
11.23.4 Focused Photonics Revenue in Scientific Research Instruments Business (2020-2025)
11.23.5 Focused Photonics Recent Development
11.24 Tianjin Honour Instrument
11.24.1 Tianjin Honour Instrument Company Details
11.24.2 Tianjin Honour Instrument Business Overview
11.24.3 Tianjin Honour Instrument Scientific Research Instruments Introduction
11.24.4 Tianjin Honour Instrument Revenue in Scientific Research Instruments Business (2020-2025)
11.24.5 Tianjin Honour Instrument Recent Development
11.25 Hanon Advanced Technology Group
11.25.1 Hanon Advanced Technology Group Company Details
11.25.2 Hanon Advanced Technology Group Business Overview
11.25.3 Hanon Advanced Technology Group Scientific Research Instruments Introduction
11.25.4 Hanon Advanced Technology Group Revenue in Scientific Research Instruments Business (2020-2025)
11.25.5 Hanon Advanced Technology Group Recent Development
11.26 Ningbo Scientz Biotechnology
11.26.1 Ningbo Scientz Biotechnology Company Details
11.26.2 Ningbo Scientz Biotechnology Business Overview
11.26.3 Ningbo Scientz Biotechnology Scientific Research Instruments Introduction
11.26.4 Ningbo Scientz Biotechnology Revenue in Scientific Research Instruments Business (2020-2025)
11.26.5 Ningbo Scientz Biotechnology Recent Development
11.27 INFICON
11.27.1 INFICON Company Details
11.27.2 INFICON Business Overview
11.27.3 INFICON Scientific Research Instruments Introduction
11.27.4 INFICON Revenue in Scientific Research Instruments Business (2020-2025)
11.27.5 INFICON Recent Development
11.28 Waters
11.28.1 Waters Company Details
11.28.2 Waters Business Overview
11.28.3 Waters Scientific Research Instruments Introduction
11.28.4 Waters Revenue in Scientific Research Instruments Business (2020-2025)
11.28.5 Waters Recent Development
11.29 Ceyear Technologies
11.29.1 Ceyear Technologies Company Details
11.29.2 Ceyear Technologies Business Overview
11.29.3 Ceyear Technologies Scientific Research Instruments Introduction
11.29.4 Ceyear Technologies Revenue in Scientific Research Instruments Business (2020-2025)
11.29.5 Ceyear Technologies Recent Development
11.30 VeEX
11.30.1 VeEX Company Details
11.30.2 VeEX Business Overview
11.30.3 VeEX Scientific Research Instruments Introduction
11.30.4 VeEX Revenue in Scientific Research Instruments Business (2020-2025)
11.30.5 VeEX Recent Development
11.31 Olympus (Evident)
11.31.1 Olympus (Evident) Company Details
11.31.2 Olympus (Evident) Business Overview
11.31.3 Olympus (Evident) Scientific Research Instruments Introduction
11.31.4 Olympus (Evident) Revenue in Scientific Research Instruments Business (2020-2025)
11.31.5 Olympus (Evident) Recent Development
11.32 Nikon
11.32.1 Nikon Company Details
11.32.2 Nikon Business Overview
11.32.3 Nikon Scientific Research Instruments Introduction
11.32.4 Nikon Revenue in Scientific Research Instruments Business (2020-2025)
11.32.5 Nikon Recent Development
11.33 Leica
11.33.1 Leica Company Details
11.33.2 Leica Business Overview
11.33.3 Leica Scientific Research Instruments Introduction
11.33.4 Leica Revenue in Scientific Research Instruments Business (2020-2025)
11.33.5 Leica Recent Development
11.34 Celestron
11.34.1 Celestron Company Details
11.34.2 Celestron Business Overview
11.34.3 Celestron Scientific Research Instruments Introduction
11.34.4 Celestron Revenue in Scientific Research Instruments Business (2020-2025)
11.34.5 Celestron Recent Development
11.35 Ningbo Yongxin Optics
11.35.1 Ningbo Yongxin Optics Company Details
11.35.2 Ningbo Yongxin Optics Business Overview
11.35.3 Ningbo Yongxin Optics Scientific Research Instruments Introduction
11.35.4 Ningbo Yongxin Optics Revenue in Scientific Research Instruments Business (2020-2025)
11.35.5 Ningbo Yongxin Optics Recent Development
11.36 Sunny Optical Technology
11.36.1 Sunny Optical Technology Company Details
11.36.2 Sunny Optical Technology Business Overview
11.36.3 Sunny Optical Technology Scientific Research Instruments Introduction
11.36.4 Sunny Optical Technology Revenue in Scientific Research Instruments Business (2020-2025)
11.36.5 Sunny Optical Technology Recent Development
11.37 Guilin Guiguang Instrument
11.37.1 Guilin Guiguang Instrument Company Details
11.37.2 Guilin Guiguang Instrument Business Overview
11.37.3 Guilin Guiguang Instrument Scientific Research Instruments Introduction
11.37.4 Guilin Guiguang Instrument Revenue in Scientific Research Instruments Business (2020-2025)
11.37.5 Guilin Guiguang Instrument Recent Development
11.38 CHONGQING OPTEC INSTRUMENT
11.38.1 CHONGQING OPTEC INSTRUMENT Company Details
11.38.2 CHONGQING OPTEC INSTRUMENT Business Overview
11.38.3 CHONGQING OPTEC INSTRUMENT Scientific Research Instruments Introduction
11.38.4 CHONGQING OPTEC INSTRUMENT Revenue in Scientific Research Instruments Business (2020-2025)
11.38.5 CHONGQING OPTEC INSTRUMENT Recent Development
11.39 Motic
11.39.1 Motic Company Details
11.39.2 Motic Business Overview
11.39.3 Motic Scientific Research Instruments Introduction
11.39.4 Motic Revenue in Scientific Research Instruments Business (2020-2025)
11.39.5 Motic Recent Development
12 Analyst's Viewpoints/Conclusions
13 Appendix
13.1 Research Methodology
13.1.1 Methodology/Research Approach
13.1.1.1 Research Programs/Design
13.1.1.2 Market Size Estimation
13.1.1.3 Market Breakdown and Data Triangulation
13.1.2 Data Source
13.1.2.1 Secondary Sources
13.1.2.2 Primary Sources
13.2 Author Details
13.3 Disclaimer
List of Tables
 Table 1. Global Scientific Research Instruments Market Size Growth Rate by Type (US$ Million): 2020 VS 2024 VS 2031
 Table 2. Key Players of Biochemical Separation and Analysis Instruments
 Table 3. Key Players of Mass Spectrometers
 Table 4. Key Players of Spectrometers
 Table 5. Key Players of Chromatographic Instruments
 Table 6. Key Players of Microscopes and Image Analysis Instruments
 Table 7. Key Players of Electronic Optical Instruments
 Table 8. Key Players of X-ray Instruments
 Table 9. Global Scientific Research Instruments Market Size Growth by Application (US$ Million): 2020 VS 2024 VS 2031
 Table 10. Global Scientific Research Instruments Market Size by Region (US$ Million): 2020 VS 2024 VS 2031
 Table 11. Global Scientific Research Instruments Market Size by Region (2020-2025) & (US$ Million)
 Table 12. Global Scientific Research Instruments Market Share by Region (2020-2025)
 Table 13. Global Scientific Research Instruments Forecasted Market Size by Region (2026-2031) & (US$ Million)
 Table 14. Global Scientific Research Instruments Market Share by Region (2026-2031)
 Table 15. Scientific Research Instruments Market Trends
 Table 16. Scientific Research Instruments Market Drivers
 Table 17. Scientific Research Instruments Market Challenges
 Table 18. Scientific Research Instruments Market Restraints
 Table 19. Global Scientific Research Instruments Revenue by Players (2020-2025) & (US$ Million)
 Table 20. Global Scientific Research Instruments Market Share by Players (2020-2025)
 Table 21. Global Top Scientific Research Instruments Players by Company Type (Tier 1, Tier 2, and Tier 3) & (based on the Revenue in Scientific Research Instruments as of 2024)
 Table 22. Ranking of Global Top Scientific Research Instruments Companies by Revenue (US$ Million) in 2024
 Table 23. Global 5 Largest Players Market Share by Scientific Research Instruments Revenue (CR5 and HHI) & (2020-2025)
 Table 24. Global Key Players of Scientific Research Instruments, Headquarters and Area Served
 Table 25. Global Key Players of Scientific Research Instruments, Product and Application
 Table 26. Global Key Players of Scientific Research Instruments, Date of Enter into This Industry
 Table 27. Mergers & Acquisitions, Expansion Plans
 Table 28. Global Scientific Research Instruments Market Size by Type (2020-2025) & (US$ Million)
 Table 29. Global Scientific Research Instruments Revenue Market Share by Type (2020-2025)
 Table 30. Global Scientific Research Instruments Forecasted Market Size by Type (2026-2031) & (US$ Million)
 Table 31. Global Scientific Research Instruments Revenue Market Share by Type (2026-2031)
 Table 32. Global Scientific Research Instruments Market Size by Application (2020-2025) & (US$ Million)
 Table 33. Global Scientific Research Instruments Revenue Market Share by Application (2020-2025)
 Table 34. Global Scientific Research Instruments Forecasted Market Size by Application (2026-2031) & (US$ Million)
 Table 35. Global Scientific Research Instruments Revenue Market Share by Application (2026-2031)
 Table 36. North America Scientific Research Instruments Market Size Growth Rate by Country (US$ Million): 2020 VS 2024 VS 2031
 Table 37. North America Scientific Research Instruments Market Size by Country (2020-2025) & (US$ Million)
 Table 38. North America Scientific Research Instruments Market Size by Country (2026-2031) & (US$ Million)
 Table 39. Europe Scientific Research Instruments Market Size Growth Rate by Country (US$ Million): 2020 VS 2024 VS 2031
 Table 40. Europe Scientific Research Instruments Market Size by Country (2020-2025) & (US$ Million)
 Table 41. Europe Scientific Research Instruments Market Size by Country (2026-2031) & (US$ Million)
 Table 42. Asia-Pacific Scientific Research Instruments Market Size Growth Rate by Region (US$ Million): 2020 VS 2024 VS 2031
 Table 43. Asia-Pacific Scientific Research Instruments Market Size by Region (2020-2025) & (US$ Million)
 Table 44. Asia-Pacific Scientific Research Instruments Market Size by Region (2026-2031) & (US$ Million)
 Table 45. Latin America Scientific Research Instruments Market Size Growth Rate by Country (US$ Million): 2020 VS 2024 VS 2031
 Table 46. Latin America Scientific Research Instruments Market Size by Country (2020-2025) & (US$ Million)
 Table 47. Latin America Scientific Research Instruments Market Size by Country (2026-2031) & (US$ Million)
 Table 48. Middle East & Africa Scientific Research Instruments Market Size Growth Rate by Country (US$ Million): 2020 VS 2024 VS 2031
 Table 49. Middle East & Africa Scientific Research Instruments Market Size by Country (2020-2025) & (US$ Million)
 Table 50. Middle East & Africa Scientific Research Instruments Market Size by Country (2026-2031) & (US$ Million)
 Table 51. Thermo Fisher Scientific Company Details
 Table 52. Thermo Fisher Scientific Business Overview
 Table 53. Thermo Fisher Scientific Scientific Research Instruments Product
 Table 54. Thermo Fisher Scientific Revenue in Scientific Research Instruments Business (2020-2025) & (US$ Million)
 Table 55. Thermo Fisher Scientific Recent Development
 Table 56. Roche Company Details
 Table 57. Roche Business Overview
 Table 58. Roche Scientific Research Instruments Product
 Table 59. Roche Revenue in Scientific Research Instruments Business (2020-2025) & (US$ Million)
 Table 60. Roche Recent Development
 Table 61. Agilent Technologies Company Details
 Table 62. Agilent Technologies Business Overview
 Table 63. Agilent Technologies Scientific Research Instruments Product
 Table 64. Agilent Technologies Revenue in Scientific Research Instruments Business (2020-2025) & (US$ Million)
 Table 65. Agilent Technologies Recent Development
 Table 66. Danaher Corporation Company Details
 Table 67. Danaher Corporation Business Overview
 Table 68. Danaher Corporation Scientific Research Instruments Product
 Table 69. Danaher Corporation Revenue in Scientific Research Instruments Business (2020-2025) & (US$ Million)
 Table 70. Danaher Corporation Recent Development
 Table 71. SHIMADZU Company Details
 Table 72. SHIMADZU Business Overview
 Table 73. SHIMADZU Scientific Research Instruments Product
 Table 74. SHIMADZU Revenue in Scientific Research Instruments Business (2020-2025) & (US$ Million)
 Table 75. SHIMADZU Recent Development
 Table 76. Techcomp Company Details
 Table 77. Techcomp Business Overview
 Table 78. Techcomp Scientific Research Instruments Product
 Table 79. Techcomp Revenue in Scientific Research Instruments Business (2020-2025) & (US$ Million)
 Table 80. Techcomp Recent Development
 Table 81. HORIBA Scientific Company Details
 Table 82. HORIBA Scientific Business Overview
 Table 83. HORIBA Scientific Scientific Research Instruments Product
 Table 84. HORIBA Scientific Revenue in Scientific Research Instruments Business (2020-2025) & (US$ Million)
 Table 85. HORIBA Scientific Recent Development
 Table 86. PerkinElmer Company Details
 Table 87. PerkinElmer Business Overview
 Table 88. PerkinElmer Scientific Research Instruments Product
 Table 89. PerkinElmer Revenue in Scientific Research Instruments Business (2020-2025) & (US$ Million)
 Table 90. PerkinElmer Recent Development
 Table 91. Hitachi Company Details
 Table 92. Hitachi Business Overview
 Table 93. Hitachi Scientific Research Instruments Product
 Table 94. Hitachi Revenue in Scientific Research Instruments Business (2020-2025) & (US$ Million)
 Table 95. Hitachi Recent Development
 Table 96. Zeiss Company Details
 Table 97. Zeiss Business Overview
 Table 98. Zeiss Scientific Research Instruments Product
 Table 99. Zeiss Revenue in Scientific Research Instruments Business (2020-2025) & (US$ Million)
 Table 100. Zeiss Recent Development
 Table 101. Ametek Company Details
 Table 102. Ametek Business Overview
 Table 103. Ametek Scientific Research Instruments Product
 Table 104. Ametek Revenue in Scientific Research Instruments Business (2020-2025) & (US$ Million)
 Table 105. Ametek Recent Development
 Table 106. JEOL Company Details
 Table 107. JEOL Business Overview
 Table 108. JEOL Scientific Research Instruments Product
 Table 109. JEOL Revenue in Scientific Research Instruments Business (2020-2025) & (US$ Million)
 Table 110. JEOL Recent Development
 Table 111. LECO Company Details
 Table 112. LECO Business Overview
 Table 113. LECO Scientific Research Instruments Product
 Table 114. LECO Revenue in Scientific Research Instruments Business (2020-2025) & (US$ Million)
 Table 115. LECO Recent Development
 Table 116. Bruker Company Details
 Table 117. Bruker Business Overview
 Table 118. Bruker Scientific Research Instruments Product
 Table 119. Bruker Revenue in Scientific Research Instruments Business (2020-2025) & (US$ Million)
 Table 120. Bruker Recent Development
 Table 121. Yokogawa Electric Company Details
 Table 122. Yokogawa Electric Business Overview
 Table 123. Yokogawa Electric Scientific Research Instruments Product
 Table 124. Yokogawa Electric Revenue in Scientific Research Instruments Business (2020-2025) & (US$ Million)
 Table 125. Yokogawa Electric Recent Development
 Table 126. VIAVI Solutions Company Details
 Table 127. VIAVI Solutions Business Overview
 Table 128. VIAVI Solutions Scientific Research Instruments Product
 Table 129. VIAVI Solutions Revenue in Scientific Research Instruments Business (2020-2025) & (US$ Million)
 Table 130. VIAVI Solutions Recent Development
 Table 131. Coherent Company Details
 Table 132. Coherent Business Overview
 Table 133. Coherent Scientific Research Instruments Product
 Table 134. Coherent Revenue in Scientific Research Instruments Business (2020-2025) & (US$ Million)
 Table 135. Coherent Recent Development
 Table 136. Anritsu Company Details
 Table 137. Anritsu Business Overview
 Table 138. Anritsu Scientific Research Instruments Product
 Table 139. Anritsu Revenue in Scientific Research Instruments Business (2020-2025) & (US$ Million)
 Table 140. Anritsu Recent Development
 Table 141. EXFO Company Details
 Table 142. EXFO Business Overview
 Table 143. EXFO Scientific Research Instruments Product
 Table 144. EXFO Revenue in Scientific Research Instruments Business (2020-2025) & (US$ Million)
 Table 145. EXFO Recent Development
 Table 146. Thorlabs Company Details
 Table 147. Thorlabs Business Overview
 Table 148. Thorlabs Scientific Research Instruments Product
 Table 149. Thorlabs Revenue in Scientific Research Instruments Business (2020-2025) & (US$ Million)
 Table 150. Thorlabs Recent Development
 Table 151. Optoplex Company Details
 Table 152. Optoplex Business Overview
 Table 153. Optoplex Scientific Research Instruments Product
 Table 154. Optoplex Revenue in Scientific Research Instruments Business (2020-2025) & (US$ Million)
 Table 155. Optoplex Recent Development
 Table 156. Anyeep Company Details
 Table 157. Anyeep Business Overview
 Table 158. Anyeep Scientific Research Instruments Product
 Table 159. Anyeep Revenue in Scientific Research Instruments Business (2020-2025) & (US$ Million)
 Table 160. Anyeep Recent Development
 Table 161. Focused Photonics Company Details
 Table 162. Focused Photonics Business Overview
 Table 163. Focused Photonics Scientific Research Instruments Product
 Table 164. Focused Photonics Revenue in Scientific Research Instruments Business (2020-2025) & (US$ Million)
 Table 165. Focused Photonics Recent Development
 Table 166. Tianjin Honour Instrument Company Details
 Table 167. Tianjin Honour Instrument Business Overview
 Table 168. Tianjin Honour Instrument Scientific Research Instruments Product
 Table 169. Tianjin Honour Instrument Revenue in Scientific Research Instruments Business (2020-2025) & (US$ Million)
 Table 170. Tianjin Honour Instrument Recent Development
 Table 171. Hanon Advanced Technology Group Company Details
 Table 172. Hanon Advanced Technology Group Business Overview
 Table 173. Hanon Advanced Technology Group Scientific Research Instruments Product
 Table 174. Hanon Advanced Technology Group Revenue in Scientific Research Instruments Business (2020-2025) & (US$ Million)
 Table 175. Hanon Advanced Technology Group Recent Development
 Table 176. Ningbo Scientz Biotechnology Company Details
 Table 177. Ningbo Scientz Biotechnology Business Overview
 Table 178. Ningbo Scientz Biotechnology Scientific Research Instruments Product
 Table 179. Ningbo Scientz Biotechnology Revenue in Scientific Research Instruments Business (2020-2025) & (US$ Million)
 Table 180. Ningbo Scientz Biotechnology Recent Development
 Table 181. INFICON Company Details
 Table 182. INFICON Business Overview
 Table 183. INFICON Scientific Research Instruments Product
 Table 184. INFICON Revenue in Scientific Research Instruments Business (2020-2025) & (US$ Million)
 Table 185. INFICON Recent Development
 Table 186. Waters Company Details
 Table 187. Waters Business Overview
 Table 188. Waters Scientific Research Instruments Product
 Table 189. Waters Revenue in Scientific Research Instruments Business (2020-2025) & (US$ Million)
 Table 190. Waters Recent Development
 Table 191. Ceyear Technologies Company Details
 Table 192. Ceyear Technologies Business Overview
 Table 193. Ceyear Technologies Scientific Research Instruments Product
 Table 194. Ceyear Technologies Revenue in Scientific Research Instruments Business (2020-2025) & (US$ Million)
 Table 195. Ceyear Technologies Recent Development
 Table 196. VeEX Company Details
 Table 197. VeEX Business Overview
 Table 198. VeEX Scientific Research Instruments Product
 Table 199. VeEX Revenue in Scientific Research Instruments Business (2020-2025) & (US$ Million)
 Table 200. VeEX Recent Development
 Table 201. Olympus (Evident) Company Details
 Table 202. Olympus (Evident) Business Overview
 Table 203. Olympus (Evident) Scientific Research Instruments Product
 Table 204. Olympus (Evident) Revenue in Scientific Research Instruments Business (2020-2025) & (US$ Million)
 Table 205. Olympus (Evident) Recent Development
 Table 206. Nikon Company Details
 Table 207. Nikon Business Overview
 Table 208. Nikon Scientific Research Instruments Product
 Table 209. Nikon Revenue in Scientific Research Instruments Business (2020-2025) & (US$ Million)
 Table 210. Nikon Recent Development
 Table 211. Leica Company Details
 Table 212. Leica Business Overview
 Table 213. Leica Scientific Research Instruments Product
 Table 214. Leica Revenue in Scientific Research Instruments Business (2020-2025) & (US$ Million)
 Table 215. Leica Recent Development
 Table 216. Celestron Company Details
 Table 217. Celestron Business Overview
 Table 218. Celestron Scientific Research Instruments Product
 Table 219. Celestron Revenue in Scientific Research Instruments Business (2020-2025) & (US$ Million)
 Table 220. Celestron Recent Development
 Table 221. Ningbo Yongxin Optics Company Details
 Table 222. Ningbo Yongxin Optics Business Overview
 Table 223. Ningbo Yongxin Optics Scientific Research Instruments Product
 Table 224. Ningbo Yongxin Optics Revenue in Scientific Research Instruments Business (2020-2025) & (US$ Million)
 Table 225. Ningbo Yongxin Optics Recent Development
 Table 226. Sunny Optical Technology Company Details
 Table 227. Sunny Optical Technology Business Overview
 Table 228. Sunny Optical Technology Scientific Research Instruments Product
 Table 229. Sunny Optical Technology Revenue in Scientific Research Instruments Business (2020-2025) & (US$ Million)
 Table 230. Sunny Optical Technology Recent Development
 Table 231. Guilin Guiguang Instrument Company Details
 Table 232. Guilin Guiguang Instrument Business Overview
 Table 233. Guilin Guiguang Instrument Scientific Research Instruments Product
 Table 234. Guilin Guiguang Instrument Revenue in Scientific Research Instruments Business (2020-2025) & (US$ Million)
 Table 235. Guilin Guiguang Instrument Recent Development
 Table 236. CHONGQING OPTEC INSTRUMENT Company Details
 Table 237. CHONGQING OPTEC INSTRUMENT Business Overview
 Table 238. CHONGQING OPTEC INSTRUMENT Scientific Research Instruments Product
 Table 239. CHONGQING OPTEC INSTRUMENT Revenue in Scientific Research Instruments Business (2020-2025) & (US$ Million)
 Table 240. CHONGQING OPTEC INSTRUMENT Recent Development
 Table 241. Motic Company Details
 Table 242. Motic Business Overview
 Table 243. Motic Scientific Research Instruments Product
 Table 244. Motic Revenue in Scientific Research Instruments Business (2020-2025) & (US$ Million)
 Table 245. Motic Recent Development
 Table 246. Research Programs/Design for This Report
 Table 247. Key Data Information from Secondary Sources
 Table 248. Key Data Information from Primary Sources
 Table 249. Authors List of This Report


List of Figures
 Figure 1. Scientific Research Instruments Picture
 Figure 2. Global Scientific Research Instruments Market Size Comparison by Type (2020-2031) & (US$ Million)
 Figure 3. Global Scientific Research Instruments Market Share by Type: 2024 VS 2031
 Figure 4. Biochemical Separation and Analysis Instruments Features
 Figure 5. Mass Spectrometers Features
 Figure 6. Spectrometers Features
 Figure 7. Chromatographic Instruments Features
 Figure 8. Microscopes and Image Analysis Instruments Features
 Figure 9. Electronic Optical Instruments Features
 Figure 10. X-ray Instruments Features
 Figure 11. Others Features
 Figure 12. Global Scientific Research Instruments Market Size by Application (2020-2031) & (US$ Million)
 Figure 13. Global Scientific Research Instruments Market Share by Application: 2024 VS 2031
 Figure 14. Biomedicine Case Studies
 Figure 15. Food Case Studies
 Figure 16. Agriculture and Forestry Case Studies
 Figure 17. Environmental Testing Case Studies
 Figure 18. Chemical Case Studies
 Figure 19. Scientific Research Case Studies
 Figure 20. Others Case Studies
 Figure 21. Scientific Research Instruments Report Years Considered
 Figure 22. Global Scientific Research Instruments Market Size (US$ Million), Year-over-Year: 2020-2031
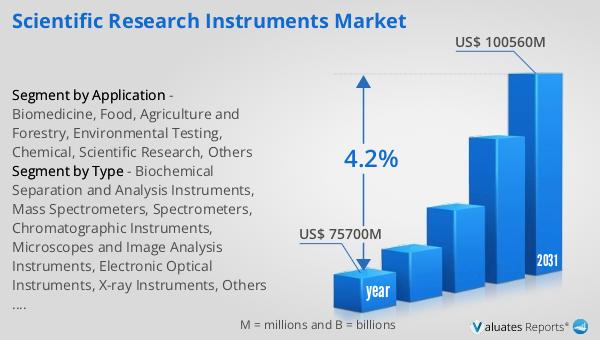
 Figure 23. Global Scientific Research Instruments Market Size, (US$ Million), 2020 VS 2024 VS 2031
 Figure 24. Global Scientific Research Instruments Market Share by Region: 2024 VS 2031
 Figure 25. Global Scientific Research Instruments Market Share by Players in 2024
 Figure 26. Global Top Scientific Research Instruments Players by Company Type (Tier 1, Tier 2, and Tier 3) & (based on the Revenue in Scientific Research Instruments as of 2024)
 Figure 27. The Top 10 and 5 Players Market Share by Scientific Research Instruments Revenue in 2024
 Figure 28. North America Scientific Research Instruments Market Size YoY Growth (2020-2031) & (US$ Million)
 Figure 29. North America Scientific Research Instruments Market Share by Country (2020-2031)
 Figure 30. United States Scientific Research Instruments Market Size YoY Growth (2020-2031) & (US$ Million)
 Figure 31. Canada Scientific Research Instruments Market Size YoY Growth (2020-2031) & (US$ Million)
 Figure 32. Europe Scientific Research Instruments Market Size YoY Growth (2020-2031) & (US$ Million)
 Figure 33. Europe Scientific Research Instruments Market Share by Country (2020-2031)
 Figure 34. Germany Scientific Research Instruments Market Size YoY Growth (2020-2031) & (US$ Million)
 Figure 35. France Scientific Research Instruments Market Size YoY Growth (2020-2031) & (US$ Million)
 Figure 36. U.K. Scientific Research Instruments Market Size YoY Growth (2020-2031) & (US$ Million)
 Figure 37. Italy Scientific Research Instruments Market Size YoY Growth (2020-2031) & (US$ Million)
 Figure 38. Russia Scientific Research Instruments Market Size YoY Growth (2020-2031) & (US$ Million)
 Figure 39. Nordic Countries Scientific Research Instruments Market Size YoY Growth (2020-2031) & (US$ Million)
 Figure 40. Asia-Pacific Scientific Research Instruments Market Size YoY Growth (2020-2031) & (US$ Million)
 Figure 41. Asia-Pacific Scientific Research Instruments Market Share by Region (2020-2031)
 Figure 42. China Scientific Research Instruments Market Size YoY Growth (2020-2031) & (US$ Million)
 Figure 43. Japan Scientific Research Instruments Market Size YoY Growth (2020-2031) & (US$ Million)
 Figure 44. South Korea Scientific Research Instruments Market Size YoY Growth (2020-2031) & (US$ Million)
 Figure 45. Southeast Asia Scientific Research Instruments Market Size YoY Growth (2020-2031) & (US$ Million)
 Figure 46. India Scientific Research Instruments Market Size YoY Growth (2020-2031) & (US$ Million)
 Figure 47. Australia Scientific Research Instruments Market Size YoY Growth (2020-2031) & (US$ Million)
 Figure 48. Latin America Scientific Research Instruments Market Size YoY Growth (2020-2031) & (US$ Million)
 Figure 49. Latin America Scientific Research Instruments Market Share by Country (2020-2031)
 Figure 50. Mexico Scientific Research Instruments Market Size YoY Growth (2020-2031) & (US$ Million)
 Figure 51. Brazil Scientific Research Instruments Market Size YoY Growth (2020-2031) & (US$ Million)
 Figure 52. Middle East & Africa Scientific Research Instruments Market Size YoY Growth (2020-2031) & (US$ Million)
 Figure 53. Middle East & Africa Scientific Research Instruments Market Share by Country (2020-2031)
 Figure 54. Turkey Scientific Research Instruments Market Size YoY Growth (2020-2031) & (US$ Million)
 Figure 55. Saudi Arabia Scientific Research Instruments Market Size YoY Growth (2020-2031) & (US$ Million)
 Figure 56. UAE Scientific Research Instruments Market Size YoY Growth (2020-2031) & (US$ Million)
 Figure 57. Thermo Fisher Scientific Revenue Growth Rate in Scientific Research Instruments Business (2020-2025)
 Figure 58. Roche Revenue Growth Rate in Scientific Research Instruments Business (2020-2025)
 Figure 59. Agilent Technologies Revenue Growth Rate in Scientific Research Instruments Business (2020-2025)
 Figure 60. Danaher Corporation Revenue Growth Rate in Scientific Research Instruments Business (2020-2025)
 Figure 61. SHIMADZU Revenue Growth Rate in Scientific Research Instruments Business (2020-2025)
 Figure 62. Techcomp Revenue Growth Rate in Scientific Research Instruments Business (2020-2025)
 Figure 63. HORIBA Scientific Revenue Growth Rate in Scientific Research Instruments Business (2020-2025)
 Figure 64. PerkinElmer Revenue Growth Rate in Scientific Research Instruments Business (2020-2025)
 Figure 65. Hitachi Revenue Growth Rate in Scientific Research Instruments Business (2020-2025)
 Figure 66. Zeiss Revenue Growth Rate in Scientific Research Instruments Business (2020-2025)
 Figure 67. Ametek Revenue Growth Rate in Scientific Research Instruments Business (2020-2025)
 Figure 68. JEOL Revenue Growth Rate in Scientific Research Instruments Business (2020-2025)
 Figure 69. LECO Revenue Growth Rate in Scientific Research Instruments Business (2020-2025)
 Figure 70. Bruker Revenue Growth Rate in Scientific Research Instruments Business (2020-2025)
 Figure 71. Yokogawa Electric Revenue Growth Rate in Scientific Research Instruments Business (2020-2025)
 Figure 72. VIAVI Solutions Revenue Growth Rate in Scientific Research Instruments Business (2020-2025)
 Figure 73. Coherent Revenue Growth Rate in Scientific Research Instruments Business (2020-2025)
 Figure 74. Anritsu Revenue Growth Rate in Scientific Research Instruments Business (2020-2025)
 Figure 75. EXFO Revenue Growth Rate in Scientific Research Instruments Business (2020-2025)
 Figure 76. Thorlabs Revenue Growth Rate in Scientific Research Instruments Business (2020-2025)
 Figure 77. Optoplex Revenue Growth Rate in Scientific Research Instruments Business (2020-2025)
 Figure 78. Anyeep Revenue Growth Rate in Scientific Research Instruments Business (2020-2025)
 Figure 79. Focused Photonics Revenue Growth Rate in Scientific Research Instruments Business (2020-2025)
 Figure 80. Tianjin Honour Instrument Revenue Growth Rate in Scientific Research Instruments Business (2020-2025)
 Figure 81. Hanon Advanced Technology Group Revenue Growth Rate in Scientific Research Instruments Business (2020-2025)
 Figure 82. Ningbo Scientz Biotechnology Revenue Growth Rate in Scientific Research Instruments Business (2020-2025)
 Figure 83. INFICON Revenue Growth Rate in Scientific Research Instruments Business (2020-2025)
 Figure 84. Waters Revenue Growth Rate in Scientific Research Instruments Business (2020-2025)
 Figure 85. Ceyear Technologies Revenue Growth Rate in Scientific Research Instruments Business (2020-2025)
 Figure 86. VeEX Revenue Growth Rate in Scientific Research Instruments Business (2020-2025)
 Figure 87. Olympus (Evident) Revenue Growth Rate in Scientific Research Instruments Business (2020-2025)
 Figure 88. Nikon Revenue Growth Rate in Scientific Research Instruments Business (2020-2025)
 Figure 89. Leica Revenue Growth Rate in Scientific Research Instruments Business (2020-2025)
 Figure 90. Celestron Revenue Growth Rate in Scientific Research Instruments Business (2020-2025)
 Figure 91. Ningbo Yongxin Optics Revenue Growth Rate in Scientific Research Instruments Business (2020-2025)
 Figure 92. Sunny Optical Technology Revenue Growth Rate in Scientific Research Instruments Business (2020-2025)
 Figure 93. Guilin Guiguang Instrument Revenue Growth Rate in Scientific Research Instruments Business (2020-2025)
 Figure 94. CHONGQING OPTEC INSTRUMENT Revenue Growth Rate in Scientific Research Instruments Business (2020-2025)
 Figure 95. Motic Revenue Growth Rate in Scientific Research Instruments Business (2020-2025)
 Figure 96. Bottom-up and Top-down Approaches for This Report
 Figure 97. Data Triangulation
 Figure 98. Key Executives Interviewed
SELECT A FORMAT
Added to Cart
Electronic (PDF)

$2900

This license allows only one user to access the PDF.
Electronic (PDF)

$4350

This license allows 1 - 5 user to access the PDF, license is suitable for small groups of 5 users working together
Electronic (PDF)

$5800

This license allows users/teams in a same Enterprise to use this report, various departments within an enterpise can use this report
Add to Cart
Buy Now (15% Discount)

OUR CUSTOMER

SIS Group of Schools

RELATED REPORTS

Global Salt Active Nuclease Market Research Report 2025

120 Pages
Type: Report
Code: QYRE-Auto-6W17226
Fri Sep 12 00:00:00 UTC 2025

Add to Cart

Global Ecology Products Market Research Report 2025

120 Pages
Type: Report
Code: QYRE-Auto-29H6022
Fri Sep 12 00:00:00 UTC 2025

Add to Cart

Global Robotics Paint Booth Market Research Report 2025

120 Pages
Type: Report
Code: QYRE-Auto-3R7922
Fri Sep 12 00:00:00 UTC 2025

Add to Cart

Global Parietal Bone Model Market Research Report 2025

120 Pages
Type: Report
Code: QYRE-Auto-34V19460
Fri Sep 12 00:00:00 UTC 2025

Add to Cart