List of Tables
Table 1. Global Tapered Section Retaining Rings Market Size Growth Rate by Type (US$ Million): 2020 VS 2024 VS 2031
Table 2. Key Players of Internal Retaining Rings
Table 3. Key Players of External Retaining Rings
Table 4. Global Tapered Section Retaining Rings Market Size Growth Rate by Material (US$ Million): 2020 VS 2024 VS 2031
Table 5. Key Players of Carbon Steel
Table 6. Key Players of Stainless Steel
Table 7. Key Players of Beryllium Copper
Table 8. Key Players of Others
Table 9. Global Tapered Section Retaining Rings Market Size Growth Rate by Manufacturing Method (US$ Million): 2020 VS 2024 VS 2031
Table 10. Key Players of Stamped Retaining Rings
Table 11. Key Players of Coiled Retaining Rings
Table 12. Key Players of Machined Retaining Rings
Table 13. Key Players of Laser-Cut Retaining Rings
Table 14. Key Players of Others
Table 15. Global Tapered Section Retaining Rings Market Size Growth Rate by Cross-Section Size (US$ Million): 2020 VS 2024 VS 2031
Table 16. Key Players of Miniature Size
Table 17. Key Players of Standard Industrial Size
Table 18. Key Players of Large / Heavy-Duty Size
Table 19. Global Tapered Section Retaining Rings Market Size Growth by Application (US$ Million): 2020 VS 2024 VS 2031
Table 20. Global Tapered Section Retaining Rings Market Size by Region (US$ Million): 2020 VS 2024 VS 2031
Table 21. Global Tapered Section Retaining Rings Market Size by Region (2020-2025) & (US$ Million)
Table 22. Global Tapered Section Retaining Rings Market Share by Region (2020-2025)
Table 23. Global Tapered Section Retaining Rings Forecasted Market Size by Region (2026-2031) & (US$ Million)
Table 24. Global Tapered Section Retaining Rings Market Share by Region (2026-2031)
Table 25. Tapered Section Retaining Rings Market Trends
Table 26. Tapered Section Retaining Rings Market Drivers
Table 27. Tapered Section Retaining Rings Market Challenges
Table 28. Tapered Section Retaining Rings Market Restraints
Table 29. Global Tapered Section Retaining Rings Revenue by Players (2020-2025) & (US$ Million)
Table 30. Global Tapered Section Retaining Rings Market Share by Players (2020-2025)
Table 31. Global Top Tapered Section Retaining Rings Players by Company Type (Tier 1, Tier 2, and Tier 3) & (based on the Revenue in Tapered Section Retaining Rings as of 2024)
Table 32. Ranking of Global Top Tapered Section Retaining Rings Companies by Revenue (US$ Million) in 2024
Table 33. Global 5 Largest Players Market Share by Tapered Section Retaining Rings Revenue (CR5 and HHI) & (2020-2025)
Table 34. Global Key Players of Tapered Section Retaining Rings, Headquarters and Area Served
Table 35. Global Key Players of Tapered Section Retaining Rings, Product and Application
Table 36. Global Key Players of Tapered Section Retaining Rings, Date of Enter into This Industry
Table 37. Mergers & Acquisitions, Expansion Plans
Table 38. Global Tapered Section Retaining Rings Market Size by Type (2020-2025) & (US$ Million)
Table 39. Global Tapered Section Retaining Rings Revenue Market Share by Type (2020-2025)
Table 40. Global Tapered Section Retaining Rings Forecasted Market Size by Type (2026-2031) & (US$ Million)
Table 41. Global Tapered Section Retaining Rings Revenue Market Share by Type (2026-2031)
Table 42. Global Tapered Section Retaining Rings Market Size by Application (2020-2025) & (US$ Million)
Table 43. Global Tapered Section Retaining Rings Revenue Market Share by Application (2020-2025)
Table 44. Global Tapered Section Retaining Rings Forecasted Market Size by Application (2026-2031) & (US$ Million)
Table 45. Global Tapered Section Retaining Rings Revenue Market Share by Application (2026-2031)
Table 46. North America Tapered Section Retaining Rings Market Size Growth Rate by Country (US$ Million): 2020 VS 2024 VS 2031
Table 47. North America Tapered Section Retaining Rings Market Size by Country (2020-2025) & (US$ Million)
Table 48. North America Tapered Section Retaining Rings Market Size by Country (2026-2031) & (US$ Million)
Table 49. Europe Tapered Section Retaining Rings Market Size Growth Rate by Country (US$ Million): 2020 VS 2024 VS 2031
Table 50. Europe Tapered Section Retaining Rings Market Size by Country (2020-2025) & (US$ Million)
Table 51. Europe Tapered Section Retaining Rings Market Size by Country (2026-2031) & (US$ Million)
Table 52. Asia-Pacific Tapered Section Retaining Rings Market Size Growth Rate by Region (US$ Million): 2020 VS 2024 VS 2031
Table 53. Asia-Pacific Tapered Section Retaining Rings Market Size by Region (2020-2025) & (US$ Million)
Table 54. Asia-Pacific Tapered Section Retaining Rings Market Size by Region (2026-2031) & (US$ Million)
Table 55. Latin America Tapered Section Retaining Rings Market Size Growth Rate by Country (US$ Million): 2020 VS 2024 VS 2031
Table 56. Latin America Tapered Section Retaining Rings Market Size by Country (2020-2025) & (US$ Million)
Table 57. Latin America Tapered Section Retaining Rings Market Size by Country (2026-2031) & (US$ Million)
Table 58. Middle East & Africa Tapered Section Retaining Rings Market Size Growth Rate by Country (US$ Million): 2020 VS 2024 VS 2031
Table 59. Middle East & Africa Tapered Section Retaining Rings Market Size by Country (2020-2025) & (US$ Million)
Table 60. Middle East & Africa Tapered Section Retaining Rings Market Size by Country (2026-2031) & (US$ Million)
Table 61. Rotor Clip Company, Inc. Company Details
Table 62. Rotor Clip Company, Inc. Business Overview
Table 63. Rotor Clip Company, Inc. Tapered Section Retaining Rings Product
Table 64. Rotor Clip Company, Inc. Revenue in Tapered Section Retaining Rings Business (2020-2025) & (US$ Million)
Table 65. Rotor Clip Company, Inc. Recent Development
Table 66. Smalley Steel Ring Company Company Details
Table 67. Smalley Steel Ring Company Business Overview
Table 68. Smalley Steel Ring Company Tapered Section Retaining Rings Product
Table 69. Smalley Steel Ring Company Revenue in Tapered Section Retaining Rings Business (2020-2025) & (US$ Million)
Table 70. Smalley Steel Ring Company Recent Development
Table 71. American Ring Manufacturing Company Details
Table 72. American Ring Manufacturing Business Overview
Table 73. American Ring Manufacturing Tapered Section Retaining Rings Product
Table 74. American Ring Manufacturing Revenue in Tapered Section Retaining Rings Business (2020-2025) & (US$ Million)
Table 75. American Ring Manufacturing Recent Development
Table 76. Arcon Ring Company Company Details
Table 77. Arcon Ring Company Business Overview
Table 78. Arcon Ring Company Tapered Section Retaining Rings Product
Table 79. Arcon Ring Company Revenue in Tapered Section Retaining Rings Business (2020-2025) & (US$ Million)
Table 80. Arcon Ring Company Recent Development
Table 81. Cirteq Limited Company Details
Table 82. Cirteq Limited Business Overview
Table 83. Cirteq Limited Tapered Section Retaining Rings Product
Table 84. Cirteq Limited Revenue in Tapered Section Retaining Rings Business (2020-2025) & (US$ Million)
Table 85. Cirteq Limited Recent Development
Table 86. MW Industries Company Details
Table 87. MW Industries Business Overview
Table 88. MW Industries Tapered Section Retaining Rings Product
Table 89. MW Industries Revenue in Tapered Section Retaining Rings Business (2020-2025) & (US$ Million)
Table 90. MW Industries Recent Development
Table 91. Star Circlips & Engineering Ltd. Company Details
Table 92. Star Circlips & Engineering Ltd. Business Overview
Table 93. Star Circlips & Engineering Ltd. Tapered Section Retaining Rings Product
Table 94. Star Circlips & Engineering Ltd. Revenue in Tapered Section Retaining Rings Business (2020-2025) & (US$ Million)
Table 95. Star Circlips & Engineering Ltd. Recent Development
Table 96. Lesjöfors AB Company Details
Table 97. Lesjöfors AB Business Overview
Table 98. Lesjöfors AB Tapered Section Retaining Rings Product
Table 99. Lesjöfors AB Revenue in Tapered Section Retaining Rings Business (2020-2025) & (US$ Million)
Table 100. Lesjöfors AB Recent Development
Table 101. IWATA DENKO Co., Ltd. Company Details
Table 102. IWATA DENKO Co., Ltd. Business Overview
Table 103. IWATA DENKO Co., Ltd. Tapered Section Retaining Rings Product
Table 104. IWATA DENKO Co., Ltd. Revenue in Tapered Section Retaining Rings Business (2020-2025) & (US$ Million)
Table 105. IWATA DENKO Co., Ltd. Recent Development
Table 106. TAIYO Stainless Spring Co., Ltd. Company Details
Table 107. TAIYO Stainless Spring Co., Ltd. Business Overview
Table 108. TAIYO Stainless Spring Co., Ltd. Tapered Section Retaining Rings Product
Table 109. TAIYO Stainless Spring Co., Ltd. Revenue in Tapered Section Retaining Rings Business (2020-2025) & (US$ Million)
Table 110. TAIYO Stainless Spring Co., Ltd. Recent Development
Table 111. Daemar Inc. Company Details
Table 112. Daemar Inc. Business Overview
Table 113. Daemar Inc. Tapered Section Retaining Rings Product
Table 114. Daemar Inc. Revenue in Tapered Section Retaining Rings Business (2020-2025) & (US$ Million)
Table 115. Daemar Inc. Recent Development
Table 116. Garlock Company Details
Table 117. Garlock Business Overview
Table 118. Garlock Tapered Section Retaining Rings Product
Table 119. Garlock Revenue in Tapered Section Retaining Rings Business (2020-2025) & (US$ Million)
Table 120. Garlock Recent Development
Table 121. Barnes Group Inc. Company Details
Table 122. Barnes Group Inc. Business Overview
Table 123. Barnes Group Inc. Tapered Section Retaining Rings Product
Table 124. Barnes Group Inc. Revenue in Tapered Section Retaining Rings Business (2020-2025) & (US$ Million)
Table 125. Barnes Group Inc. Recent Development
Table 126. Weasler Engineering Company Details
Table 127. Weasler Engineering Business Overview
Table 128. Weasler Engineering Tapered Section Retaining Rings Product
Table 129. Weasler Engineering Revenue in Tapered Section Retaining Rings Business (2020-2025) & (US$ Million)
Table 130. Weasler Engineering Recent Development
Table 131. Research Programs/Design for This Report
Table 132. Key Data Information from Secondary Sources
Table 133. Key Data Information from Primary Sources
Table 134. Authors List of This Report
List of Figures
Figure 1. Tapered Section Retaining Rings Picture
Figure 2. Global Tapered Section Retaining Rings Market Size Comparison by Type (2020-2031) & (US$ Million)
Figure 3. Global Tapered Section Retaining Rings Market Share by Type: 2024 VS 2031
Figure 4. Internal Retaining Rings Features
Figure 5. External Retaining Rings Features
Figure 6. Global Tapered Section Retaining Rings Market Size Comparison by Material (2020-2031) & (US$ Million)
Figure 7. Carbon Steel Features
Figure 8. Stainless Steel Features
Figure 9. Beryllium Copper Features
Figure 10. Others Features
Figure 11. Global Tapered Section Retaining Rings Market Size Comparison by Manufacturing Method (2020-2031) & (US$ Million)
Figure 12. Stamped Retaining Rings Features
Figure 13. Coiled Retaining Rings Features
Figure 14. Machined Retaining Rings Features
Figure 15. Laser-Cut Retaining Rings Features
Figure 16. Others Features
Figure 17. Global Tapered Section Retaining Rings Market Size Comparison by Cross-Section Size (2020-2031) & (US$ Million)
Figure 18. Miniature Size Features
Figure 19. Standard Industrial Size Features
Figure 20. Large / Heavy-Duty Size Features
Figure 21. Global Tapered Section Retaining Rings Market Size by Application (2020-2031) & (US$ Million)
Figure 22. Global Tapered Section Retaining Rings Market Share by Application: 2024 VS 2031
Figure 23. Automotive Case Studies
Figure 24. Industrial Machinery & Equipment Case Studies
Figure 25. Aerospace Case Studies
Figure 26. Medical Case Studies
Figure 27. Others Case Studies
Figure 28. Tapered Section Retaining Rings Report Years Considered
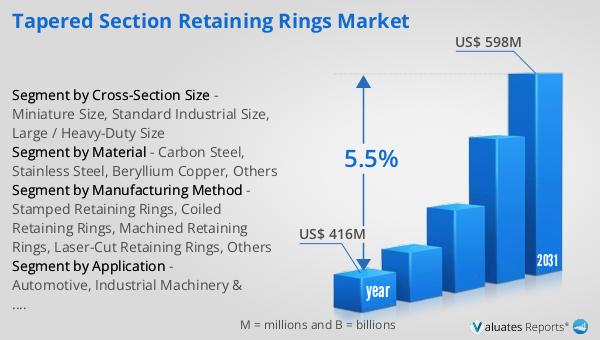
Figure 29. Global Tapered Section Retaining Rings Market Size (US$ Million), Year-over-Year: 2020-2031
Figure 30. Global Tapered Section Retaining Rings Market Size, (US$ Million), 2020 VS 2024 VS 2031
Figure 31. Global Tapered Section Retaining Rings Market Share by Region: 2024 VS 2031
Figure 32. Global Tapered Section Retaining Rings Market Share by Players in 2024
Figure 33. Global Tapered Section Retaining Rings Market Share by Company Type (Tier 1, Tier 2, and Tier 3)
Figure 34. The Top 10 and 5 Players Market Share by Tapered Section Retaining Rings Revenue in 2024
Figure 35. North America Tapered Section Retaining Rings Market Size YoY Growth (2020-2031) & (US$ Million)
Figure 36. North America Tapered Section Retaining Rings Market Share by Country (2020-2031)
Figure 37. United States Tapered Section Retaining Rings Market Size YoY Growth (2020-2031) & (US$ Million)
Figure 38. Canada Tapered Section Retaining Rings Market Size YoY Growth (2020-2031) & (US$ Million)
Figure 39. Europe Tapered Section Retaining Rings Market Size YoY Growth (2020-2031) & (US$ Million)
Figure 40. Europe Tapered Section Retaining Rings Market Share by Country (2020-2031)
Figure 41. Germany Tapered Section Retaining Rings Market Size YoY Growth (2020-2031) & (US$ Million)
Figure 42. France Tapered Section Retaining Rings Market Size YoY Growth (2020-2031) & (US$ Million)
Figure 43. U.K. Tapered Section Retaining Rings Market Size YoY Growth (2020-2031) & (US$ Million)
Figure 44. Italy Tapered Section Retaining Rings Market Size YoY Growth (2020-2031) & (US$ Million)
Figure 45. Russia Tapered Section Retaining Rings Market Size YoY Growth (2020-2031) & (US$ Million)
Figure 46. Ireland Tapered Section Retaining Rings Market Size YoY Growth (2020-2031) & (US$ Million)
Figure 47. Asia-Pacific Tapered Section Retaining Rings Market Size YoY Growth (2020-2031) & (US$ Million)
Figure 48. Asia-Pacific Tapered Section Retaining Rings Market Share by Region (2020-2031)
Figure 49. China Tapered Section Retaining Rings Market Size YoY Growth (2020-2031) & (US$ Million)
Figure 50. Japan Tapered Section Retaining Rings Market Size YoY Growth (2020-2031) & (US$ Million)
Figure 51. South Korea Tapered Section Retaining Rings Market Size YoY Growth (2020-2031) & (US$ Million)
Figure 52. Southeast Asia Tapered Section Retaining Rings Market Size YoY Growth (2020-2031) & (US$ Million)
Figure 53. India Tapered Section Retaining Rings Market Size YoY Growth (2020-2031) & (US$ Million)
Figure 54. Australia & New Zealand Tapered Section Retaining Rings Market Size YoY Growth (2020-2031) & (US$ Million)
Figure 55. Latin America Tapered Section Retaining Rings Market Size YoY Growth (2020-2031) & (US$ Million)
Figure 56. Latin America Tapered Section Retaining Rings Market Share by Country (2020-2031)
Figure 57. Mexico Tapered Section Retaining Rings Market Size YoY Growth (2020-2031) & (US$ Million)
Figure 58. Brazil Tapered Section Retaining Rings Market Size YoY Growth (2020-2031) & (US$ Million)
Figure 59. Middle East & Africa Tapered Section Retaining Rings Market Size YoY Growth (2020-2031) & (US$ Million)
Figure 60. Middle East & Africa Tapered Section Retaining Rings Market Share by Country (2020-2031)
Figure 61. Israel Tapered Section Retaining Rings Market Size YoY Growth (2020-2031) & (US$ Million)
Figure 62. Saudi Arabia Tapered Section Retaining Rings Market Size YoY Growth (2020-2031) & (US$ Million)
Figure 63. UAE Tapered Section Retaining Rings Market Size YoY Growth (2020-2031) & (US$ Million)
Figure 64. Rotor Clip Company, Inc. Revenue Growth Rate in Tapered Section Retaining Rings Business (2020-2025)
Figure 65. Smalley Steel Ring Company Revenue Growth Rate in Tapered Section Retaining Rings Business (2020-2025)
Figure 66. American Ring Manufacturing Revenue Growth Rate in Tapered Section Retaining Rings Business (2020-2025)
Figure 67. Arcon Ring Company Revenue Growth Rate in Tapered Section Retaining Rings Business (2020-2025)
Figure 68. Cirteq Limited Revenue Growth Rate in Tapered Section Retaining Rings Business (2020-2025)
Figure 69. MW Industries Revenue Growth Rate in Tapered Section Retaining Rings Business (2020-2025)
Figure 70. Star Circlips & Engineering Ltd. Revenue Growth Rate in Tapered Section Retaining Rings Business (2020-2025)
Figure 71. Lesjöfors AB Revenue Growth Rate in Tapered Section Retaining Rings Business (2020-2025)
Figure 72. IWATA DENKO Co., Ltd. Revenue Growth Rate in Tapered Section Retaining Rings Business (2020-2025)
Figure 73. TAIYO Stainless Spring Co., Ltd. Revenue Growth Rate in Tapered Section Retaining Rings Business (2020-2025)
Figure 74. Daemar Inc. Revenue Growth Rate in Tapered Section Retaining Rings Business (2020-2025)
Figure 75. Garlock Revenue Growth Rate in Tapered Section Retaining Rings Business (2020-2025)
Figure 76. Barnes Group Inc. Revenue Growth Rate in Tapered Section Retaining Rings Business (2020-2025)
Figure 77. Weasler Engineering Revenue Growth Rate in Tapered Section Retaining Rings Business (2020-2025)
Figure 78. Bottom-up and Top-down Approaches for This Report
Figure 79. Data Triangulation
Figure 80. Key Executives Interviewed