0
U.S. (TOLL FREE)
+1 (315) 215-3225
Automative

0
U.S. (TOLL FREE)
+1 (315) 215-3225
Global Business-to-Business (B2B) E-commerce Market Size, Status and Forecast 2021-2027
Published Date: 2021-06-28
|
Report Code: QYRE-Auto-7L5920
Home | Market Reports
Global Business to Business B2B E commerce Market Size Status and Forecast 2021 2027

Global Business-to-Business (B2B) E-commerce Market Size, Status and Forecast 2021-2027

Code: QYRE-Auto-7L5920
Report
2021-06-28
Pages:108
QYResearch
Description
Table of Content
Tables & Figures

B2B eCommerce Market Size 

The global Business-to-Business (B2B) E-commerce market size is projected to reach USD 12496140 Million by 2027, from USD 7059400 Min 2020, at a CAGR of 8.5% during 2021-2027.

B2B eCommerce Market Size

B2B e-commerce, short for business-to-business electronic commerce, is the sale of goods or services between businesses via an online sales portal.

B2B eCommerce Market Manufacturers

Amazon was the global biggest manufacturer in Business-to-Business (B2B) E-commerce industry, followed by Alibaba, Rakuten, IBM, SAP Hybris, Oracle, IndiaMART, Walmart, Mercateo, Magento (Adobe), Global Sources, NetSuite.

With industry-standard accuracy in analysis and high data integrity, the report makes a brilliant attempt to unveil key opportunities available in the global Business-to-Business (B2B) E-commerce market to help players in achieving a strong market position. Buyers of the report can access verified and reliable market forecasts, including those for the overall size of the global Business-to-Business (B2B) E-commerce market in terms of revenue.

On the whole, the report proves to be an effective tool that players can use to gain a competitive edge over their competitors and ensure lasting success in the global Business-to-Business (B2B) E-commerce market. All of the findings, data, and information provided in the report are validated and revalidated with the help of trustworthy sources. The analysts who have authored the report took a unique and industry-best research and analysis approach for an in-depth study of the global Business-to-Business (B2B) E-commerce market.

Business-to-Business (B2B) E-commerce market is segmented by company, region (country), by Type, and by Application. Players, stakeholders, and other participants in the global Business-to-Business (B2B) E-commerce market will be able to gain the upper hand as they use the report as a powerful resource. The segmental analysis focuses on revenue and forecast by Type and by Application in terms of revenue and forecast for the period 2016-2027. 

B2B eCommerce Market Segmentation

By Type

  • Buyer-oriented E-commerce
  • Supplier-oriented E-commerce
  • Intermediary-oriented E-commerce

Intermediary-oriented e-commerce had the biggest market share of 70% in 2018. 

By Application

  • Small and Medium Enterprise
  • Large Enterprise

B2B ecommerce market segmentation

Small and medium enterprise is the greatest segment of business-to-business (B2B) e-commerce application, with a share of 67% in 2018.

By Region

  • North America
  • US.
  • Canada
  • Europe
  • Germany
  • France
  • UK.
  • Italy
  • Russia
  • Nordic
  • Rest of Europe
  • Asia-Pacific
  • China
  • Japan
  • South Korea
  • Southeast Asia
  • India
  • Australia
  • Rest of Asia
  • Latin America
  • Mexico
  • Brazil
  • Rest of Latin America
  • Middle East & Africa
  • Turkey
  • Saudi Arabia
  • UAE
  • Rest of MEA 

Key Companies

  • Amazon
  • Alibaba
  • Rakuten
  • IBM
  • SAP Hybris
  • Oracle
  • IndiaMART
  • Walmart
  • Mercateo
  • Magento (Adobe)
  • Global Sources
  • NetSuite.

Scope of B2B eCommerce Market Report

Report Metric

Details

Report Name

B2B eCommerce Market

Market size value in 2020

USD 7059400 Million

Revenue forecast in 2027

USD 12496140 Million

Growth Rate

CAGR 8.5%

Base year considered

2020

Forecast Period

2021-2027

By Type

Buyer-oriented E-commerce, Supplier-oriented E-commerce, Intermediary-oriented E-commerce

By Application

Small and Medium Enterprise, Large Enterprise

Report Coverage

Revenue & volume forecast, company share, competitive landscape, growth factors, and trends

 Geographic regions covered

North America, Europe, Asia Pacific, Latin America, Middle East & Africa

Frequently Asked Questions About This Report

1. How big is the B2B eCommerce market?

Ans. The global Business-to-Business (B2B) E-commerce market size is projected to reach US$ 12496140 million by 2027, from US$ 7059400 million in 2020, at a CAGR of 8.5% during 2021-2027.

2. Who are the biggest manufacturers available in the B2B eCommerce Industry?

Ans. Amazon was the global biggest manufacturer in Business-to-Business (B2B) E-commerce industry, followed by Alibaba, Rakuten, IBM, SAP Hybris, Oracle, IndiaMART, Walmart, Mercateo, Magento (Adobe), Global Sources, NetSuite.

3. Does the report provides covid-19 impact analysis?

Ans. Yes, the report includes a COVID-19 impact analysis. Also, it is further extended into every individual segment of the report.

4. Which segment type holds largest market share in the Business to Business Ecommerce Market?

Ans. Intermediary-oriented e-commerce had the biggest market share of 70% in 2018.

1 Report Overview
1.1 Study Scope
1.2 Market Analysis by Type
1.2.1 Global Business-to-Business (B2B) E-commerce Market Size Growth Rate by Type: 2016 VS 2021 VS 2027
1.2.2 Buyer-oriented E-commerce
1.2.3 Supplier-oriented E-commerce
1.2.4 Intermediary-oriented E-commerce
1.3 Market by Application
1.3.1 Global Business-to-Business (B2B) E-commerce Market Share by Application: 2016 VS 2021 VS 2027
1.3.2 Small and Medium Enterprise
1.3.3 Large Enterprise
1.4 Study Objectives
1.5 Years Considered
2 Global Growth Trends
2.1 Global Business-to-Business (B2B) E-commerce Market Perspective (2016-2027)
2.2 Business-to-Business (B2B) E-commerce Growth Trends by Regions
2.2.1 Business-to-Business (B2B) E-commerce Market Size by Regions: 2016 VS 2021 VS 2027
2.2.2 Business-to-Business (B2B) E-commerce Historic Market Share by Regions (2016-2021)
2.2.3 Business-to-Business (B2B) E-commerce Forecasted Market Size by Regions (2022-2027)
2.3 Business-to-Business (B2B) E-commerce Industry Dynamic
2.3.1 Business-to-Business (B2B) E-commerce Market Trends
2.3.2 Business-to-Business (B2B) E-commerce Market Drivers
2.3.3 Business-to-Business (B2B) E-commerce Market Challenges
2.3.4 Business-to-Business (B2B) E-commerce Market Restraints
3 Competition Landscape by Key Players
3.1 Global Top Business-to-Business (B2B) E-commerce Players by Revenue
3.1.1 Global Top Business-to-Business (B2B) E-commerce Players by Revenue (2016-2021)
3.1.2 Global Business-to-Business (B2B) E-commerce Revenue Market Share by Players (2016-2021)
3.2 Global Business-to-Business (B2B) E-commerce Market Share by Company Type (Tier 1, Tier 2 and Tier 3)
3.3 Players Covered: Ranking by Business-to-Business (B2B) E-commerce Revenue
3.4 Global Business-to-Business (B2B) E-commerce Market Concentration Ratio
3.4.1 Global Business-to-Business (B2B) E-commerce Market Concentration Ratio (CR5 and HHI)
3.4.2 Global Top 10 and Top 5 Companies by Business-to-Business (B2B) E-commerce Revenue in 2020
3.5 Business-to-Business (B2B) E-commerce Key Players Head office and Area Served
3.6 Key Players Business-to-Business (B2B) E-commerce Product Solution and Service
3.7 Date of Enter into Business-to-Business (B2B) E-commerce Market
3.8 Mergers & Acquisitions, Expansion Plans
4 Business-to-Business (B2B) E-commerce Breakdown Data by Type
4.1 Global Business-to-Business (B2B) E-commerce Historic Market Size by Type (2016-2021)
4.2 Global Business-to-Business (B2B) E-commerce Forecasted Market Size by Type (2022-2027)
5 Business-to-Business (B2B) E-commerce Breakdown Data by Application
5.1 Global Business-to-Business (B2B) E-commerce Historic Market Size by Application (2016-2021)
5.2 Global Business-to-Business (B2B) E-commerce Forecasted Market Size by Application (2022-2027)
6 North America
6.1 North America Business-to-Business (B2B) E-commerce Market Size (2016-2027)
6.2 North America Business-to-Business (B2B) E-commerce Market Size by Type
6.2.1 North America Business-to-Business (B2B) E-commerce Market Size by Type (2016-2021)
6.2.2 North America Business-to-Business (B2B) E-commerce Market Size by Type (2022-2027)
6.2.3 North America Business-to-Business (B2B) E-commerce Market Size by Type (2016-2027)
6.3 North America Business-to-Business (B2B) E-commerce Market Size by Application
6.3.1 North America Business-to-Business (B2B) E-commerce Market Size by Application (2016-2021)
6.3.2 North America Business-to-Business (B2B) E-commerce Market Size by Application (2022-2027)
6.3.3 North America Business-to-Business (B2B) E-commerce Market Size by Application (2016-2027)
6.4 North America Business-to-Business (B2B) E-commerce Market Size by Country
6.4.1 North America Business-to-Business (B2B) E-commerce Market Size by Country (2016-2021)
6.4.2 North America Business-to-Business (B2B) E-commerce Market Size by Country (2022-2027)
6.4.3 United States
6.4.4 Canada
7 Europe
7.1 Europe Business-to-Business (B2B) E-commerce Market Size (2016-2027)
7.2 Europe Business-to-Business (B2B) E-commerce Market Size by Type
7.2.1 Europe Business-to-Business (B2B) E-commerce Market Size by Type (2016-2021)
7.2.2 Europe Business-to-Business (B2B) E-commerce Market Size by Type (2022-2027)
7.2.3 Europe Business-to-Business (B2B) E-commerce Market Size by Type (2016-2027)
7.3 Europe Business-to-Business (B2B) E-commerce Market Size by Application
7.3.1 Europe Business-to-Business (B2B) E-commerce Market Size by Application (2016-2021)
7.3.2 Europe Business-to-Business (B2B) E-commerce Market Size by Application (2022-2027)
7.3.3 Europe Business-to-Business (B2B) E-commerce Market Size by Application (2016-2027)
7.4 Europe Business-to-Business (B2B) E-commerce Market Size by Country
7.4.1 Europe Business-to-Business (B2B) E-commerce Market Size by Country (2016-2021)
7.4.2 Europe Business-to-Business (B2B) E-commerce Market Size by Country (2022-2027)
7.4.3 Germany
7.4.4 France
7.4.5 U.K.
7.4.6 Italy
7.4.7 Russia
7.4.8 Nordic
8 Asia-Pacific
8.1 Asia-Pacific Business-to-Business (B2B) E-commerce Market Size (2016-2027)
8.2 Asia-Pacific Business-to-Business (B2B) E-commerce Market Size by Type
8.2.1 Asia-Pacific Business-to-Business (B2B) E-commerce Market Size by Type (2016-2021)
8.2.2 Asia-Pacific Business-to-Business (B2B) E-commerce Market Size by Type (2022-2027)
8.2.3 Asia-Pacific Business-to-Business (B2B) E-commerce Market Size by Type (2016-2027)
8.3 Asia-Pacific Business-to-Business (B2B) E-commerce Market Size by Application
8.3.1 Asia-Pacific Business-to-Business (B2B) E-commerce Market Size by Application (2016-2021)
8.3.2 Asia-Pacific Business-to-Business (B2B) E-commerce Market Size by Application (2022-2027)
8.3.3 Asia-Pacific Business-to-Business (B2B) E-commerce Market Size by Application (2016-2027)
8.4 Asia-Pacific Business-to-Business (B2B) E-commerce Market Size by Region
8.4.1 Asia-Pacific Business-to-Business (B2B) E-commerce Market Size by Region (2016-2021)
8.4.2 Asia-Pacific Business-to-Business (B2B) E-commerce Market Size by Region (2022-2027)
8.4.3 China
8.4.4 Japan
8.4.5 South Korea
8.4.6 Southeast Asia
8.4.7 India
8.4.8 Australia
9 Latin America
9.1 Latin America Business-to-Business (B2B) E-commerce Market Size (2016-2027)
9.2 Latin America Business-to-Business (B2B) E-commerce Market Size by Type
9.2.1 Latin America Business-to-Business (B2B) E-commerce Market Size by Type (2016-2021)
9.2.2 Latin America Business-to-Business (B2B) E-commerce Market Size by Type (2022-2027)
9.2.3 Latin America Business-to-Business (B2B) E-commerce Market Size by Type (2016-2027)
9.3 Latin America Business-to-Business (B2B) E-commerce Market Size by Application
9.3.1 Latin America Business-to-Business (B2B) E-commerce Market Size by Application (2016-2021)
9.3.2 Latin America Business-to-Business (B2B) E-commerce Market Size by Application (2022-2027)
9.3.3 Latin America Business-to-Business (B2B) E-commerce Market Size by Application (2016-2027)
9.4 Latin America Business-to-Business (B2B) E-commerce Market Size by Country
9.4.1 Latin America Business-to-Business (B2B) E-commerce Market Size by Country (2016-2021)
9.4.2 Latin America Business-to-Business (B2B) E-commerce Market Size by Country (2022-2027)
9.4.3 Mexico
9.4.4 Brazil
10 Middle East & Africa
10.1 Middle East & Africa Business-to-Business (B2B) E-commerce Market Size (2016-2027)
10.2 Middle East & Africa Business-to-Business (B2B) E-commerce Market Size by Type
10.2.1 Middle East & Africa Business-to-Business (B2B) E-commerce Market Size by Type (2016-2021)
10.2.2 Middle East & Africa Business-to-Business (B2B) E-commerce Market Size by Type (2022-2027)
10.2.3 Middle East & Africa Business-to-Business (B2B) E-commerce Market Size by Type (2016-2027)
10.3 Middle East & Africa Business-to-Business (B2B) E-commerce Market Size by Application
10.3.1 Middle East & Africa Business-to-Business (B2B) E-commerce Market Size by Application (2016-2021)
10.3.2 Middle East & Africa Business-to-Business (B2B) E-commerce Market Size by Application (2022-2027)
10.3.3 Middle East & Africa Business-to-Business (B2B) E-commerce Market Size by Application (2016-2027)
10.4 Middle East & Africa Business-to-Business (B2B) E-commerce Market Size by Country
10.4.1 Middle East & Africa Business-to-Business (B2B) E-commerce Market Size by Country (2016-2021)
10.4.2 Middle East & Africa Business-to-Business (B2B) E-commerce Market Size by Country (2022-2027)
10.4.3 Turkey
10.4.4 Saudi Arabia
10.4.5 UAE
11 Key Players Profiles
11.1 Amazon
11.1.1 Amazon Company Details
11.1.2 Amazon Business Overview
11.1.3 Amazon Business-to-Business (B2B) E-commerce Introduction
11.1.4 Amazon Revenue in Business-to-Business (B2B) E-commerce Business (2016-2021)
11.1.5 Amazon Recent Development
11.2 Alibaba
11.2.1 Alibaba Company Details
11.2.2 Alibaba Business Overview
11.2.3 Alibaba Business-to-Business (B2B) E-commerce Introduction
11.2.4 Alibaba Revenue in Business-to-Business (B2B) E-commerce Business (2016-2021)
11.2.5 Alibaba Recent Development
11.3 Rakuten
11.3.1 Rakuten Company Details
11.3.2 Rakuten Business Overview
11.3.3 Rakuten Business-to-Business (B2B) E-commerce Introduction
11.3.4 Rakuten Revenue in Business-to-Business (B2B) E-commerce Business (2016-2021)
11.3.5 Rakuten Recent Development
11.4 IBM
11.4.1 IBM Company Details
11.4.2 IBM Business Overview
11.4.3 IBM Business-to-Business (B2B) E-commerce Introduction
11.4.4 IBM Revenue in Business-to-Business (B2B) E-commerce Business (2016-2021)
11.4.5 IBM Recent Development
11.5 SAP Hybris
11.5.1 SAP Hybris Company Details
11.5.2 SAP Hybris Business Overview
11.5.3 SAP Hybris Business-to-Business (B2B) E-commerce Introduction
11.5.4 SAP Hybris Revenue in Business-to-Business (B2B) E-commerce Business (2016-2021)
11.5.5 SAP Hybris Recent Development
11.6 Oracle
11.6.1 Oracle Company Details
11.6.2 Oracle Business Overview
11.6.3 Oracle Business-to-Business (B2B) E-commerce Introduction
11.6.4 Oracle Revenue in Business-to-Business (B2B) E-commerce Business (2016-2021)
11.6.5 Oracle Recent Development
11.7 IndiaMART
11.7.1 IndiaMART Company Details
11.7.2 IndiaMART Business Overview
11.7.3 IndiaMART Business-to-Business (B2B) E-commerce Introduction
11.7.4 IndiaMART Revenue in Business-to-Business (B2B) E-commerce Business (2016-2021)
11.7.5 IndiaMART Recent Development
11.8 Walmart
11.8.1 Walmart Company Details
11.8.2 Walmart Business Overview
11.8.3 Walmart Business-to-Business (B2B) E-commerce Introduction
11.8.4 Walmart Revenue in Business-to-Business (B2B) E-commerce Business (2016-2021)
11.8.5 Walmart Recent Development
11.9 Mercateo
11.9.1 Mercateo Company Details
11.9.2 Mercateo Business Overview
11.9.3 Mercateo Business-to-Business (B2B) E-commerce Introduction
11.9.4 Mercateo Revenue in Business-to-Business (B2B) E-commerce Business (2016-2021)
11.9.5 Mercateo Recent Development
11.10 Magento (Adobe)
11.10.1 Magento (Adobe) Company Details
11.10.2 Magento (Adobe) Business Overview
11.10.3 Magento (Adobe) Business-to-Business (B2B) E-commerce Introduction
11.10.4 Magento (Adobe) Revenue in Business-to-Business (B2B) E-commerce Business (2016-2021)
11.10.5 Magento (Adobe) Recent Development
11.11 Global Sources
11.11.1 Global Sources Company Details
11.11.2 Global Sources Business Overview
11.11.3 Global Sources Business-to-Business (B2B) E-commerce Introduction
11.11.4 Global Sources Revenue in Business-to-Business (B2B) E-commerce Business (2016-2021)
11.11.5 Global Sources Recent Development
11.12 NetSuite
11.12.1 NetSuite Company Details
11.12.2 NetSuite Business Overview
11.12.3 NetSuite Business-to-Business (B2B) E-commerce Introduction
11.12.4 NetSuite Revenue in Business-to-Business (B2B) E-commerce Business (2016-2021)
11.12.5 NetSuite Recent Development
12 Analyst's Viewpoints/Conclusions
13 Appendix
13.1 Research Methodology
13.1.1 Methodology/Research Approach
13.1.2 Data Source
13.2 Disclaimer
13.3 Author Details
List of Tables
    Table 1. Global Business-to-Business (B2B) E-commerce Market Size Growth Rate by Type (US$ Million):2016 VS 2021 VS 2027
    Table 2. Key Players of Buyer-oriented E-commerce
    Table 3. Key Players of Supplier-oriented E-commerce
    Table 4. Key Players of Intermediary-oriented E-commerce
    Table 5. Global Business-to-Business (B2B) E-commerce Market Size Growth by Application (US$ Million): 2016 VS 2021 VS 2027
    Table 6. Global Business-to-Business (B2B) E-commerce Market Size by Regions (US$ Million): 2016 VS 2021 VS 2027
    Table 7. Global Business-to-Business (B2B) E-commerce Market Size by Regions (2016-2021) & (US$ Million)
    Table 8. Global Business-to-Business (B2B) E-commerce Market Share by Regions (2016-2021)
    Table 9. Global Business-to-Business (B2B) E-commerce Forecasted Market Size by Regions (2022-2027) & (US$ Million)
    Table 10. Global Business-to-Business (B2B) E-commerce Market Share by Regions (2022-2027)
    Table 11. Business-to-Business (B2B) E-commerce Market Trends
    Table 12. Business-to-Business (B2B) E-commerce Market Drivers
    Table 13. Business-to-Business (B2B) E-commerce Market Challenges
    Table 14. Business-to-Business (B2B) E-commerce Market Restraints
    Table 15. Global Business-to-Business (B2B) E-commerce Revenue by Players (2016-2021) & (US$ Million)
    Table 16. Global Business-to-Business (B2B) E-commerce Market Share by Players (2016-2021)
    Table 17. Global Top Business-to-Business (B2B) E-commerce Players by Company Type (Tier 1, Tier 2 and Tier 3) (based on the Revenue in Business-to-Business (B2B) E-commerce as of 2020)
    Table 18. Ranking of Global Top Business-to-Business (B2B) E-commerce Companies by Revenue (US$ Million) in 2020
    Table 19. Global 5 Largest Players Market Share by Business-to-Business (B2B) E-commerce Revenue (CR5 and HHI) & (2016-2021)
    Table 20. Key Players Headquarters and Area Served
    Table 21. Key Players Business-to-Business (B2B) E-commerce Product Solution and Service
    Table 22. Date of Enter into Business-to-Business (B2B) E-commerce Market
    Table 23. Mergers & Acquisitions, Expansion Plans
    Table 24. Global Business-to-Business (B2B) E-commerce Market Size by Type (2016-2021) (US$ Million)
    Table 25. Global Business-to-Business (B2B) E-commerce Revenue Market Share by Type (2016-2021)
    Table 26. Global Business-to-Business (B2B) E-commerce Forecasted Market Size by Type (2022-2027) (US$ Million)
    Table 27. Global Business-to-Business (B2B) E-commerce Revenue Market Share by Type (2022-2027) & (US$ Million)
    Table 28. Global Business-to-Business (B2B) E-commerce Market Size Share by Application (2016-2021) & (US$ Million)
    Table 29. Global Business-to-Business (B2B) E-commerce Revenue Market Share by Application (2016-2021)
    Table 30. Global Business-to-Business (B2B) E-commerce Forecasted Market Size by Application (2022-2027) (US$ Million)
    Table 31. Global Business-to-Business (B2B) E-commerce Revenue Market Share by Application (2022-2027) & (US$ Million)
    Table 32. North America Business-to-Business (B2B) E-commerce Market Size by Type (2016-2021) (US$ Million)
    Table 33. North America Business-to-Business (B2B) E-commerce Market Size by Type (2022-2027) & (US$ Million)
    Table 34. North America Business-to-Business (B2B) E-commerce Market Size by Application (2016-2021) (US$ Million)
    Table 35. North America Business-to-Business (B2B) E-commerce Market Size by Application (2022-2027) & (US$ Million)
    Table 36. North America Business-to-Business (B2B) E-commerce Market Size by Country (2016-2021) & (US$ Million)
    Table 37. North America Business-to-Business (B2B) E-commerce Market Size by Country (2022-2027) & (US$ Million)
    Table 38. Europe Business-to-Business (B2B) E-commerce Market Size by Type (2016-2021) (US$ Million)
    Table 39. Europe Business-to-Business (B2B) E-commerce Market Size by Type (2022-2027) & (US$ Million)
    Table 40. Europe Business-to-Business (B2B) E-commerce Market Size by Application (2016-2021) (US$ Million)
    Table 41. Europe Business-to-Business (B2B) E-commerce Market Size by Application (2022-2027) & (US$ Million)
    Table 42. Europe Business-to-Business (B2B) E-commerce Market Size by Country (2016-2021) & (US$ Million)
    Table 43. Europe Business-to-Business (B2B) E-commerce Market Size by Country (2022-2027) & (US$ Million)
    Table 44. Asia-Pacific Business-to-Business (B2B) E-commerce Market Size by Type (2016-2021) (US$ Million)
    Table 45. Asia-Pacific Business-to-Business (B2B) E-commerce Market Size by Type (2022-2027) & (US$ Million)
    Table 46. Asia-Pacific Business-to-Business (B2B) E-commerce Market Size by Application (2016-2021) (US$ Million)
    Table 47. Asia-Pacific Business-to-Business (B2B) E-commerce Market Size by Application (2022-2027) & (US$ Million)
    Table 48. Asia-Pacific Business-to-Business (B2B) E-commerce Market Size by Region (2016-2021) & (US$ Million)
    Table 49. Asia-Pacific Business-to-Business (B2B) E-commerce Market Size by Region (2022-2027) & (US$ Million)
    Table 50. Latin America Business-to-Business (B2B) E-commerce Market Size by Type (2016-2021) (US$ Million)
    Table 51. Latin America Business-to-Business (B2B) E-commerce Market Size by Type (2022-2027) & (US$ Million)
    Table 52. Latin America Business-to-Business (B2B) E-commerce Market Size by Application (2016-2021) (US$ Million)
    Table 53. Latin America Business-to-Business (B2B) E-commerce Market Size by Application (2022-2027) & (US$ Million)
    Table 54. Latin America Business-to-Business (B2B) E-commerce Market Size by Country (2016-2021) & (US$ Million)
    Table 55. Latin America Business-to-Business (B2B) E-commerce Market Size by Country (2022-2027) & (US$ Million)
    Table 56. Middle East & Africa Business-to-Business (B2B) E-commerce Market Size by Type (2016-2021) (US$ Million)
    Table 57. Middle East & Africa Business-to-Business (B2B) E-commerce Market Size by Type (2022-2027) & (US$ Million)
    Table 58. Middle East & Africa Business-to-Business (B2B) E-commerce Market Size by Application (2016-2021) (US$ Million)
    Table 59. Middle East & Africa Business-to-Business (B2B) E-commerce Market Size by Application (2022-2027) & (US$ Million)
    Table 60. Middle East & Africa Business-to-Business (B2B) E-commerce Market Size by Country (2016-2021) & (US$ Million)
    Table 61. Middle East & Africa Business-to-Business (B2B) E-commerce Market Size by Country (2022-2027) & (US$ Million)
    Table 62. Amazon Company Details
    Table 63. Amazon Business Overview
    Table 64. Amazon Business-to-Business (B2B) E-commerce Product
    Table 65. Amazon Revenue in Business-to-Business (B2B) E-commerce Business (2016-2021) & (US$ Million)
    Table 66. Amazon Recent Development
    Table 67. Alibaba Company Details
    Table 68. Alibaba Business Overview
    Table 69. Alibaba Business-to-Business (B2B) E-commerce Product
    Table 70. Alibaba Revenue in Business-to-Business (B2B) E-commerce Business (2016-2021) & (US$ Million)
    Table 71. Alibaba Recent Development
    Table 72. Rakuten Company Details
    Table 73. Rakuten Business Overview
    Table 74. Rakuten Business-to-Business (B2B) E-commerce Product
    Table 75. Rakuten Revenue in Business-to-Business (B2B) E-commerce Business (2016-2021) & (US$ Million)
    Table 76. Rakuten Recent Development
    Table 77. IBM Company Details
    Table 78. IBM Business Overview
    Table 79. IBM Business-to-Business (B2B) E-commerce Product
    Table 80. IBM Revenue in Business-to-Business (B2B) E-commerce Business (2016-2021) & (US$ Million)
    Table 81. IBM Recent Development
    Table 82. SAP Hybris Company Details
    Table 83. SAP Hybris Business Overview
    Table 84. SAP Hybris Business-to-Business (B2B) E-commerce Product
    Table 85. SAP Hybris Revenue in Business-to-Business (B2B) E-commerce Business (2016-2021) & (US$ Million)
    Table 86. SAP Hybris Recent Development
    Table 87. Oracle Company Details
    Table 88. Oracle Business Overview
    Table 89. Oracle Business-to-Business (B2B) E-commerce Product
    Table 90. Oracle Revenue in Business-to-Business (B2B) E-commerce Business (2016-2021) & (US$ Million)
    Table 91. Oracle Recent Development
    Table 92. IndiaMART Company Details
    Table 93. IndiaMART Business Overview
    Table 94. IndiaMART Business-to-Business (B2B) E-commerce Product
    Table 95. IndiaMART Revenue in Business-to-Business (B2B) E-commerce Business (2016-2021) & (US$ Million)
    Table 96. IndiaMART Recent Development
    Table 97. Walmart Company Details
    Table 98. Walmart Business Overview
    Table 99. Walmart Revenue in Business-to-Business (B2B) E-commerce Business (2016-2021) & (US$ Million)
    Table 100. Walmart Recent Development
    Table 101. Mercateo Company Details
    Table 102. Mercateo Business Overview
    Table 103. Mercateo Business-to-Business (B2B) E-commerce Product
    Table 104. Mercateo Revenue in Business-to-Business (B2B) E-commerce Business (2016-2021) & (US$ Million)
    Table 105. Mercateo Recent Development
    Table 106. Magento (Adobe) Company Details
    Table 107. Magento (Adobe) Business Overview
    Table 108. Magento (Adobe) Business-to-Business (B2B) E-commerce Product
    Table 109. Magento (Adobe) Revenue in Business-to-Business (B2B) E-commerce Business (2016-2021) & (US$ Million)
    Table 110. Magento (Adobe) Recent Development
    Table 111. Global Sources Company Details
    Table 112. Global Sources Business Overview
    Table 113. Global Sources Business-to-Business (B2B) E-commerce Product
    Table 114. Global Sources Revenue in Business-to-Business (B2B) E-commerce Business (2016-2021) & (US$ Million)
    Table 115. Global Sources Recent Development
    Table 116. NetSuite Company Details
    Table 117. NetSuite Business Overview
    Table 118. NetSuite Business-to-Business (B2B) E-commerce Product
    Table 119. NetSuite Revenue in Business-to-Business (B2B) E-commerce Business (2016-2021) & (US$ Million)
    Table 120. NetSuite Recent Development
    Table 121. Research Programs/Design for This Report
    Table 122. Key Data Information from Secondary Sources
    Table 123. Key Data Information from Primary Sources
List of Figures
    Figure 1. Global Business-to-Business (B2B) E-commerce Market Share by Type: 2020 VS 2027
    Figure 2. Buyer-oriented E-commerce Features
    Figure 3. Supplier-oriented E-commerce Features
    Figure 4. Intermediary-oriented E-commerce Features
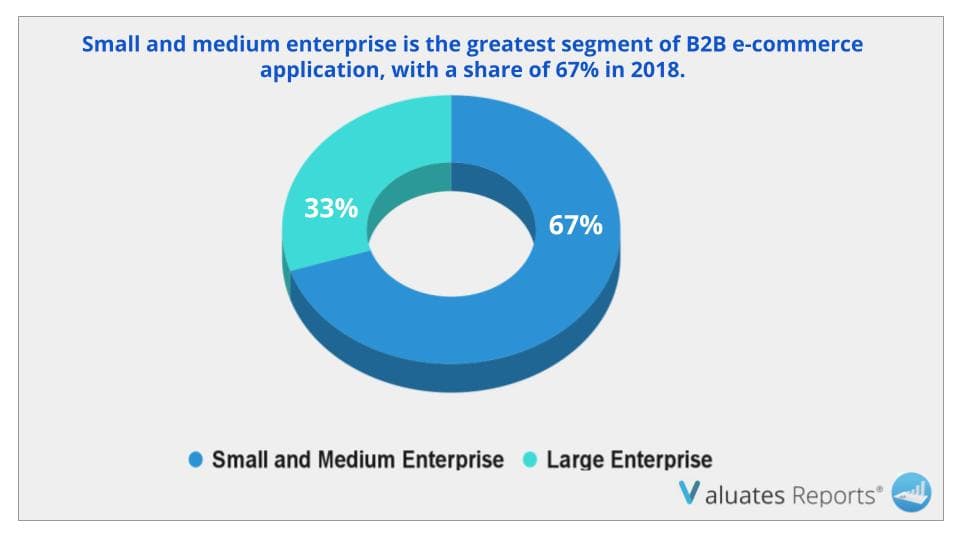
    Figure 5. Global Business-to-Business (B2B) E-commerce Market Share by Application: 2020 VS 2027
    Figure 6. Small and Medium Enterprise Case Studies
    Figure 7. Large Enterprise Case Studies
    Figure 8. Business-to-Business (B2B) E-commerce Report Years Considered
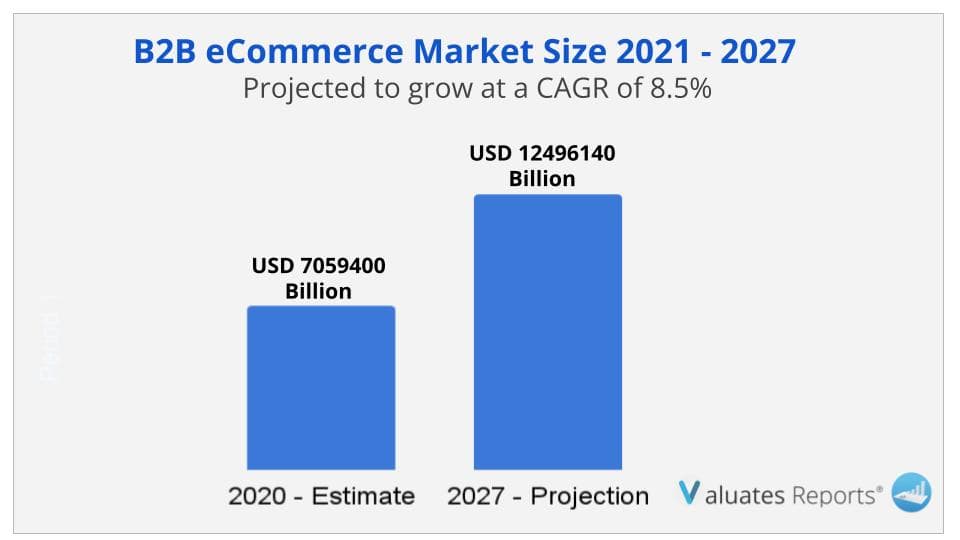
    Figure 9. Global Business-to-Business (B2B) E-commerce Market Size (US$ Million), Year-over-Year: 2016-2027
    Figure 10. Global Business-to-Business (B2B) E-commerce Market Size (US$ Million), 2016 VS 2021 VS 2027
    Figure 11. Global Business-to-Business (B2B) E-commerce Market Share by Regions: 2020 VS 2027
    Figure 12. Global Business-to-Business (B2B) E-commerce Market Share by Regions (2022-2027)
    Figure 13. Global Business-to-Business (B2B) E-commerce Market Share by Players in 2020
    Figure 14. Global Top Business-to-Business (B2B) E-commerce Players by Company Type (Tier 1, Tier 2 and Tier 3) (based on the Revenue in Business-to-Business (B2B) E-commerce as of 2020
    Figure 15. The Top 10 and 5 Players Market Share by Business-to-Business (B2B) E-commerce Revenue in 2020
    Figure 16. Global Business-to-Business (B2B) E-commerce Revenue Market Share by Type (2016-2021)
    Figure 17. Global Business-to-Business (B2B) E-commerce Revenue Market Share by Type (2022-2027)
    Figure 18. North America Business-to-Business (B2B) E-commerce Market Size YoY Growth (2016-2027) & (US$ Million)
    Figure 19. North America Business-to-Business (B2B) E-commerce Market Share by Type (2016-2027)
    Figure 20. North America Business-to-Business (B2B) E-commerce Market Share by Application (2016-2027)
    Figure 21. North America Business-to-Business (B2B) E-commerce Market Share by Country (2016-2027)
    Figure 22. United States Business-to-Business (B2B) E-commerce Market Size YoY Growth (2016-2027) & (US$ Million)
    Figure 23. Canada Business-to-Business (B2B) E-commerce Market Size YoY Growth (2016-2027) & (US$ Million)
    Figure 24. Europe Business-to-Business (B2B) E-commerce Market Size YoY Growth (2016-2027) & (US$ Million)
    Figure 25. Europe Business-to-Business (B2B) E-commerce Market Share by Type (2016-2027)
    Figure 26. Europe Business-to-Business (B2B) E-commerce Market Share by Application (2016-2027)
    Figure 27. Europe Business-to-Business (B2B) E-commerce Market Share by Country (2016-2027)
    Figure 28. Germany Business-to-Business (B2B) E-commerce Market Size YoY Growth (2016-2027) & (US$ Million)
    Figure 29. France Business-to-Business (B2B) E-commerce Market Size YoY Growth (2016-2027) & (US$ Million)
    Figure 30. U.K. Business-to-Business (B2B) E-commerce Market Size YoY Growth (2016-2027) & (US$ Million)
    Figure 31. Italy Business-to-Business (B2B) E-commerce Market Size YoY Growth (2016-2027) & (US$ Million)
    Figure 32. Russia Business-to-Business (B2B) E-commerce Market Size YoY Growth (2016-2027) & (US$ Million)
    Figure 33. Nordic Business-to-Business (B2B) E-commerce Market Size YoY Growth (2016-2027) & (US$ Million)
    Figure 34. Asia-Pacific Business-to-Business (B2B) E-commerce Market Size YoY Growth (2016-2027) & (US$ Million)
    Figure 35. Asia-Pacific Business-to-Business (B2B) E-commerce Market Share by Type (2016-2027)
    Figure 36. Asia-Pacific Business-to-Business (B2B) E-commerce Market Share by Application (2016-2027)
    Figure 37. Asia-Pacific Business-to-Business (B2B) E-commerce Market Share by Region (2016-2027)
    Figure 38. China Business-to-Business (B2B) E-commerce Market Size YoY Growth (2016-2027) & (US$ Million)
    Figure 39. Japan Business-to-Business (B2B) E-commerce Market Size YoY Growth (2016-2027) & (US$ Million)
    Figure 40. South Korea Business-to-Business (B2B) E-commerce Market Size YoY Growth (2016-2027) & (US$ Million)
    Figure 41. Southeast Asia Business-to-Business (B2B) E-commerce Market Size YoY Growth (2016-2027) & (US$ Million)
    Figure 42. India Business-to-Business (B2B) E-commerce Market Size YoY Growth (2016-2027) & (US$ Million)
    Figure 43. Australia Business-to-Business (B2B) E-commerce Market Size YoY Growth (2016-2027) & (US$ Million)
    Figure 44. Latin America Business-to-Business (B2B) E-commerce Market Size YoY Growth (2016-2027) & (US$ Million)
    Figure 45. Latin America Business-to-Business (B2B) E-commerce Market Share by Type (2016-2027)
    Figure 46. Latin America Business-to-Business (B2B) E-commerce Market Share by Application (2016-2027)
    Figure 47. Latin America Business-to-Business (B2B) E-commerce Market Share by Country (2016-2027)
    Figure 48. Mexico Business-to-Business (B2B) E-commerce Market Size YoY Growth (2016-2027) & (US$ Million)
    Figure 49. Brazil Business-to-Business (B2B) E-commerce Market Size YoY Growth (2016-2027) & (US$ Million)
    Figure 50. Middle East & Africa Business-to-Business (B2B) E-commerce Market Size YoY Growth (2016-2027) & (US$ Million)
    Figure 51. Middle East & Africa Business-to-Business (B2B) E-commerce Market Share by Type (2016-2027)
    Figure 52. Middle East & Africa Business-to-Business (B2B) E-commerce Market Share by Application (2016-2027)
    Figure 53. Middle East & Africa Business-to-Business (B2B) E-commerce Market Share by Country (2016-2027)
    Figure 54. Turkey Business-to-Business (B2B) E-commerce Market Size YoY Growth (2016-2027) & (US$ Million)
    Figure 55. Saudi Arabia Business-to-Business (B2B) E-commerce Market Size YoY Growth (2016-2027) & (US$ Million)
    Figure 56. UAE Business-to-Business (B2B) E-commerce Market Size YoY Growth (2016-2027) & (US$ Million)
    Figure 57. Amazon Revenue Growth Rate in Business-to-Business (B2B) E-commerce Business (2016-2021)
    Figure 58. Alibaba Revenue Growth Rate in Business-to-Business (B2B) E-commerce Business (2016-2021)
    Figure 59. Rakuten Revenue Growth Rate in Business-to-Business (B2B) E-commerce Business (2016-2021)
    Figure 60. IBM Revenue Growth Rate in Business-to-Business (B2B) E-commerce Business (2016-2021)
    Figure 61. SAP Hybris Revenue Growth Rate in Business-to-Business (B2B) E-commerce Business (2016-2021)
    Figure 62. Oracle Revenue Growth Rate in Business-to-Business (B2B) E-commerce Business (2016-2021)
    Figure 63. IndiaMART Revenue Growth Rate in Business-to-Business (B2B) E-commerce Business (2016-2021)
    Figure 64. Walmart Revenue Growth Rate in Business-to-Business (B2B) E-commerce Business (2016-2021)
    Figure 65. Mercateo Revenue Growth Rate in Business-to-Business (B2B) E-commerce Business (2016-2021)
    Figure 66. Magento (Adobe) Revenue Growth Rate in Business-to-Business (B2B) E-commerce Business (2016-2021)
    Figure 67. Global Sources Revenue Growth Rate in Business-to-Business (B2B) E-commerce Business (2016-2021)
    Figure 68. NetSuite Revenue Growth Rate in Business-to-Business (B2B) E-commerce Business (2016-2021)
    Figure 69. Bottom-up and Top-down Approaches for This Report
    Figure 70. Data Triangulation
    Figure 71. Key Executives Interviewed
SELECT A FORMAT
Added to Cart
Electronic (PDF)

$3900

This license allows only one user to access the PDF.
Electronic (PDF)

$5850

This license allows 1 - 5 user to access the PDF, license is suitable for small groups of 5 users working together
Electronic (PDF)

$7800

This license allows users/teams in a same Enterprise to use this report, various departments within an enterpise can use this report
Add to Cart
Buy Now (10% Discount)
OUR CUSTOMER
Novocure