List of Tables
Table 1. Global Synthetic Rubber Market Value by Type (US$ Million), 2025 vs 2032
Table 2. Global Synthetic Rubber Market Value by Application (US$ Million), 2025 vs 2032
Table 3. Global Synthetic Rubber Production Capacity (K MT) by Manufacturers in 2025
Table 4. Global Synthetic Rubber Production by Manufacturers (K MT), 2021–2026
Table 5. Global Synthetic Rubber Production Market Share by Manufacturers (2021–2026)
Table 6. Global Synthetic Rubber Production Value by Manufacturers (US$ Million), 2021–2026
Table 7. Global Synthetic Rubber Production Value Share by Manufacturers (2021–2026)
Table 8. Global Key Players of Synthetic Rubber, Industry Ranking, 2024 vs 2025
Table 9. Classification of Companies by Tier (Tier 1, Tier 2, Tier 3), based on Synthetic Rubber Production Value, 2025
Table 10. Global Market Synthetic Rubber Average Price by Manufacturers (US$/Ton), 2021–2026
Table 11. Global Key Manufacturers of Synthetic Rubber, Manufacturing Footprints and Headquarters
Table 12. Global Key Manufacturers of Synthetic Rubber, Product Offerings and Applications
Table 13. Global Key Manufacturers of Synthetic Rubber, Date of Entry into the Industry
Table 14. Global Synthetic Rubber Manufacturers Market Concentration Ratio (CR5 and HHI)
Table 15. Mergers & Acquisitions and Expansion Plans
Table 16. Global Synthetic Rubber Production Value by Region: 2021 vs 2025 vs 2032 (US$ Million)
Table 17. Global Synthetic Rubber Production Value (US$ Million) by Region (2021–2026)
Table 18. Global Synthetic Rubber Production Value Market Share by Region (2021–2026)
Table 19. Global Synthetic Rubber Production Value (US$ Million) Forecast by Region (2027–2032)
Table 20. Global Synthetic Rubber Production Value Market Share Forecast by Region (2027–2032)
Table 21. Global Synthetic Rubber Production Comparison by Region: 2021 vs 2025 vs 2032 (K MT)
Table 22. Global Synthetic Rubber Production (K MT) by Region (2021–2026)
Table 23. Global Synthetic Rubber Production Market Share by Region (2021–2026)
Table 24. Global Synthetic Rubber Production (K MT) Forecast by Region (2027–2032)
Table 25. Global Synthetic Rubber Production Market Share Forecast by Region (2027–2032)
Table 26. Global Synthetic Rubber Market Average Price (US$/Ton) by Region (2021–2026)
Table 27. Global Synthetic Rubber Market Average Price (US$/Ton) by Region (2027–2032)
Table 28. Global Synthetic Rubber Consumption Growth Rate by Region: 2021 vs 2025 vs 2032 (K MT)
Table 29. Global Synthetic Rubber Consumption by Region (K MT), 2021–2026
Table 30. Global Synthetic Rubber Consumption Market Share by Region (2021–2026)
Table 31. Global Synthetic Rubber Forecasted Consumption by Region (K MT), 2027–2032
Table 32. Global Synthetic Rubber Forecasted Consumption Market Share by Region (2027–2032)
Table 33. North America Synthetic Rubber Consumption Growth Rate by Country: 2021 vs 2025 vs 2032 (K MT)
Table 34. North America Synthetic Rubber Consumption by Country (K MT), 2021–2026
Table 35. North America Synthetic Rubber Consumption by Country (K MT), 2027–2032
Table 36. Europe Synthetic Rubber Consumption Growth Rate by Country: 2021 vs 2025 vs 2032 (K MT)
Table 37. Europe Synthetic Rubber Consumption by Country (K MT), 2021–2026
Table 38. Europe Synthetic Rubber Consumption by Country (K MT), 2027–2032
Table 39. Asia Pacific Synthetic Rubber Consumption Growth Rate by Region: 2021 vs 2025 vs 2032 (K MT)
Table 40. Asia Pacific Synthetic Rubber Consumption by Region (K MT), 2021–2026
Table 41. Asia Pacific Synthetic Rubber Consumption by Region (K MT), 2027–2032
Table 42. Latin America, Middle East & Africa Synthetic Rubber Consumption Growth Rate by Country: 2021 vs 2025 vs 2032 (K MT)
Table 43. Latin America, Middle East & Africa Synthetic Rubber Consumption by Country (K MT), 2021–2026
Table 44. Latin America, Middle East & Africa Synthetic Rubber Consumption by Country (K MT), 2027–2032
Table 45. Global Synthetic Rubber Production (K MT) by Type (2021–2026)
Table 46. Global Synthetic Rubber Production (K MT) by Type (2027–2032)
Table 47. Global Synthetic Rubber Production Market Share by Type (2021–2026)
Table 48. Global Synthetic Rubber Production Market Share by Type (2027–2032)
Table 49. Global Synthetic Rubber Production Value (US$ Million) by Type (2021–2026)
Table 50. Global Synthetic Rubber Production Value (US$ Million) by Type (2027–2032)
Table 51. Global Synthetic Rubber Production Value Market Share by Type (2021–2026)
Table 52. Global Synthetic Rubber Production Value Market Share by Type (2027–2032)
Table 53. Global Synthetic Rubber Price (US$/Ton) by Type (2021–2026)
Table 54. Global Synthetic Rubber Price (US$/Ton) by Type (2027–2032)
Table 55. Global Synthetic Rubber Production (K MT) by Application (2021–2026)
Table 56. Global Synthetic Rubber Production (K MT) by Application (2027–2032)
Table 57. Global Synthetic Rubber Production Market Share by Application (2021–2026)
Table 58. Global Synthetic Rubber Production Market Share by Application (2027–2032)
Table 59. Global Synthetic Rubber Production Value (US$ Million) by Application (2021–2026)
Table 60. Global Synthetic Rubber Production Value (US$ Million) by Application (2027–2032)
Table 61. Global Synthetic Rubber Production Value Market Share by Application (2021–2026)
Table 62. Global Synthetic Rubber Production Value Market Share by Application (2027–2032)
Table 63. Global Synthetic Rubber Price (US$/Ton) by Application (2021–2026)
Table 64. Global Synthetic Rubber Price (US$/Ton) by Application (2027–2032)
Table 65. Arlanxeo Synthetic Rubber Company Information
Table 66. Arlanxeo Synthetic Rubber Specification and Application
Table 67. Arlanxeo Synthetic Rubber Production (K MT), Value (US$ Million), Price (US$/Ton) and Gross Margin (2021–2026)
Table 68. Arlanxeo Main Business and Markets Served
Table 69. Arlanxeo Recent Developments/Updates
Table 70. Sinopec Synthetic Rubber Company Information
Table 71. Sinopec Synthetic Rubber Specification and Application
Table 72. Sinopec Synthetic Rubber Production (K MT), Value (US$ Million), Price (US$/Ton) and Gross Margin (2021–2026)
Table 73. Sinopec Main Business and Markets Served
Table 74. Sinopec Recent Developments/Updates
Table 75. Kumho Petrochemical Synthetic Rubber Company Information
Table 76. Kumho Petrochemical Synthetic Rubber Specification and Application
Table 77. Kumho Petrochemical Synthetic Rubber Production (K MT), Value (US$ Million), Price (US$/Ton) and Gross Margin (2021–2026)
Table 78. Kumho Petrochemical Main Business and Markets Served
Table 79. Kumho Petrochemical Recent Developments/Updates
Table 80. CNPC Synthetic Rubber Company Information
Table 81. CNPC Synthetic Rubber Specification and Application
Table 82. CNPC Synthetic Rubber Production (K MT), Value (US$ Million), Price (US$/Ton) and Gross Margin (2021–2026)
Table 83. CNPC Main Business and Markets Served
Table 84. CNPC Recent Developments/Updates
Table 85. TSRC Synthetic Rubber Company Information
Table 86. TSRC Synthetic Rubber Specification and Application
Table 87. TSRC Synthetic Rubber Production (K MT), Value (US$ Million), Price (US$/Ton) and Gross Margin (2021–2026)
Table 88. TSRC Main Business and Markets Served
Table 89. TSRC Recent Developments/Updates
Table 90. ExxonMobil Synthetic Rubber Company Information
Table 91. ExxonMobil Synthetic Rubber Specification and Application
Table 92. ExxonMobil Synthetic Rubber Production (K MT), Value (US$ Million), Price (US$/Ton) and Gross Margin (2021–2026)
Table 93. ExxonMobil Main Business and Markets Served
Table 94. ExxonMobil Recent Developments/Updates
Table 95. Goodyear Synthetic Rubber Company Information
Table 96. Goodyear Synthetic Rubber Specification and Application
Table 97. Goodyear Synthetic Rubber Production (K MT), Value (US$ Million), Price (US$/Ton) and Gross Margin (2021–2026)
Table 98. Goodyear Main Business and Markets Served
Table 99. Goodyear Recent Developments/Updates
Table 100. NKNK Synthetic Rubber Company Information
Table 101. NKNK Synthetic Rubber Specification and Application
Table 102. NKNK Synthetic Rubber Production (K MT), Value (US$ Million), Price (US$/Ton) and Gross Margin (2021–2026)
Table 103. NKNK Main Business and Markets Served
Table 104. NKNK Recent Developments/Updates
Table 105. JSR Synthetic Rubber Company Information
Table 106. JSR Synthetic Rubber Specification and Application
Table 107. JSR Synthetic Rubber Production (K MT), Value (US$ Million), Price (US$/Ton) and Gross Margin (2021–2026)
Table 108. JSR Main Business and Markets Served
Table 109. JSR Recent Developments/Updates
Table 110. Sibur Synthetic Rubber Company Information
Table 111. Sibur Synthetic Rubber Specification and Application
Table 112. Sibur Synthetic Rubber Production (K MT), Value (US$ Million), Price (US$/Ton) and Gross Margin (2021–2026)
Table 113. Sibur Main Business and Markets Served
Table 114. Sibur Recent Developments/Updates
Table 115. LG Chem Synthetic Rubber Company Information
Table 116. LG Chem Synthetic Rubber Specification and Application
Table 117. LG Chem Synthetic Rubber Production (K MT), Value (US$ Million), Price (US$/Ton) and Gross Margin (2021–2026)
Table 118. LG Chem Main Business and Markets Served
Table 119. LG Chem Recent Developments/Updates
Table 120. Versalis Synthetic Rubber Company Information
Table 121. Versalis Synthetic Rubber Specification and Application
Table 122. Versalis Synthetic Rubber Production (K MT), Value (US$ Million), Price (US$/Ton) and Gross Margin (2021–2026)
Table 123. Versalis Main Business and Markets Served
Table 124. Versalis Recent Developments/Updates
Table 125. LCY Synthetic Rubber Company Information
Table 126. LCY Synthetic Rubber Specification and Application
Table 127. LCY Synthetic Rubber Production (K MT), Value (US$ Million), Price (US$/Ton) and Gross Margin (2021–2026)
Table 128. LCY Main Business and Markets Served
Table 129. LCY Recent Developments/Updates
Table 130. Kraton Synthetic Rubber Company Information
Table 131. Kraton Synthetic Rubber Specification and Application
Table 132. Kraton Synthetic Rubber Production (K MT), Value (US$ Million), Price (US$/Ton) and Gross Margin (2021–2026)
Table 133. Kraton Main Business and Markets Served
Table 134. Kraton Recent Developments/Updates
Table 135. Zeon Synthetic Rubber Company Information
Table 136. Zeon Synthetic Rubber Specification and Application
Table 137. Zeon Synthetic Rubber Production (K MT), Value (US$ Million), Price (US$/Ton) and Gross Margin (2021–2026)
Table 138. Zeon Main Business and Markets Served
Table 139. Zeon Recent Developments/Updates
Table 140. Dynasol Synthetic Rubber Company Information
Table 141. Dynasol Synthetic Rubber Specification and Application
Table 142. Dynasol Synthetic Rubber Production (K MT), Value (US$ Million), Price (US$/Ton) and Gross Margin (2021–2026)
Table 143. Dynasol Main Business and Markets Served
Table 144. Dynasol Recent Developments/Updates
Table 145. Asahi Kasei Synthetic Rubber Company Information
Table 146. Asahi Kasei Synthetic Rubber Specification and Application
Table 147. Asahi Kasei Synthetic Rubber Production (K MT), Value (US$ Million), Price (US$/Ton) and Gross Margin (2021–2026)
Table 148. Asahi Kasei Main Business and Markets Served
Table 149. Asahi Kasei Recent Developments/Updates
Table 150. JSR Corporation Synthetic Rubber Company Information
Table 151. JSR Corporation Synthetic Rubber Specification and Application
Table 152. JSR Corporation Synthetic Rubber Production (K MT), Value (US$ Million), Price (US$/Ton) and Gross Margin (2021–2026)
Table 153. JSR Corporation Main Business and Markets Served
Table 154. JSR Corporation Recent Developments/Updates
Table 155. Ningbo Changhong Polymer Scientific and Technical Synthetic Rubber Company Information
Table 156. Ningbo Changhong Polymer Scientific and Technical Synthetic Rubber Specification and Application
Table 157. Ningbo Changhong Polymer Scientific and Technical Synthetic Rubber Production (K MT), Value (US$ Million), Price (US$/Ton) and Gross Margin (2021–2026)
Table 158. Ningbo Changhong Polymer Scientific and Technical Main Business and Markets Served
Table 159. Ningbo Changhong Polymer Scientific and Technical Recent Developments/Updates
Table 160. Lubrizol Synthetic Rubber Company Information
Table 161. Lubrizol Synthetic Rubber Specification and Application
Table 162. Lubrizol Synthetic Rubber Production (K MT), Value (US$ Million), Price (US$/Ton) and Gross Margin (2021–2026)
Table 163. Lubrizol Main Business and Markets Served
Table 164. Lubrizol Recent Developments/Updates
Table 165. BASF Synthetic Rubber Company Information
Table 166. BASF Synthetic Rubber Specification and Application
Table 167. BASF Synthetic Rubber Production (K MT), Value (US$ Million), Price (US$/Ton) and Gross Margin (2021–2026)
Table 168. BASF Main Business and Markets Served
Table 169. BASF Recent Developments/Updates
Table 170. Covestro Synthetic Rubber Company Information
Table 171. Covestro Synthetic Rubber Specification and Application
Table 172. Covestro Synthetic Rubber Production (K MT), Value (US$ Million), Price (US$/Ton) and Gross Margin (2021–2026)
Table 173. Covestro Main Business and Markets Served
Table 174. Covestro Recent Developments/Updates
Table 175. Wanhua Chemical Synthetic Rubber Company Information
Table 176. Wanhua Chemical Synthetic Rubber Specification and Application
Table 177. Wanhua Chemical Synthetic Rubber Production (K MT), Value (US$ Million), Price (US$/Ton) and Gross Margin (2021–2026)
Table 178. Wanhua Chemical Main Business and Markets Served
Table 179. Wanhua Chemical Recent Developments/Updates
Table 180. Huntsman Synthetic Rubber Company Information
Table 181. Huntsman Synthetic Rubber Specification and Application
Table 182. Huntsman Synthetic Rubber Production (K MT), Value (US$ Million), Price (US$/Ton) and Gross Margin (2021–2026)
Table 183. Huntsman Main Business and Markets Served
Table 184. Huntsman Recent Developments/Updates
Table 185. Trinseo Synthetic Rubber Company Information
Table 186. Trinseo Synthetic Rubber Specification and Application
Table 187. Trinseo Synthetic Rubber Production (K MT), Value (US$ Million), Price (US$/Ton) and Gross Margin (2021–2026)
Table 188. Trinseo Main Business and Markets Served
Table 189. Trinseo Recent Developments/Updates
Table 190. Hexpol Synthetic Rubber Company Information
Table 191. Hexpol Synthetic Rubber Specification and Application
Table 192. Hexpol Synthetic Rubber Production (K MT), Value (US$ Million), Price (US$/Ton) and Gross Margin (2021–2026)
Table 193. Hexpol Main Business and Markets Served
Table 194. Hexpol Recent Developments/Updates
Table 195. Kuraray Synthetic Rubber Company Information
Table 196. Kuraray Synthetic Rubber Specification and Application
Table 197. Kuraray Synthetic Rubber Production (K MT), Value (US$ Million), Price (US$/Ton) and Gross Margin (2021–2026)
Table 198. Kuraray Main Business and Markets Served
Table 199. Kuraray Recent Developments/Updates
Table 200. COIM Group Synthetic Rubber Company Information
Table 201. COIM Group Synthetic Rubber Specification and Application
Table 202. COIM Group Synthetic Rubber Production (K MT), Value (US$ Million), Price (US$/Ton) and Gross Margin (2021–2026)
Table 203. COIM Group Main Business and Markets Served
Table 204. COIM Group Recent Developments/Updates
Table 205. Avient Synthetic Rubber Company Information
Table 206. Avient Synthetic Rubber Specification and Application
Table 207. Avient Synthetic Rubber Production (K MT), Value (US$ Million), Price (US$/Ton) and Gross Margin (2021–2026)
Table 208. Avient Main Business and Markets Served
Table 209. Avient Recent Developments/Updates
Table 210. Epaflex Synthetic Rubber Company Information
Table 211. Epaflex Synthetic Rubber Specification and Application
Table 212. Epaflex Synthetic Rubber Production (K MT), Value (US$ Million), Price (US$/Ton) and Gross Margin (2021–2026)
Table 213. Epaflex Main Business and Markets Served
Table 214. Epaflex Recent Developments/Updates
Table 215. Miracll Chemicals Synthetic Rubber Company Information
Table 216. Miracll Chemicals Synthetic Rubber Specification and Application
Table 217. Miracll Chemicals Synthetic Rubber Production (K MT), Value (US$ Million), Price (US$/Ton) and Gross Margin (2021–2026)
Table 218. Miracll Chemicals Main Business and Markets Served
Table 219. Miracll Chemicals Recent Developments/Updates
Table 220. Huafeng Synthetic Rubber Company Information
Table 221. Huafeng Synthetic Rubber Specification and Application
Table 222. Huafeng Synthetic Rubber Production (K MT), Value (US$ Million), Price (US$/Ton) and Gross Margin (2021–2026)
Table 223. Huafeng Main Business and Markets Served
Table 224. Huafeng Recent Developments/Updates
Table 225. Ningbo Shunze Synthetic Rubber Company Information
Table 226. Ningbo Shunze Synthetic Rubber Specification and Application
Table 227. Ningbo Shunze Synthetic Rubber Production (K MT), Value (US$ Million), Price (US$/Ton) and Gross Margin (2021–2026)
Table 228. Ningbo Shunze Main Business and Markets Served
Table 229. Ningbo Shunze Recent Developments/Updates
Table 230. Nandi Chemical Synthetic Rubber Company Information
Table 231. Nandi Chemical Synthetic Rubber Specification and Application
Table 232. Nandi Chemical Synthetic Rubber Production (K MT), Value (US$ Million), Price (US$/Ton) and Gross Margin (2021–2026)
Table 233. Nandi Chemical Main Business and Markets Served
Table 234. Nandi Chemical Recent Developments/Updates
Table 235. Key Raw Materials Lists
Table 236. Raw Materials Key Suppliers Lists
Table 237. Synthetic Rubber Distributors List
Table 238. Synthetic Rubber Customers List
Table 239. Synthetic Rubber Market Trends
Table 240. Synthetic Rubber Market Drivers
Table 241. Synthetic Rubber Market Challenges
Table 242. Synthetic Rubber Market Restraints
Table 243. Research Programs/Design for This Report
Table 244. Key Data Information from Secondary Sources
Table 245. Key Data Information from Primary Sources
Table 246. Authors List of This Report
List of Figures
Figure 1. Product Picture of Synthetic Rubber
Figure 2. Global Synthetic Rubber Market Value by Type (US$ Million), 2021–2032
Figure 3. Global Synthetic Rubber Market Share by Type: 2025 vs 2032
Figure 4. Styrene Butadiene Rubber (SBR) Product Picture
Figure 5. Polybutadiene Rubber (BR) Product Picture
Figure 6. Nitrile Butadiene Rubber (NBR) Product Picture
Figure 7. Butyl Rubber (IIR) Product Picture
Figure 8. Styrenic Block Copolymer (SBC) Product Picture
Figure 9. Ethylene Propylene Diene Monomer (EPDM) Product Picture
Figure 10. Chloroprene Rubber (CR) Product Picture
Figure 11. Thermoplastic Polyurethane (TPU) Product Picture
Figure 12. Thermoplastic PolyOlefin (TPO) Product Picture
Figure 13. Global Synthetic Rubber Market Value by Application (US$ Million), 2021–2032
Figure 14. Global Synthetic Rubber Market Share by Application: 2025 vs 2032
Figure 15. Automotive
Figure 16. Building & Construction
Figure 17. Consumer Goods
Figure 18. Industrial
Figure 19. Medical
Figure 20. Other
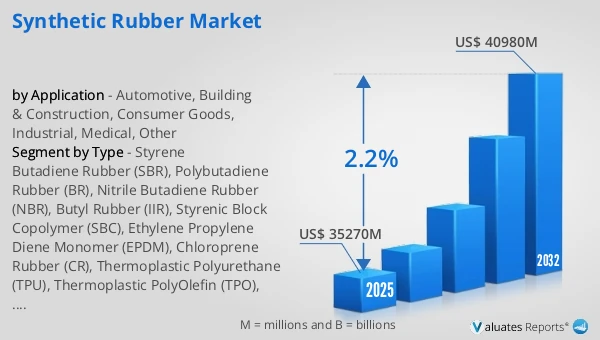
Figure 21. Global Synthetic Rubber Production Value (US$ Million), 2021 vs 2025 vs 2032
Figure 22. Global Synthetic Rubber Production Value (US$ Million), 2021–2032
Figure 23. Global Synthetic Rubber Production Capacity (K MT), 2021–2032
Figure 24. Global Synthetic Rubber Production (K MT), 2021–2032
Figure 25. Global Synthetic Rubber Average Price (US$/Ton), 2021–2032
Figure 26. Synthetic Rubber Report Years Considered
Figure 27. Synthetic Rubber Production Share by Manufacturers in 2025
Figure 28. Global Synthetic Rubber Production Value Share by Manufacturers (2025)
Figure 29. Synthetic Rubber Market Share by Company Type (Tier 1, Tier 2, and Tier 3): 2021 vs 2025
Figure 30. Top 5 and Top 10 Global Players: Market Share by Synthetic Rubber Revenue in 2025
Figure 31. Global Synthetic Rubber Production Value by Region: 2021 vs 2025 vs 2032 (US$ Million)
Figure 32. Global Synthetic Rubber Production Value Market Share by Region: 2021 vs 2025 vs 2032
Figure 33. Global Synthetic Rubber Production Comparison by Region: 2021 vs 2025 vs 2032 (K MT)
Figure 34. Global Synthetic Rubber Production Market Share by Region: 2021 vs 2025 vs 2032
Figure 35. North America Synthetic Rubber Production Value (US$ Million) Growth Rate (2021–2032)
Figure 36. Europe Synthetic Rubber Production Value (US$ Million) Growth Rate (2021–2032)
Figure 37. China Synthetic Rubber Production Value (US$ Million) Growth Rate (2021–2032)
Figure 38. Japan Synthetic Rubber Production Value (US$ Million) Growth Rate (2021–2032)
Figure 39. South Korea Synthetic Rubber Production Value (US$ Million) Growth Rate (2021–2032)
Figure 40. Middle East & Africa Synthetic Rubber Production Value (US$ Million) Growth Rate (2021–2032)
Figure 41. Global Synthetic Rubber Consumption by Region: 2021 vs 2025 vs 2032 (K MT)
Figure 42. Global Synthetic Rubber Consumption Market Share by Region: 2021 vs 2025 vs 2032
Figure 43. North America Synthetic Rubber Consumption and Growth Rate (K MT), 2021–2032
Figure 44. North America Synthetic Rubber Consumption Market Share by Country (2021–2032)
Figure 45. U.S. Synthetic Rubber Consumption and Growth Rate (K MT), 2021–2032
Figure 46. Canada Synthetic Rubber Consumption and Growth Rate (K MT), 2021–2032
Figure 47. Europe Synthetic Rubber Consumption and Growth Rate (K MT), 2021–2032
Figure 48. Europe Synthetic Rubber Consumption Market Share by Country (2021–2032)
Figure 49. Germany Synthetic Rubber Consumption and Growth Rate (K MT), 2021–2032
Figure 50. France Synthetic Rubber Consumption and Growth Rate (K MT), 2021–2032
Figure 51. U.K. Synthetic Rubber Consumption and Growth Rate (K MT), 2021–2032
Figure 52. Italy Synthetic Rubber Consumption and Growth Rate (K MT), 2021–2032
Figure 53. Russia Synthetic Rubber Consumption and Growth Rate (K MT), 2021–2032
Figure 54. Asia Pacific Synthetic Rubber Consumption and Growth Rate (K MT), 2021–2032
Figure 55. Asia Pacific Synthetic Rubber Consumption Market Share by Region (2021–2032)
Figure 56. China Synthetic Rubber Consumption and Growth Rate (K MT), 2021–2032
Figure 57. Japan Synthetic Rubber Consumption and Growth Rate (K MT), 2021–2032
Figure 58. South Korea Synthetic Rubber Consumption and Growth Rate (K MT), 2021–2032
Figure 59. China Taiwan Synthetic Rubber Consumption and Growth Rate (K MT), 2021–2032
Figure 60. Southeast Asia Synthetic Rubber Consumption and Growth Rate (K MT), 2021–2032
Figure 61. India Synthetic Rubber Consumption and Growth Rate (K MT), 2021–2032
Figure 62. Latin America, Middle East & Africa Synthetic Rubber Consumption and Growth Rate (K MT), 2021–2032
Figure 63. Latin America, Middle East & Africa Synthetic Rubber Consumption Market Share by Country (2021–2032)
Figure 64. Mexico Synthetic Rubber Consumption and Growth Rate (K MT), 2021–2032
Figure 65. Brazil Synthetic Rubber Consumption and Growth Rate (K MT), 2021–2032
Figure 66. Turkey Synthetic Rubber Consumption and Growth Rate (K MT), 2021–2032
Figure 67. GCC Countries Synthetic Rubber Consumption and Growth Rate (K MT), 2021–2032
Figure 68. Global Production Market Share of Synthetic Rubber by Type (2021–2032)
Figure 69. Global Production Value Market Share of Synthetic Rubber by Type (2021–2032)
Figure 70. Global Synthetic Rubber Price (US$/Ton) by Type (2021–2032)
Figure 71. Global Production Market Share of Synthetic Rubber by Application (2021–2032)
Figure 72. Global Production Value Market Share of Synthetic Rubber by Application (2021–2032)
Figure 73. Global Synthetic Rubber Price (US$/Ton) by Application (2021–2032)
Figure 74. Synthetic Rubber Value Chain
Figure 75. Channels of Distribution (Direct Vs Distribution)
Figure 76. Bottom-up and Top-down Approaches for This Report
Figure 77. Data Triangulation