List of Tables
Table 1. Global Remote Access Tools Market Size Growth Rate by Type (US$ Million): 2021 vs 2025 vs 2032
Table 2. Key Players of On Premises
Table 3. Key Players of Cloud-based
Table 4. Global Remote Access Tools Market Size Growth Rate by Device Management Scope (US$ Million): 2021 vs 2025 vs 2032
Table 5. Key Players of Single Device Control
Table 6. Key Players of Endpoint Fleet Managed
Table 7. Key Players of Helpdesk Queue Managed
Table 8. Key Players of Others
Table 9. Global Remote Access Tools Market Size Growth Rate by Primary Use Scenario (US$ Million): 2021 vs 2025 vs 2032
Table 10. Key Players of IT Remote Support
Table 11. Key Players of Remote Work Access
Table 12. Key Players of Third Party Remote Operations
Table 13. Key Players of Remote Training and Collaboration
Table 14. Key Players of Others
Table 15. Global Remote Access Tools Market Size Growth Rate by Control Method (US$ Million): 2021 vs 2025 vs 2032
Table 16. Key Players of Screen Control
Table 17. Key Players of Remote Desktop Publishing
Table 18. Key Players of Shell and Command Execution
Table 19. Key Players of Others
Table 20. Global Remote Access Tools Market Size Growth by Application (US$ Million): 2021 vs 2025 vs 2032
Table 21. Global Remote Access Tools Market Size by Region (US$ Million): 2021 vs 2025 vs 2032
Table 22. Global Remote Access Tools Market Size by Region (US$ Million), 2021–2026
Table 23. Global Remote Access Tools Market Share by Region (2021–2026)
Table 24. Global Remote Access Tools Forecasted Market Size by Region (US$ Million), 2027–2032
Table 25. Global Remote Access Tools Market Share by Region (2027–2032)
Table 26. Remote Access Tools Market Trends
Table 27. Remote Access Tools Market Drivers
Table 28. Remote Access Tools Market Challenges
Table 29. Remote Access Tools Market Restraints
Table 30. Global Remote Access Tools Revenue by Players (US$ Million), 2021–2026
Table 31. Global Remote Access Tools Market Share by Players (2021–2026)
Table 32. Global Top Remote Access Tools Players by Tier (Tier 1, Tier 2, and Tier 3), based on Remote Access Tools Revenue, 2025
Table 33. Ranking of Global Top Remote Access Tools Companies by Revenue (US$ Million) in 2025
Table 34. Global 5 Largest Players Market Share by Remote Access Tools Revenue (CR5 and HHI), 2021–2026
Table 35. Global Key Players of Remote Access Tools, Headquarters and Area Served
Table 36. Global Key Players of Remote Access Tools, Products and Applications
Table 37. Global Key Players of Remote Access Tools, Date of General Availability (GA)
Table 38. Mergers and Acquisitions, Expansion Plans
Table 39. Global Remote Access Tools Market Size by Type (US$ Million), 2021–2026
Table 40. Global Remote Access Tools Revenue Market Share by Type (2021–2026)
Table 41. Global Remote Access Tools Forecasted Market Size by Type (US$ Million), 2027–2032
Table 42. Global Remote Access Tools Revenue Market Share by Type (2027–2032)
Table 43. Global Remote Access Tools Market Size by Application (US$ Million), 2021–2026
Table 44. Global Remote Access Tools Revenue Market Share by Application (2021–2026)
Table 45. Global Remote Access Tools Forecasted Market Size by Application (US$ Million), 2027–2032
Table 46. Global Remote Access Tools Revenue Market Share by Application (2027–2032)
Table 47. North America Remote Access Tools Market Size Growth Rate by Country (US$ Million): 2021 vs 2025 vs 2032
Table 48. North America Remote Access Tools Market Size by Country (US$ Million), 2021–2026
Table 49. North America Remote Access Tools Market Size by Country (US$ Million), 2027–2032
Table 50. Europe Remote Access Tools Market Size Growth Rate by Country (US$ Million): 2021 vs 2025 vs 2032
Table 51. Europe Remote Access Tools Market Size by Country (US$ Million), 2021–2026
Table 52. Europe Remote Access Tools Market Size by Country (US$ Million), 2027–2032
Table 53. Asia-Pacific Remote Access Tools Market Size Growth Rate by Region (US$ Million): 2021 vs 2025 vs 2032
Table 54. Asia-Pacific Remote Access Tools Market Size by Region (US$ Million), 2021–2026
Table 55. Asia-Pacific Remote Access Tools Market Size by Region (US$ Million), 2027–2032
Table 56. Latin America Remote Access Tools Market Size Growth Rate by Country (US$ Million): 2021 vs 2025 vs 2032
Table 57. Latin America Remote Access Tools Market Size by Country (US$ Million), 2021–2026
Table 58. Latin America Remote Access Tools Market Size by Country (US$ Million), 2027–2032
Table 59. Middle East & Africa Remote Access Tools Market Size Growth Rate by Country (US$ Million): 2021 vs 2025 vs 2032
Table 60. Middle East & Africa Remote Access Tools Market Size by Country (US$ Million), 2021–2026
Table 61. Middle East & Africa Remote Access Tools Market Size by Country (US$ Million), 2027–2032
Table 62. BeyondTrust Corporation Company Details
Table 63. BeyondTrust Corporation Business Overview
Table 64. BeyondTrust Corporation Remote Access Tools Product
Table 65. BeyondTrust Corporation Revenue in Remote Access Tools Business (US$ Million), 2021–2026
Table 66. BeyondTrust Corporation Recent Development
Table 67. GoTo Group, Inc. (formerly LogMeIn) Company Details
Table 68. GoTo Group, Inc. (formerly LogMeIn) Business Overview
Table 69. GoTo Group, Inc. (formerly LogMeIn) Remote Access Tools Product
Table 70. GoTo Group, Inc. (formerly LogMeIn) Revenue in Remote Access Tools Business (US$ Million), 2021–2026
Table 71. GoTo Group, Inc. (formerly LogMeIn) Recent Development
Table 72. TeamViewer SE Company Details
Table 73. TeamViewer SE Business Overview
Table 74. TeamViewer SE Remote Access Tools Product
Table 75. TeamViewer SE Revenue in Remote Access Tools Business (US$ Million), 2021–2026
Table 76. TeamViewer SE Recent Development
Table 77. AnyDesk Software GmbH Company Details
Table 78. AnyDesk Software GmbH Business Overview
Table 79. AnyDesk Software GmbH Remote Access Tools Product
Table 80. AnyDesk Software GmbH Revenue in Remote Access Tools Business (US$ Million), 2021–2026
Table 81. AnyDesk Software GmbH Recent Development
Table 82. Splashtop Inc. Company Details
Table 83. Splashtop Inc. Business Overview
Table 84. Splashtop Inc. Remote Access Tools Product
Table 85. Splashtop Inc. Revenue in Remote Access Tools Business (US$ Million), 2021–2026
Table 86. Splashtop Inc. Recent Development
Table 87. RealVNC Limited Company Details
Table 88. RealVNC Limited Business Overview
Table 89. RealVNC Limited Remote Access Tools Product
Table 90. RealVNC Limited Revenue in Remote Access Tools Business (US$ Million), 2021–2026
Table 91. RealVNC Limited Recent Development
Table 92. RSUPPORT Co., Ltd. Company Details
Table 93. RSUPPORT Co., Ltd. Business Overview
Table 94. RSUPPORT Co., Ltd. Remote Access Tools Product
Table 95. RSUPPORT Co., Ltd. Revenue in Remote Access Tools Business (US$ Million), 2021–2026
Table 96. RSUPPORT Co., Ltd. Recent Development
Table 97. IDrive Inc. (RemotePC) Company Details
Table 98. IDrive Inc. (RemotePC) Business Overview
Table 99. IDrive Inc. (RemotePC) Remote Access Tools Product
Table 100. IDrive Inc. (RemotePC) Revenue in Remote Access Tools Business (US$ Million), 2021–2026
Table 101. IDrive Inc. (RemotePC) Recent Development
Table 102. ConnectWise, LLC Company Details
Table 103. ConnectWise, LLC Business Overview
Table 104. ConnectWise, LLC Remote Access Tools Product
Table 105. ConnectWise, LLC Revenue in Remote Access Tools Business (US$ Million), 2021–2026
Table 106. ConnectWise, LLC Recent Development
Table 107. SolarWinds (Dameware) Company Details
Table 108. SolarWinds (Dameware) Business Overview
Table 109. SolarWinds (Dameware) Remote Access Tools Product
Table 110. SolarWinds (Dameware) Revenue in Remote Access Tools Business (US$ Million), 2021–2026
Table 111. SolarWinds (Dameware) Recent Development
Table 112. SimpleHelp Company Details
Table 113. SimpleHelp Business Overview
Table 114. SimpleHelp Remote Access Tools Product
Table 115. SimpleHelp Revenue in Remote Access Tools Business (US$ Million), 2021–2026
Table 116. SimpleHelp Recent Development
Table 117. Techinline Company Details
Table 118. Techinline Business Overview
Table 119. Techinline Remote Access Tools Product
Table 120. Techinline Revenue in Remote Access Tools Business (US$ Million), 2021–2026
Table 121. Techinline Recent Development
Table 122. Devolutions Inc. Company Details
Table 123. Devolutions Inc. Business Overview
Table 124. Devolutions Inc. Remote Access Tools Product
Table 125. Devolutions Inc. Revenue in Remote Access Tools Business (US$ Million), 2021–2026
Table 126. Devolutions Inc. Recent Development
Table 127. Zoho Corporation (Zoho Assist) Company Details
Table 128. Zoho Corporation (Zoho Assist) Business Overview
Table 129. Zoho Corporation (Zoho Assist) Remote Access Tools Product
Table 130. Zoho Corporation (Zoho Assist) Revenue in Remote Access Tools Business (US$ Million), 2021–2026
Table 131. Zoho Corporation (Zoho Assist) Recent Development
Table 132. Goverlan, Inc. (Goverlan Reach) Company Details
Table 133. Goverlan, Inc. (Goverlan Reach) Business Overview
Table 134. Goverlan, Inc. (Goverlan Reach) Remote Access Tools Product
Table 135. Goverlan, Inc. (Goverlan Reach) Revenue in Remote Access Tools Business (US$ Million), 2021–2026
Table 136. Goverlan, Inc. (Goverlan Reach) Recent Development
Table 137. Shanghai Best Oray Information Technology Co., Ltd. (Sunlogin) Company Details
Table 138. Shanghai Best Oray Information Technology Co., Ltd. (Sunlogin) Business Overview
Table 139. Shanghai Best Oray Information Technology Co., Ltd. (Sunlogin) Remote Access Tools Product
Table 140. Shanghai Best Oray Information Technology Co., Ltd. (Sunlogin) Revenue in Remote Access Tools Business (US$ Million), 2021–2026
Table 141. Shanghai Best Oray Information Technology Co., Ltd. (Sunlogin) Recent Development
Table 142. Hainan Youqu Technology Co., Ltd. (ToDesk) Company Details
Table 143. Hainan Youqu Technology Co., Ltd. (ToDesk) Business Overview
Table 144. Hainan Youqu Technology Co., Ltd. (ToDesk) Remote Access Tools Product
Table 145. Hainan Youqu Technology Co., Ltd. (ToDesk) Revenue in Remote Access Tools Business (US$ Million), 2021–2026
Table 146. Hainan Youqu Technology Co., Ltd. (ToDesk) Recent Development
Table 147. Dayu Internet Technology (Shenzhen) Co., Ltd. (RayLink) Company Details
Table 148. Dayu Internet Technology (Shenzhen) Co., Ltd. (RayLink) Business Overview
Table 149. Dayu Internet Technology (Shenzhen) Co., Ltd. (RayLink) Remote Access Tools Product
Table 150. Dayu Internet Technology (Shenzhen) Co., Ltd. (RayLink) Revenue in Remote Access Tools Business (US$ Million), 2021–2026
Table 151. Dayu Internet Technology (Shenzhen) Co., Ltd. (RayLink) Recent Development
Table 152. AOMEI International Network Limited (AnyViewer) Company Details
Table 153. AOMEI International Network Limited (AnyViewer) Business Overview
Table 154. AOMEI International Network Limited (AnyViewer) Remote Access Tools Product
Table 155. AOMEI International Network Limited (AnyViewer) Revenue in Remote Access Tools Business (US$ Million), 2021–2026
Table 156. AOMEI International Network Limited (AnyViewer) Recent Development
Table 157. Research Programs/Design for This Report
Table 158. Key Data Information from Secondary Sources
Table 159. Key Data Information from Primary Sources
Table 160. Authors List of This Report
List of Figures
Figure 1. Remote Access Tools Picture
Figure 2. Global Remote Access Tools Market Size Comparison by Type (US$ Million), 2021–2032
Figure 3. Global Remote Access Tools Market Share by Type: 2025 vs 2032
Figure 4. On Premises Features
Figure 5. Cloud-based Features
Figure 6. Global Remote Access Tools Market Size Comparison by Device Management Scope (US$ Million), 2021–2032
Figure 7. Single Device Control Features
Figure 8. Endpoint Fleet Managed Features
Figure 9. Helpdesk Queue Managed Features
Figure 10. Others Features
Figure 11. Global Remote Access Tools Market Size Comparison by Primary Use Scenario (US$ Million), 2021–2032
Figure 12. IT Remote Support Features
Figure 13. Remote Work Access Features
Figure 14. Third Party Remote Operations Features
Figure 15. Remote Training and Collaboration Features
Figure 16. Others Features
Figure 17. Global Remote Access Tools Market Size Comparison by Control Method (US$ Million), 2021–2032
Figure 18. Screen Control Features
Figure 19. Remote Desktop Publishing Features
Figure 20. Shell and Command Execution Features
Figure 21. Others Features
Figure 22. Global Remote Access Tools Market Size by Application (US$ Million), 2021–2032
Figure 23. Global Remote Access Tools Market Share by Application: 2025 vs 2032
Figure 24. Large Enterprises Case Studies
Figure 25. Small and Medium-sized Enterprises (SMEs) Case Studies
Figure 26. Personal Use Case Studies
Figure 27. Remote Access Tools Report Years Considered
Figure 28. Global Remote Access Tools Market Size (US$ Million), Year-over-Year: 2021–2032
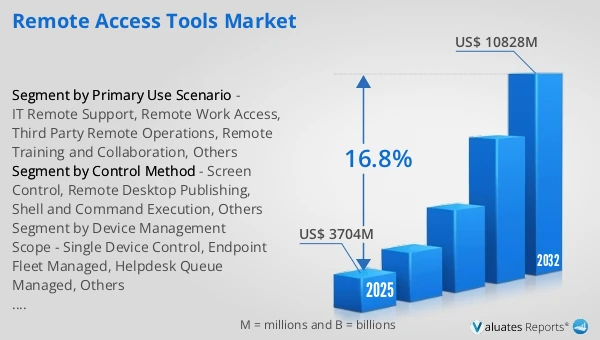
Figure 29. Global Remote Access Tools Market Size, (US$ Million), 2021 vs 2025 vs 2032
Figure 30. Global Remote Access Tools Market Share by Region: 2025 vs 2032
Figure 31. Global Remote Access Tools Market Share by Players in 2025
Figure 32. Global Remote Access Tools Market Share by Company Type (Tier 1, Tier 2, and Tier 3)
Figure 33. The Top 10 and 5 Players Market Share by Remote Access Tools Revenue in 2025
Figure 34. North America Remote Access Tools Market Size YoY Growth (US$ Million), 2021–2032
Figure 35. North America Remote Access Tools Market Share by Country (2021–2032)
Figure 36. United States Remote Access Tools Market Size YoY Growth (US$ Million), 2021–2032
Figure 37. Canada Remote Access Tools Market Size YoY Growth (US$ Million), 2021–2032
Figure 38. Europe Remote Access Tools Market Size YoY Growth (US$ Million), 2021–2032
Figure 39. Europe Remote Access Tools Market Share by Country (2021–2032)
Figure 40. Germany Remote Access Tools Market Size YoY Growth (US$ Million), 2021–2032
Figure 41. France Remote Access Tools Market Size YoY Growth (US$ Million), 2021–2032
Figure 42. U.K. Remote Access Tools Market Size YoY Growth (US$ Million), 2021–2032
Figure 43. Italy Remote Access Tools Market Size YoY Growth (US$ Million), 2021–2032
Figure 44. Russia Remote Access Tools Market Size YoY Growth (US$ Million), 2021–2032
Figure 45. Ireland Remote Access Tools Market Size YoY Growth (US$ Million), 2021–2032
Figure 46. Asia-Pacific Remote Access Tools Market Size YoY Growth (US$ Million), 2021–2032
Figure 47. Asia-Pacific Remote Access Tools Market Share by Region (2021–2032)
Figure 48. China Remote Access Tools Market Size YoY Growth (US$ Million), 2021–2032
Figure 49. Japan Remote Access Tools Market Size YoY Growth (US$ Million), 2021–2032
Figure 50. South Korea Remote Access Tools Market Size YoY Growth (US$ Million), 2021–2032
Figure 51. Southeast Asia Remote Access Tools Market Size YoY Growth (US$ Million), 2021–2032
Figure 52. India Remote Access Tools Market Size YoY Growth (US$ Million), 2021–2032
Figure 53. Australia & New Zealand Remote Access Tools Market Size YoY Growth (US$ Million), 2021–2032
Figure 54. Latin America Remote Access Tools Market Size YoY Growth (US$ Million), 2021–2032
Figure 55. Latin America Remote Access Tools Market Share by Country (2021–2032)
Figure 56. Mexico Remote Access Tools Market Size YoY Growth (US$ Million), 2021–2032
Figure 57. Brazil Remote Access Tools Market Size YoY Growth (US$ Million), 2021–2032
Figure 58. Middle East & Africa Remote Access Tools Market Size YoY Growth (US$ Million), 2021–2032
Figure 59. Middle East & Africa Remote Access Tools Market Share by Country (2021–2032)
Figure 60. Israel Remote Access Tools Market Size YoY Growth (US$ Million), 2021–2032
Figure 61. Saudi Arabia Remote Access Tools Market Size YoY Growth (US$ Million), 2021–2032
Figure 62. UAE Remote Access Tools Market Size YoY Growth (US$ Million), 2021–2032
Figure 63. BeyondTrust Corporation Revenue Growth Rate in Remote Access Tools Business (2021–2026)
Figure 64. GoTo Group, Inc. (formerly LogMeIn) Revenue Growth Rate in Remote Access Tools Business (2021–2026)
Figure 65. TeamViewer SE Revenue Growth Rate in Remote Access Tools Business (2021–2026)
Figure 66. AnyDesk Software GmbH Revenue Growth Rate in Remote Access Tools Business (2021–2026)
Figure 67. Splashtop Inc. Revenue Growth Rate in Remote Access Tools Business (2021–2026)
Figure 68. RealVNC Limited Revenue Growth Rate in Remote Access Tools Business (2021–2026)
Figure 69. RSUPPORT Co., Ltd. Revenue Growth Rate in Remote Access Tools Business (2021–2026)
Figure 70. IDrive Inc. (RemotePC) Revenue Growth Rate in Remote Access Tools Business (2021–2026)
Figure 71. ConnectWise, LLC Revenue Growth Rate in Remote Access Tools Business (2021–2026)
Figure 72. SolarWinds (Dameware) Revenue Growth Rate in Remote Access Tools Business (2021–2026)
Figure 73. SimpleHelp Revenue Growth Rate in Remote Access Tools Business (2021–2026)
Figure 74. Techinline Revenue Growth Rate in Remote Access Tools Business (2021–2026)
Figure 75. Devolutions Inc. Revenue Growth Rate in Remote Access Tools Business (2021–2026)
Figure 76. Zoho Corporation (Zoho Assist) Revenue Growth Rate in Remote Access Tools Business (2021–2026)
Figure 77. Goverlan, Inc. (Goverlan Reach) Revenue Growth Rate in Remote Access Tools Business (2021–2026)
Figure 78. Shanghai Best Oray Information Technology Co., Ltd. (Sunlogin) Revenue Growth Rate in Remote Access Tools Business (2021–2026)
Figure 79. Hainan Youqu Technology Co., Ltd. (ToDesk) Revenue Growth Rate in Remote Access Tools Business (2021–2026)
Figure 80. Dayu Internet Technology (Shenzhen) Co., Ltd. (RayLink) Revenue Growth Rate in Remote Access Tools Business (2021–2026)
Figure 81. AOMEI International Network Limited (AnyViewer) Revenue Growth Rate in Remote Access Tools Business (2021–2026)
Figure 82. Bottom-up and Top-down Approaches for This Report
Figure 83. Data Triangulation
Figure 84. Key Executives Interviewed