FEATURED COMPANIES
DuPont
3M
RSG Safety
Honeywell
Dräger
Kimberly clark
Kappler
Ansell
Sioen Industries
Respirex
Lakeland industries
Excalor
International Enviroguard
Asatex
Hancom Lifecare
Hubei Huaqiang High-tech
Military Breathable Gas Protective Clothing Market Size
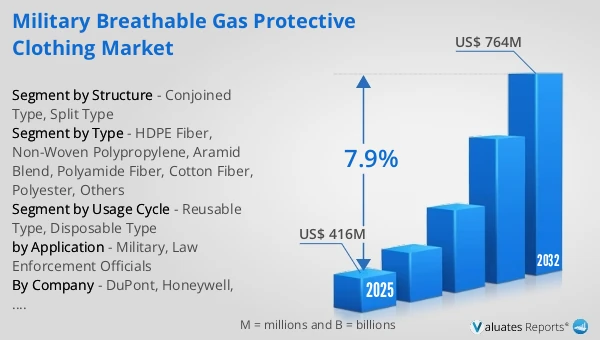
The global Military Breathable Gas Protective Clothing market was valued at US$ 416 million in 2025 and is anticipated to reach US$ 764 million by 2032, at a CAGR of 7.9% from 2026 to 2032.
Military Breathable Gas Protective Clothing Market
The 2025 U.S. tariff policies introduce profound uncertainty into the global economic landscape. This report critically examines the implications of recent tariff adjustments and international strategic countermeasures on Military Breathable Gas Protective Clothing competitive dynamics, regional economic interdependencies, and supply chain reconfigurations.
Military breathable gas protective clothing is a type of personal protective equipment designed for the battlefield and military special mission environments. Its core is to have the ability to block and seal chemical warfare agents and toxic industrial chemicals, while reducing the heat load and humidity caused by long-term wear through composite materials and structural design with air supply ventilation, filtration ventilation, or moisture wicking ability. It also enhances mobility and continuous operation capabilities, and is usually systematically compatible with military gas masks or gas supply systems, communication and carrying equipment. In 2025, global Military Breathable Gas Protective Clothing production reached approximately 6,166 K Units, with an average global market price of around US$ 73.25 per Unit.
The procurement logic of military breathable gas protective clothing is evolving from simply pursuing the highest barrier to a comprehensive indicator of comfort and system compatibility when the protection spectrum is extended. This is driven by the increase in training and deployment intensity, heat stress risk management under high temperature, high humidity, and high-intensity mobility conditions, as well as the availability improvement of low load and low noise friction brought by new materials. The focus of competition will be on the low permeability and durability of materials, the stability of moisture permeability and heat dissipation performance, the standardization of interfaces with mask filtering and communication helmets and carrying systems, the adaptation of quick on/off and decontamination processes, and the ability to ensure full life cycle cost and scale. Suppliers with material research and development, system integration, military standard verification, and supply chain resilience are more likely to obtain long-term standardization and bulk orders.
This report delivers a comprehensive overview of the global Military Breathable Gas Protective Clothing market, with both quantitative and qualitative analyses, to help readers develop growth strategies, assess the competitive landscape, evaluate their position in the current market, and make informed business decisions regarding Military Breathable Gas Protective Clothing. The Military Breathable Gas Protective Clothing market size, estimates, and forecasts are provided in terms of sales volume (K Units) and revenue (US$ millions), with 2025 as the base year and historical and forecast data for 2021–2032.
The report segments the global Military Breathable Gas Protective Clothing market comprehensively. Regional market sizes by Type, by Application, by Structure, and by company are also provided. For deeper insight, the report profiles the competitive landscape, key competitors, and their respective market rankings, and discusses technological trends and new product developments.
This report will assist Military Breathable Gas Protective Clothing manufacturers, new entrants, and companies across the industry value chain with information on revenues, sales volume, and average prices for the overall market and its sub-segments, by company, by Type, by Application, and by region.
Market Segmentation
Scope of Military Breathable Gas Protective Clothing Market Report
| Report Metric |
Details |
| Report Name |
Military Breathable Gas Protective Clothing Market |
| Accounted market size in 2025 |
US$ 416 million |
| Forecasted market size in 2032 |
US$ 764 million |
| CAGR |
7.9% |
| Base Year |
2025 |
| Forecasted years |
2026 - 2032 |
| Segment by Type |
- HDPE Fiber
- Non-Woven Polypropylene
- Aramid Blend
- Polyamide Fiber
- Cotton Fiber
- Polyester
- Others
|
| Segment by Structure |
- Conjoined Type
- Split Type
|
| Segment by Usage Cycle |
- Reusable Type
- Disposable Type
|
| by Application |
- Military
- Law Enforcement Officials
|
| Consumption by Region |
- North America (United States, Canada)
- Europe (Germany, France, UK, Italy, Russia)
- Asia-Pacific (China, Japan, South Korea, Taiwan)
- Southeast Asia (India)
- Latin America (Mexico, Brazil)
|
| By Company |
DuPont, Honeywell, 3M, Kimberly-Clark, Sioen Industries, Ansell, Lakeland Industries, MIRA Safety, Matisec, Tesimax, Dräger, RSG Safety, Respirex, Excalor, Asatex, Kappler, International Enviroguard, Hancom Lifecare, BW Advanced Materials, Hubei Huaqiang High-Tech |
| Forecast units |
USD million in value |
| Report coverage |
Revenue and volume forecast, company share, competitive landscape, growth factors and trends |
Chapter Outline
- Chapter 1: Defines the scope of the report and presents an executive summary of market segments (by Type, by Application, by Structure, etc.), including the size of each segment and its future growth potential. It offers a high-level view of the current market and its likely evolution in the short, medium, and long term.
- Chapter 2: Provides a detailed analysis of the competitive landscape for Military Breathable Gas Protective Clothing manufacturers, covering pricing, sales and revenue shares, latest development plans, and mergers and acquisitions.
- Chapter 3: Examines Military Breathable Gas Protective Clothing sales and revenue at the regional and country levels. It quantifies market size and growth potential for each region and its key countries, and outlines market development, outlook, addressable space, and national market size.
- Chapter 4: Analyzes segments by Type, detailing the size and growth potential of each segment to help readers identify “blue ocean” opportunities.
- Chapter 5: Analyzes market segments by Application, covering the size and growth potential of each segment to help readers identify “blue ocean” opportunities in downstream markets.
- Chapter 6: Profiles key players, presenting core information on leading companies, including product sales, revenue, pricing, gross margin, product portfolio/introductions, and recent developments.
- Chapter 7: Reviews the industry value chain, including upstream and downstream segments.
- Chapter 8: Discusses market dynamics and recent developments, including drivers, restraints, challenges and risks for manufacturers, U.S. Tariffs and relevant policy analysis.
- Chapter 9: Summarizes the key findings and conclusions of the report.
FAQ for this report
How fast is Military Breathable Gas Protective Clothing Market growing?
Ans: The Military Breathable Gas Protective Clothing Market witnessing a CAGR of 7.9% during the forecast period 2026-2032.
What is the Military Breathable Gas Protective Clothing Market size in 2032?
Ans: The Military Breathable Gas Protective Clothing Market size in 2032 will be US$ 764 million.
Who are the main players in the Military Breathable Gas Protective Clothing Market report?
Ans: The main players in the Military Breathable Gas Protective Clothing Market are DuPont, Honeywell, 3M, Kimberly-Clark, Sioen Industries, Ansell, Lakeland Industries, MIRA Safety, Matisec, Tesimax, Dräger, RSG Safety, Respirex, Excalor, Asatex, Kappler, International Enviroguard, Hancom Lifecare, BW Advanced Materials, Hubei Huaqiang High-Tech
What are the Application segmentation covered in the Military Breathable Gas Protective Clothing Market report?
Ans: The Applications covered in the Military Breathable Gas Protective Clothing Market report are Military, Law Enforcement Officials
What are the Type segmentation covered in the Military Breathable Gas Protective Clothing Market report?
Ans: The Types covered in the Military Breathable Gas Protective Clothing Market report are HDPE Fiber, Non-Woven Polypropylene, Aramid Blend, Polyamide Fiber, Cotton Fiber, Polyester, Others
FEATURED COMPANIES
DuPont
3M
RSG Safety
Honeywell
Dräger
Kimberly clark
Kappler
Ansell
Sioen Industries
Respirex
Lakeland industries
Excalor
International Enviroguard
Asatex
Hancom Lifecare
Hubei Huaqiang High-tech

