List of Tables
Table 1. Stationary High-pressure Cleaner Market Trends
Table 2. Stationary High-pressure Cleaner Market Drivers & Opportunity
Table 3. Stationary High-pressure Cleaner Market Challenges
Table 4. Stationary High-pressure Cleaner Market Restraints
Table 5. Global Stationary High-pressure Cleaner Revenue by Company (2019-2024) & (US$ Million)
Table 6. Global Stationary High-pressure Cleaner Revenue Market Share by Company (2019-2024)
Table 7. Global Stationary High-pressure Cleaner Sales Volume by Company (2019-2024) & (Units)
Table 8. Global Stationary High-pressure Cleaner Sales Volume Market Share by Company (2019-2024)
Table 9. Global Market Stationary High-pressure Cleaner Price by Company (2019-2024) & (US$/Unit)
Table 10. Key Manufacturers Stationary High-pressure Cleaner Manufacturing Base Distribution and Headquarters
Table 11. Key Manufacturers Stationary High-pressure Cleaner Product Type
Table 12. Key Manufacturers Time to Begin Mass Production of Stationary High-pressure Cleaner
Table 13. Global Stationary High-pressure Cleaner Manufacturers Market Concentration Ratio (CR5 and HHI)
Table 14. Global Top Manufacturers Market Share by Company Type (Tier 1, Tier 2, and Tier 3) & (based on the Revenue in Stationary High-pressure Cleaner as of 2023)
Table 15. Mergers & Acquisitions, Expansion Plans
Table 16. Global Stationary High-pressure Cleaner Sales Value by Type: 2019 VS 2023 VS 2030 (US$ Million)
Table 17. Global Stationary High-pressure Cleaner Sales Value by Type (2019-2024) & (US$ Million)
Table 18. Global Stationary High-pressure Cleaner Sales Value by Type (2025-2030) & (US$ Million)
Table 19. Global Stationary High-pressure Cleaner Sales Market Share in Value by Type (2019-2024) & (%)
Table 20. Global Stationary High-pressure Cleaner Sales Market Share in Value by Type (2025-2030) & (%)
Table 21. Global Stationary High-pressure Cleaner Sales Volume by Type: 2019 VS 2023 VS 2030 (Units)
Table 22. Global Stationary High-pressure Cleaner Sales Volume by Type (2019-2024) & (Units)
Table 23. Global Stationary High-pressure Cleaner Sales Volume by Type (2025-2030) & (Units)
Table 24. Global Stationary High-pressure Cleaner Sales Market Share in Volume by Type (2019-2024) & (%)
Table 25. Global Stationary High-pressure Cleaner Sales Market Share in Volume by Type (2025-2030) & (%)
Table 26. Global Stationary High-pressure Cleaner Price by Type (2019-2024) & (US$/Unit)
Table 27. Global Stationary High-pressure Cleaner Price by Type (2025-2030) & (US$/Unit)
Table 28. Global Stationary High-pressure Cleaner Sales Value by Application: 2019 VS 2023 VS 2030 (US$ Million)
Table 29. Global Stationary High-pressure Cleaner Sales Value by Application (2019-2024) & (US$ Million)
Table 30. Global Stationary High-pressure Cleaner Sales Value by Application (2025-2030) & (US$ Million)
Table 31. Global Stationary High-pressure Cleaner Sales Market Share in Value by Application (2019-2024) & (%)
Table 32. Global Stationary High-pressure Cleaner Sales Market Share in Value by Application (2025-2030) & (%)
Table 33. Global Stationary High-pressure Cleaner Sales Volume by Application: 2019 VS 2023 VS 2030 (Units)
Table 34. Global Stationary High-pressure Cleaner Sales Volume by Application (2019-2024) & (Units)
Table 35. Global Stationary High-pressure Cleaner Sales Volume by Application (2025-2030) & (Units)
Table 36. Global Stationary High-pressure Cleaner Sales Market Share in Volume by Application (2019-2024) & (%)
Table 37. Global Stationary High-pressure Cleaner Sales Market Share in Volume by Application (2025-2030) & (%)
Table 38. Global Stationary High-pressure Cleaner Price by Application (2019-2024) & (US$/Unit)
Table 39. Global Stationary High-pressure Cleaner Price by Application (2025-2030) & (US$/Unit)
Table 40. Global Stationary High-pressure Cleaner Sales Value by Region: 2019 VS 2023 VS 2030 (US$ Million)
Table 41. Global Stationary High-pressure Cleaner Sales Value by Region (2019-2024) & (US$ Million)
Table 42. Global Stationary High-pressure Cleaner Sales Value by Region (2025-2030) & (US$ Million)
Table 43. Global Stationary High-pressure Cleaner Sales Value by Region (2019-2024) & (%)
Table 44. Global Stationary High-pressure Cleaner Sales Value by Region (2025-2030) & (%)
Table 45. Global Stationary High-pressure Cleaner Sales Volume by Region (Units): 2019 VS 2023 VS 2030
Table 46. Global Stationary High-pressure Cleaner Sales Volume by Region (2019-2024) & (Units)
Table 47. Global Stationary High-pressure Cleaner Sales Volume by Region (2025-2030) & (Units)
Table 48. Global Stationary High-pressure Cleaner Sales Volume by Region (2019-2024) & (%)
Table 49. Global Stationary High-pressure Cleaner Sales Volume by Region (2025-2030) & (%)
Table 50. Global Stationary High-pressure Cleaner Average Price by Region (2019-2024) & (US$/Unit)
Table 51. Global Stationary High-pressure Cleaner Average Price by Region (2025-2030) & (US$/Unit)
Table 52. Key Countries/Regions Stationary High-pressure Cleaner Sales Value Growth Trends, (US$ Million): 2019 VS 2023 VS 2030
Table 53. Key Countries/Regions Stationary High-pressure Cleaner Sales Value, (2019-2024) & (US$ Million)
Table 54. Key Countries/Regions Stationary High-pressure Cleaner Sales Value, (2025-2030) & (US$ Million)
Table 55. Key Countries/Regions Stationary High-pressure Cleaner Sales Volume, (2019-2024) & (Units)
Table 56. Key Countries/Regions Stationary High-pressure Cleaner Sales Volume, (2025-2030) & (Units)
Table 57. Nilfisk Group Company Information
Table 58. Nilfisk Group Introduction and Business Overview
Table 59. Nilfisk Group Stationary High-pressure Cleaner Sales (Units), Revenue (US$ Million), Price (US$/Unit) and Gross Margin (2019-2024)
Table 60. Nilfisk Group Stationary High-pressure Cleaner Product Offerings
Table 61. Nilfisk Group Recent Development
Table 62. Daimer Industries Company Information
Table 63. Daimer Industries Introduction and Business Overview
Table 64. Daimer Industries Stationary High-pressure Cleaner Sales (Units), Revenue (US$ Million), Price (US$/Unit) and Gross Margin (2019-2024)
Table 65. Daimer Industries Stationary High-pressure Cleaner Product Offerings
Table 66. Daimer Industries Recent Development
Table 67. AaquaTools Company Information
Table 68. AaquaTools Introduction and Business Overview
Table 69. AaquaTools Stationary High-pressure Cleaner Sales (Units), Revenue (US$ Million), Price (US$/Unit) and Gross Margin (2019-2024)
Table 70. AaquaTools Stationary High-pressure Cleaner Product Offerings
Table 71. AaquaTools Recent Development
Table 72. Kärcher Group Company Information
Table 73. Kärcher Group Introduction and Business Overview
Table 74. Kärcher Group Stationary High-pressure Cleaner Sales (Units), Revenue (US$ Million), Price (US$/Unit) and Gross Margin (2019-2024)
Table 75. Kärcher Group Stationary High-pressure Cleaner Product Offerings
Table 76. Kärcher Group Recent Development
Table 77. Mi-TM Company Information
Table 78. Mi-TM Introduction and Business Overview
Table 79. Mi-TM Stationary High-pressure Cleaner Sales (Units), Revenue (US$ Million), Price (US$/Unit) and Gross Margin (2019-2024)
Table 80. Mi-TM Stationary High-pressure Cleaner Product Offerings
Table 81. Mi-TM Recent Development
Table 82. Kränzle Company Information
Table 83. Kränzle Introduction and Business Overview
Table 84. Kränzle Stationary High-pressure Cleaner Sales (Units), Revenue (US$ Million), Price (US$/Unit) and Gross Margin (2019-2024)
Table 85. Kränzle Stationary High-pressure Cleaner Product Offerings
Table 86. Kränzle Recent Development
Table 87. Magikist Company Information
Table 88. Magikist Introduction and Business Overview
Table 89. Magikist Stationary High-pressure Cleaner Sales (Units), Revenue (US$ Million), Price (US$/Unit) and Gross Margin (2019-2024)
Table 90. Magikist Stationary High-pressure Cleaner Product Offerings
Table 91. Magikist Recent Development
Table 92. Reno Company Information
Table 93. Reno Introduction and Business Overview
Table 94. Reno Stationary High-pressure Cleaner Sales (Units), Revenue (US$ Million), Price (US$/Unit) and Gross Margin (2019-2024)
Table 95. Reno Stationary High-pressure Cleaner Product Offerings
Table 96. Reno Recent Development
Table 97. Aaladin Company Information
Table 98. Aaladin Introduction and Business Overview
Table 99. Aaladin Stationary High-pressure Cleaner Sales (Units), Revenue (US$ Million), Price (US$/Unit) and Gross Margin (2019-2024)
Table 100. Aaladin Stationary High-pressure Cleaner Product Offerings
Table 101. Aaladin Recent Development
Table 102. Weidber Company Information
Table 103. Weidber Introduction and Business Overview
Table 104. Weidber Stationary High-pressure Cleaner Sales (Units), Revenue (US$ Million), Price (US$/Unit) and Gross Margin (2019-2024)
Table 105. Weidber Stationary High-pressure Cleaner Product Offerings
Table 106. Weidber Recent Development
Table 107. TomahawkUSA Company Information
Table 108. TomahawkUSA Introduction and Business Overview
Table 109. TomahawkUSA Stationary High-pressure Cleaner Sales (Units), Revenue (US$ Million), Price (US$/Unit) and Gross Margin (2019-2024)
Table 110. TomahawkUSA Stationary High-pressure Cleaner Product Offerings
Table 111. TomahawkUSA Recent Development
Table 112. Key Raw Materials Lists
Table 113. Raw Materials Key Suppliers Lists
Table 114. Stationary High-pressure Cleaner Downstream Customers
Table 115. Stationary High-pressure Cleaner Distributors List
Table 116. Research Programs/Design for This Report
Table 117. Key Data Information from Secondary Sources
Table 118. Key Data Information from Primary Sources
List of Figures
Figure 1. Stationary High-pressure Cleaner Product Picture
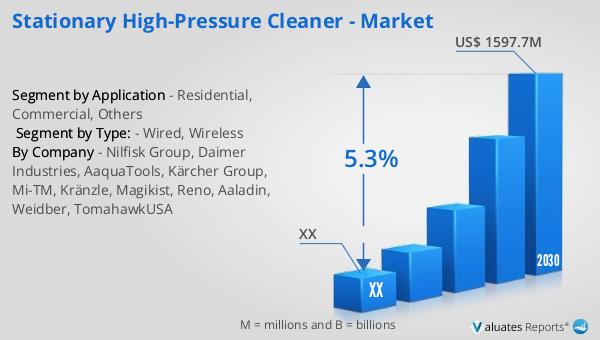
Figure 2. Global Stationary High-pressure Cleaner Sales Value, 2019 VS 2023 VS 2030 (US$ Million)
Figure 3. Global Stationary High-pressure Cleaner Sales Value (2019-2030) & (US$ Million)
Figure 4. Global Stationary High-pressure Cleaner Sales Volume (2019-2030) & (Units)
Figure 5. Global Stationary High-pressure Cleaner Sales Price (2019-2030) & (US$/Unit)
Figure 6. Stationary High-pressure Cleaner Report Years Considered
Figure 7. Global Stationary High-pressure Cleaner Players Revenue Ranking (2023) & (US$ Million)
Figure 8. Global Stationary High-pressure Cleaner Players Sales Volume Ranking (2023) & (Units)
Figure 9. The 5 and 10 Largest Manufacturers in the World: Market Share by Stationary High-pressure Cleaner Revenue in 2023
Figure 10. Stationary High-pressure Cleaner Market Share by Company Type (Tier 1, Tier 2, and Tier 3): 2019 VS 2023
Figure 11. Wired Picture
Figure 12. Wireless Picture
Figure 13. Global Stationary High-pressure Cleaner Sales Value by Type (2019 VS 2023 VS 2030) & (US$ Million)
Figure 14. Global Stationary High-pressure Cleaner Sales Value Market Share by Type, 2023 & 2030
Figure 15. Global Stationary High-pressure Cleaner Sales Volume by Type (2019 VS 2023 VS 2030) & (Units)
Figure 16. Global Stationary High-pressure Cleaner Sales Volume Market Share by Type, 2023 & 2030
Figure 17. Global Stationary High-pressure Cleaner Price by Type (2019-2030) & (US$/Unit)
Figure 18. Product Picture of Residential
Figure 19. Product Picture of Commercial
Figure 20. Product Picture of Others
Figure 21. Global Stationary High-pressure Cleaner Sales Value by Application (2019 VS 2023 VS 2030) & (US$ Million)
Figure 22. Global Stationary High-pressure Cleaner Sales Value Market Share by Application, 2023 & 2030
Figure 23. Global Stationary High-pressure Cleaner Sales Volume by Application (2019 VS 2023 VS 2030) & (Units)
Figure 24. Global Stationary High-pressure Cleaner Sales Volume Market Share by Application, 2023 & 2030
Figure 25. Global Stationary High-pressure Cleaner Price by Application (2019-2030) & (US$/Unit)
Figure 26. North America Stationary High-pressure Cleaner Sales Value (2019-2030) & (US$ Million)
Figure 27. North America Stationary High-pressure Cleaner Sales Value by Country (%), 2023 VS 2030
Figure 28. Europe Stationary High-pressure Cleaner Sales Value (2019-2030) & (US$ Million)
Figure 29. Europe Stationary High-pressure Cleaner Sales Value by Country (%), 2023 VS 2030
Figure 30. Asia Pacific Stationary High-pressure Cleaner Sales Value (2019-2030) & (US$ Million)
Figure 31. Asia Pacific Stationary High-pressure Cleaner Sales Value by Country (%), 2023 VS 2030
Figure 32. South America Stationary High-pressure Cleaner Sales Value (2019-2030) & (US$ Million)
Figure 33. South America Stationary High-pressure Cleaner Sales Value by Country (%), 2023 VS 2030
Figure 34. Middle East & Africa Stationary High-pressure Cleaner Sales Value (2019-2030) & (US$ Million)
Figure 35. Middle East & Africa Stationary High-pressure Cleaner Sales Value by Country (%), 2023 VS 2030
Figure 36. Key Countries/Regions Stationary High-pressure Cleaner Sales Value (%), (2019-2030)
Figure 37. Key Countries/Regions Stationary High-pressure Cleaner Sales Volume (%), (2019-2030)
Figure 38. United States Stationary High-pressure Cleaner Sales Value, (2019-2030) & (US$ Million)
Figure 39. United States Stationary High-pressure Cleaner Sales Value by Type (%), 2023 VS 2030
Figure 40. United States Stationary High-pressure Cleaner Sales Value by Application (%), 2023 VS 2030
Figure 41. Europe Stationary High-pressure Cleaner Sales Value, (2019-2030) & (US$ Million)
Figure 42. Europe Stationary High-pressure Cleaner Sales Value by Type (%), 2023 VS 2030
Figure 43. Europe Stationary High-pressure Cleaner Sales Value by Application (%), 2023 VS 2030
Figure 44. China Stationary High-pressure Cleaner Sales Value, (2019-2030) & (US$ Million)
Figure 45. China Stationary High-pressure Cleaner Sales Value by Type (%), 2023 VS 2030
Figure 46. China Stationary High-pressure Cleaner Sales Value by Application (%), 2023 VS 2030
Figure 47. Japan Stationary High-pressure Cleaner Sales Value, (2019-2030) & (US$ Million)
Figure 48. Japan Stationary High-pressure Cleaner Sales Value by Type (%), 2023 VS 2030
Figure 49. Japan Stationary High-pressure Cleaner Sales Value by Application (%), 2023 VS 2030
Figure 50. South Korea Stationary High-pressure Cleaner Sales Value, (2019-2030) & (US$ Million)
Figure 51. South Korea Stationary High-pressure Cleaner Sales Value by Type (%), 2023 VS 2030
Figure 52. South Korea Stationary High-pressure Cleaner Sales Value by Application (%), 2023 VS 2030
Figure 53. Southeast Asia Stationary High-pressure Cleaner Sales Value, (2019-2030) & (US$ Million)
Figure 54. Southeast Asia Stationary High-pressure Cleaner Sales Value by Type (%), 2023 VS 2030
Figure 55. Southeast Asia Stationary High-pressure Cleaner Sales Value by Application (%), 2023 VS 2030
Figure 56. India Stationary High-pressure Cleaner Sales Value, (2019-2030) & (US$ Million)
Figure 57. India Stationary High-pressure Cleaner Sales Value by Type (%), 2023 VS 2030
Figure 58. India Stationary High-pressure Cleaner Sales Value by Application (%), 2023 VS 2030
Figure 59. Stationary High-pressure Cleaner Industrial Chain
Figure 60. Stationary High-pressure Cleaner Manufacturing Cost Structure
Figure 61. Channels of Distribution (Direct Sales, and Distribution)
Figure 62. Bottom-up and Top-down Approaches for This Report
Figure 63. Data Triangulation
Figure 64. Key Executives Interviewed