List of Tables
Table 1. Global Commercial Drone Formation Performance Market Size Growth Rate by Type (US$ Million): 2020 VS 2024 VS 2031
Table 2. Key Players of Indoor Drone Light Show
Table 3. Key Players of Outdoor Drone Light Show
Table 4. Global Commercial Drone Formation Performance Market Size Growth by Application (US$ Million): 2020 VS 2024 VS 2031
Table 5. Global Commercial Drone Formation Performance Market Size by Region (US$ Million): 2020 VS 2024 VS 2031
Table 6. Global Commercial Drone Formation Performance Market Size by Region (2020-2025) & (US$ Million)
Table 7. Global Commercial Drone Formation Performance Market Share by Region (2020-2025)
Table 8. Global Commercial Drone Formation Performance Forecasted Market Size by Region (2026-2031) & (US$ Million)
Table 9. Global Commercial Drone Formation Performance Market Share by Region (2026-2031)
Table 10. Commercial Drone Formation Performance Market Trends
Table 11. Commercial Drone Formation Performance Market Drivers
Table 12. Commercial Drone Formation Performance Market Challenges
Table 13. Commercial Drone Formation Performance Market Restraints
Table 14. Global Commercial Drone Formation Performance Revenue by Players (2020-2025) & (US$ Million)
Table 15. Global Commercial Drone Formation Performance Market Share by Players (2020-2025)
Table 16. Global Top Commercial Drone Formation Performance Players by Company Type (Tier 1, Tier 2, and Tier 3) & (based on the Revenue in Commercial Drone Formation Performance as of 2024)
Table 17. Ranking of Global Top Commercial Drone Formation Performance Companies by Revenue (US$ Million) in 2024
Table 18. Global 5 Largest Players Market Share by Commercial Drone Formation Performance Revenue (CR5 and HHI) & (2020-2025)
Table 19. Global Key Players of Commercial Drone Formation Performance, Headquarters and Area Served
Table 20. Global Key Players of Commercial Drone Formation Performance, Product and Application
Table 21. Global Key Players of Commercial Drone Formation Performance, Date of Enter into This Industry
Table 22. Mergers & Acquisitions, Expansion Plans
Table 23. Global Commercial Drone Formation Performance Market Size by Type (2020-2025) & (US$ Million)
Table 24. Global Commercial Drone Formation Performance Revenue Market Share by Type (2020-2025)
Table 25. Global Commercial Drone Formation Performance Forecasted Market Size by Type (2026-2031) & (US$ Million)
Table 26. Global Commercial Drone Formation Performance Revenue Market Share by Type (2026-2031)
Table 27. Global Commercial Drone Formation Performance Market Size by Application (2020-2025) & (US$ Million)
Table 28. Global Commercial Drone Formation Performance Revenue Market Share by Application (2020-2025)
Table 29. Global Commercial Drone Formation Performance Forecasted Market Size by Application (2026-2031) & (US$ Million)
Table 30. Global Commercial Drone Formation Performance Revenue Market Share by Application (2026-2031)
Table 31. North America Commercial Drone Formation Performance Market Size Growth Rate by Country (US$ Million): 2020 VS 2024 VS 2031
Table 32. North America Commercial Drone Formation Performance Market Size by Country (2020-2025) & (US$ Million)
Table 33. North America Commercial Drone Formation Performance Market Size by Country (2026-2031) & (US$ Million)
Table 34. Europe Commercial Drone Formation Performance Market Size Growth Rate by Country (US$ Million): 2020 VS 2024 VS 2031
Table 35. Europe Commercial Drone Formation Performance Market Size by Country (2020-2025) & (US$ Million)
Table 36. Europe Commercial Drone Formation Performance Market Size by Country (2026-2031) & (US$ Million)
Table 37. Asia-Pacific Commercial Drone Formation Performance Market Size Growth Rate by Region (US$ Million): 2020 VS 2024 VS 2031
Table 38. Asia-Pacific Commercial Drone Formation Performance Market Size by Region (2020-2025) & (US$ Million)
Table 39. Asia-Pacific Commercial Drone Formation Performance Market Size by Region (2026-2031) & (US$ Million)
Table 40. Latin America Commercial Drone Formation Performance Market Size Growth Rate by Country (US$ Million): 2020 VS 2024 VS 2031
Table 41. Latin America Commercial Drone Formation Performance Market Size by Country (2020-2025) & (US$ Million)
Table 42. Latin America Commercial Drone Formation Performance Market Size by Country (2026-2031) & (US$ Million)
Table 43. Middle East & Africa Commercial Drone Formation Performance Market Size Growth Rate by Country (US$ Million): 2020 VS 2024 VS 2031
Table 44. Middle East & Africa Commercial Drone Formation Performance Market Size by Country (2020-2025) & (US$ Million)
Table 45. Middle East & Africa Commercial Drone Formation Performance Market Size by Country (2026-2031) & (US$ Million)
Table 46. EFYI Company Details
Table 47. EFYI Business Overview
Table 48. EFYI Commercial Drone Formation Performance Product
Table 49. EFYI Revenue in Commercial Drone Formation Performance Business (2020-2025) & (US$ Million)
Table 50. EFYI Recent Development
Table 51. Ehang Company Details
Table 52. Ehang Business Overview
Table 53. Ehang Commercial Drone Formation Performance Product
Table 54. Ehang Revenue in Commercial Drone Formation Performance Business (2020-2025) & (US$ Million)
Table 55. Ehang Recent Development
Table 56. Aero Future Company Details
Table 57. Aero Future Business Overview
Table 58. Aero Future Commercial Drone Formation Performance Product
Table 59. Aero Future Revenue in Commercial Drone Formation Performance Business (2020-2025) & (US$ Million)
Table 60. Aero Future Recent Development
Table 61. Shenzhen DAMODA Company Details
Table 62. Shenzhen DAMODA Business Overview
Table 63. Shenzhen DAMODA Commercial Drone Formation Performance Product
Table 64. Shenzhen DAMODA Revenue in Commercial Drone Formation Performance Business (2020-2025) & (US$ Million)
Table 65. Shenzhen DAMODA Recent Development
Table 66. Cross Stars Company Details
Table 67. Cross Stars Business Overview
Table 68. Cross Stars Commercial Drone Formation Performance Product
Table 69. Cross Stars Revenue in Commercial Drone Formation Performance Business (2020-2025) & (US$ Million)
Table 70. Cross Stars Recent Development
Table 71. HighGreat Company Details
Table 72. HighGreat Business Overview
Table 73. HighGreat Commercial Drone Formation Performance Product
Table 74. HighGreat Revenue in Commercial Drone Formation Performance Business (2020-2025) & (US$ Million)
Table 75. HighGreat Recent Development
Table 76. Geoscan Company Details
Table 77. Geoscan Business Overview
Table 78. Geoscan Commercial Drone Formation Performance Product
Table 79. Geoscan Revenue in Commercial Drone Formation Performance Business (2020-2025) & (US$ Million)
Table 80. Geoscan Recent Development
Table 81. CollMot Entertainment Company Details
Table 82. CollMot Entertainment Business Overview
Table 83. CollMot Entertainment Commercial Drone Formation Performance Product
Table 84. CollMot Entertainment Revenue in Commercial Drone Formation Performance Business (2020-2025) & (US$ Million)
Table 85. CollMot Entertainment Recent Development
Table 86. SKYMAGIC Company Details
Table 87. SKYMAGIC Business Overview
Table 88. SKYMAGIC Commercial Drone Formation Performance Product
Table 89. SKYMAGIC Revenue in Commercial Drone Formation Performance Business (2020-2025) & (US$ Million)
Table 90. SKYMAGIC Recent Development
Table 91. Intel Corporation Company Details
Table 92. Intel Corporation Business Overview
Table 93. Intel Corporation Commercial Drone Formation Performance Product
Table 94. Intel Corporation Revenue in Commercial Drone Formation Performance Business (2020-2025) & (US$ Million)
Table 95. Intel Corporation Recent Development
Table 96. Open Sky Productions Company Details
Table 97. Open Sky Productions Business Overview
Table 98. Open Sky Productions Commercial Drone Formation Performance Product
Table 99. Open Sky Productions Revenue in Commercial Drone Formation Performance Business (2020-2025) & (US$ Million)
Table 100. Open Sky Productions Recent Development
Table 101. Lumasky Company Details
Table 102. Lumasky Business Overview
Table 103. Lumasky Commercial Drone Formation Performance Product
Table 104. Lumasky Revenue in Commercial Drone Formation Performance Business (2020-2025) & (US$ Million)
Table 105. Lumasky Recent Development
Table 106. Sky Elements Company Details
Table 107. Sky Elements Business Overview
Table 108. Sky Elements Commercial Drone Formation Performance Product
Table 109. Sky Elements Revenue in Commercial Drone Formation Performance Business (2020-2025) & (US$ Million)
Table 110. Sky Elements Recent Development
Table 111. Pixis Drones Company Details
Table 112. Pixis Drones Business Overview
Table 113. Pixis Drones Commercial Drone Formation Performance Product
Table 114. Pixis Drones Revenue in Commercial Drone Formation Performance Business (2020-2025) & (US$ Million)
Table 115. Pixis Drones Recent Development
Table 116. Verge Aero Company Details
Table 117. Verge Aero Business Overview
Table 118. Verge Aero Commercial Drone Formation Performance Product
Table 119. Verge Aero Revenue in Commercial Drone Formation Performance Business (2020-2025) & (US$ Million)
Table 120. Verge Aero Recent Development
Table 121. Allumee Company Details
Table 122. Allumee Business Overview
Table 123. Allumee Commercial Drone Formation Performance Product
Table 124. Allumee Revenue in Commercial Drone Formation Performance Business (2020-2025) & (US$ Million)
Table 125. Allumee Recent Development
Table 126. Research Programs/Design for This Report
Table 127. Key Data Information from Secondary Sources
Table 128. Key Data Information from Primary Sources
Table 129. Authors List of This Report
List of Figures
Figure 1. Commercial Drone Formation Performance Picture
Figure 2. Global Commercial Drone Formation Performance Market Size Comparison by Type (2020-2031) & (US$ Million)
Figure 3. Global Commercial Drone Formation Performance Market Share by Type: 2024 VS 2031
Figure 4. Indoor Drone Light Show Features
Figure 5. Outdoor Drone Light Show Features
Figure 6. Global Commercial Drone Formation Performance Market Size by Application (2020-2031) & (US$ Million)
Figure 7. Global Commercial Drone Formation Performance Market Share by Application: 2024 VS 2031
Figure 8. Government Case Studies
Figure 9. Enterprise Case Studies
Figure 10. Personal Case Studies
Figure 11. Commercial Drone Formation Performance Report Years Considered
Figure 12. Global Commercial Drone Formation Performance Market Size (US$ Million), Year-over-Year: 2020-2031
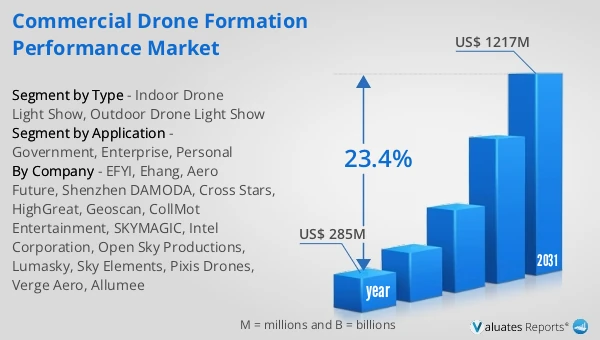
Figure 13. Global Commercial Drone Formation Performance Market Size, (US$ Million), 2020 VS 2024 VS 2031
Figure 14. Global Commercial Drone Formation Performance Market Share by Region: 2024 VS 2031
Figure 15. Global Commercial Drone Formation Performance Market Share by Players in 2024
Figure 16. Global Top Commercial Drone Formation Performance Players by Company Type (Tier 1, Tier 2, and Tier 3) & (based on the Revenue in Commercial Drone Formation Performance as of 2024)
Figure 17. The Top 10 and 5 Players Market Share by Commercial Drone Formation Performance Revenue in 2024
Figure 18. North America Commercial Drone Formation Performance Market Size YoY Growth (2020-2031) & (US$ Million)
Figure 19. North America Commercial Drone Formation Performance Market Share by Country (2020-2031)
Figure 20. United States Commercial Drone Formation Performance Market Size YoY Growth (2020-2031) & (US$ Million)
Figure 21. Canada Commercial Drone Formation Performance Market Size YoY Growth (2020-2031) & (US$ Million)
Figure 22. Europe Commercial Drone Formation Performance Market Size YoY Growth (2020-2031) & (US$ Million)
Figure 23. Europe Commercial Drone Formation Performance Market Share by Country (2020-2031)
Figure 24. Germany Commercial Drone Formation Performance Market Size YoY Growth (2020-2031) & (US$ Million)
Figure 25. France Commercial Drone Formation Performance Market Size YoY Growth (2020-2031) & (US$ Million)
Figure 26. U.K. Commercial Drone Formation Performance Market Size YoY Growth (2020-2031) & (US$ Million)
Figure 27. Italy Commercial Drone Formation Performance Market Size YoY Growth (2020-2031) & (US$ Million)
Figure 28. Russia Commercial Drone Formation Performance Market Size YoY Growth (2020-2031) & (US$ Million)
Figure 29. Nordic Countries Commercial Drone Formation Performance Market Size YoY Growth (2020-2031) & (US$ Million)
Figure 30. Asia-Pacific Commercial Drone Formation Performance Market Size YoY Growth (2020-2031) & (US$ Million)
Figure 31. Asia-Pacific Commercial Drone Formation Performance Market Share by Region (2020-2031)
Figure 32. China Commercial Drone Formation Performance Market Size YoY Growth (2020-2031) & (US$ Million)
Figure 33. Japan Commercial Drone Formation Performance Market Size YoY Growth (2020-2031) & (US$ Million)
Figure 34. South Korea Commercial Drone Formation Performance Market Size YoY Growth (2020-2031) & (US$ Million)
Figure 35. Southeast Asia Commercial Drone Formation Performance Market Size YoY Growth (2020-2031) & (US$ Million)
Figure 36. India Commercial Drone Formation Performance Market Size YoY Growth (2020-2031) & (US$ Million)
Figure 37. Australia Commercial Drone Formation Performance Market Size YoY Growth (2020-2031) & (US$ Million)
Figure 38. Latin America Commercial Drone Formation Performance Market Size YoY Growth (2020-2031) & (US$ Million)
Figure 39. Latin America Commercial Drone Formation Performance Market Share by Country (2020-2031)
Figure 40. Mexico Commercial Drone Formation Performance Market Size YoY Growth (2020-2031) & (US$ Million)
Figure 41. Brazil Commercial Drone Formation Performance Market Size YoY Growth (2020-2031) & (US$ Million)
Figure 42. Middle East & Africa Commercial Drone Formation Performance Market Size YoY Growth (2020-2031) & (US$ Million)
Figure 43. Middle East & Africa Commercial Drone Formation Performance Market Share by Country (2020-2031)
Figure 44. Turkey Commercial Drone Formation Performance Market Size YoY Growth (2020-2031) & (US$ Million)
Figure 45. Saudi Arabia Commercial Drone Formation Performance Market Size YoY Growth (2020-2031) & (US$ Million)
Figure 46. UAE Commercial Drone Formation Performance Market Size YoY Growth (2020-2031) & (US$ Million)
Figure 47. EFYI Revenue Growth Rate in Commercial Drone Formation Performance Business (2020-2025)
Figure 48. Ehang Revenue Growth Rate in Commercial Drone Formation Performance Business (2020-2025)
Figure 49. Aero Future Revenue Growth Rate in Commercial Drone Formation Performance Business (2020-2025)
Figure 50. Shenzhen DAMODA Revenue Growth Rate in Commercial Drone Formation Performance Business (2020-2025)
Figure 51. Cross Stars Revenue Growth Rate in Commercial Drone Formation Performance Business (2020-2025)
Figure 52. HighGreat Revenue Growth Rate in Commercial Drone Formation Performance Business (2020-2025)
Figure 53. Geoscan Revenue Growth Rate in Commercial Drone Formation Performance Business (2020-2025)
Figure 54. CollMot Entertainment Revenue Growth Rate in Commercial Drone Formation Performance Business (2020-2025)
Figure 55. SKYMAGIC Revenue Growth Rate in Commercial Drone Formation Performance Business (2020-2025)
Figure 56. Intel Corporation Revenue Growth Rate in Commercial Drone Formation Performance Business (2020-2025)
Figure 57. Open Sky Productions Revenue Growth Rate in Commercial Drone Formation Performance Business (2020-2025)
Figure 58. Lumasky Revenue Growth Rate in Commercial Drone Formation Performance Business (2020-2025)
Figure 59. Sky Elements Revenue Growth Rate in Commercial Drone Formation Performance Business (2020-2025)
Figure 60. Pixis Drones Revenue Growth Rate in Commercial Drone Formation Performance Business (2020-2025)
Figure 61. Verge Aero Revenue Growth Rate in Commercial Drone Formation Performance Business (2020-2025)
Figure 62. Allumee Revenue Growth Rate in Commercial Drone Formation Performance Business (2020-2025)
Figure 63. Bottom-up and Top-down Approaches for This Report
Figure 64. Data Triangulation
Figure 65. Key Executives Interviewed