List of Tables
Table 1. Flow Chemistry Reactors CAGR in Value, India VS Global, 2018 VS 2022 VS 2029
Table 2. Flow Chemistry Reactors Market Trends
Table 3. Flow Chemistry Reactors Market Drivers
Table 4. Flow Chemistry Reactors Market Challenges
Table 5. Flow Chemistry Reactors Market Restraints
Table 6. Global Flow Chemistry Reactors Sales Growth Rate (CAGR) by Type: 2018 VS 2022 VS 2029 (US$ Million)
Table 7. India Flow Chemistry Reactors Sales Growth Rate (CAGR) by Type: 2018 VS 2022 VS 2029 (US$ Million)
Table 8. Global Flow Chemistry Reactors Sales Growth Rate (CAGR) by Application: 2018 VS 2022 VS 2029 (US$ Million)
Table 9. India Flow Chemistry Reactors Sales Growth Rate (CAGR) by Application: 2018 VS 2022 VS 2029 (US$ Million)
Table 10. Global Key Manufacturers of Flow Chemistry Reactors, Ranked by Revenue (2022) & (US$ Million)
Table 11. Global Flow Chemistry Reactors Revenue by Manufacturer, (US$ Million), 2018-2023
Table 12. Global Flow Chemistry Reactors Revenue Share by Manufacturer, 2018-2023
Table 13. Global Flow Chemistry Reactors Sales by Manufacturer, (Units), 2018-2023
Table 14. Global Flow Chemistry Reactors Sales Share by Manufacturer, 2018-2023
Table 15. Global Flow Chemistry Reactors Price by Manufacturer (2018-2023) & (US$/Unit)
Table 16. Global Flow Chemistry Reactors Manufacturers Market Concentration Ratio (CR5 and HHI)
Table 17. Global Flow Chemistry Reactors by Company Type (Tier 1, Tier 2, and Tier 3) & (based on the Revenue in Flow Chemistry Reactors as of 2022)
Table 18. Global Key Manufacturers of Flow Chemistry Reactors, Manufacturing Base Distribution and Headquarters
Table 19. Global Key Manufacturers of Flow Chemistry Reactors, Product Offered and Application
Table 20. Global Key Manufacturers of Flow Chemistry Reactors, Date of Enter into This Industry
Table 21. Manufacturers Mergers & Acquisitions, Expansion Plans
Table 22. Key Players of Flow Chemistry Reactors in India, Ranked by Revenue (2022) & (US$ million)
Table 23. India Flow Chemistry Reactors Revenue by Players, (US$ Million), (2018-2023)
Table 24. India Flow Chemistry Reactors Revenue Share by Players, (2018-2023)
Table 25. India Flow Chemistry Reactors Sales by Players, (Units), (2018-2023)
Table 26. India Flow Chemistry Reactors Sales Share by Players, (2018-2023)
Table 27. Global Flow Chemistry Reactors Market Size Growth Rate (CAGR) by Region (US$ Million): 2018 VS 2022 VS 2029
Table 28. Global Flow Chemistry Reactors Sales in Volume by Region (2018-2023) & (Units)
Table 29. Global Flow Chemistry Reactors Sales in Volume Forecast by Region (2024-2029) & (Units)
Table 30. Global Flow Chemistry Reactors Sales in Value by Region (2018-2023) & (US$ Million)
Table 31. Global Flow Chemistry Reactors Sales in Value Forecast by Region (2024-2029) & (US$ Million)
Table 32. Americas Flow Chemistry Reactors Market Size Growth Rate (CAGR) by Country (US$ Million): 2018 VS 2022 VS 2029
Table 33. Americas Flow Chemistry Reactors Sales in Value by Country (2018-2023) & (US$ Million)
Table 34. Americas Flow Chemistry Reactors Sales in Value by Country (2024-2029) & (US$ Million)
Table 35. Americas Flow Chemistry Reactors Sales in Volume by Country (2018-2023) & (Units)
Table 36. Americas Flow Chemistry Reactors Sales in Volume by Country (2024-2029) & (Units)
Table 37. EMEA Flow Chemistry Reactors Market Size Growth Rate (CAGR) by Country (US$ Million): 2018 VS 2022 VS 2029
Table 38. EMEA Flow Chemistry Reactors Sales in Value by Country (2018-2023) & (US$ Million)
Table 39. EMEA Flow Chemistry Reactors Sales in Value by Country (2024-2029) & (US$ Million)
Table 40. EMEA Flow Chemistry Reactors Sales in Volume by Country (2018-2023) & (Units)
Table 41. EMEA Flow Chemistry Reactors Sales in Volume by Country (2024-2029) & (Units)
Table 42. APAC Flow Chemistry Reactors Market Size Growth Rate (CAGR) by Country (US$ Million): 2018 VS 2022 VS 2029
Table 43. APAC Flow Chemistry Reactors Sales in Value by Country (2018-2023) & (US$ Million)
Table 44. APAC Flow Chemistry Reactors Sales in Value by Country (2024-2029) & (US$ Million)
Table 45. APAC Flow Chemistry Reactors Sales in Volume by Country (2018-2023) & (Units)
Table 46. APAC Flow Chemistry Reactors Sales in Volume by Country (2024-2029) & (Units)
Table 47. Chemitrix Company Information
Table 48. Chemitrix Description and Business Overview
Table 49. Chemitrix Flow Chemistry Reactors Sales (Units), Revenue (US$ Million), Price (US$/Unit) and Gross Margin (2018-2023)
Table 50. Chemitrix Flow Chemistry Reactors Product
Table 51. Chemitrix Recent Development
Table 52. Syrris Company Information
Table 53. Syrris Description and Business Overview
Table 54. Syrris Flow Chemistry Reactors Sales (Units), Revenue (US$ Million), Price (US$/Unit) and Gross Margin (2018-2023)
Table 55. Syrris Flow Chemistry Reactors Product
Table 56. Syrris Recent Development
Table 57. Vapourtec Company Information
Table 58. Vapourtec Description and Business Overview
Table 59. Vapourtec Flow Chemistry Reactors Sales (Units), Revenue (US$ Million), Price (US$/Unit) and Gross Margin (2018-2023)
Table 60. Vapourtec Flow Chemistry Reactors Product
Table 61. Vapourtec Recent Development
Table 62. ThalesNano Company Information
Table 63. ThalesNano Description and Business Overview
Table 64. ThalesNano Flow Chemistry Reactors Sales (Units), Revenue (US$ Million), Price (US$/Unit) and Gross Margin (2018-2023)
Table 65. ThalesNano Flow Chemistry Reactors Product
Table 66. ThalesNano Recent Development
Table 67. Corning Incorporated Company Information
Table 68. Corning Incorporated Description and Business Overview
Table 69. Corning Incorporated Flow Chemistry Reactors Sales (Units), Revenue (US$ Million), Price (US$/Unit) and Gross Margin (2018-2023)
Table 70. Corning Incorporated Flow Chemistry Reactors Product
Table 71. Corning Incorporated Recent Development
Table 72. Uniqsis Ltd Company Information
Table 73. Uniqsis Ltd Description and Business Overview
Table 74. Uniqsis Ltd Flow Chemistry Reactors Sales (Units), Revenue (US$ Million), Price (US$/Unit) and Gross Margin (2018-2023)
Table 75. Uniqsis Ltd Flow Chemistry Reactors Product
Table 76. Uniqsis Ltd Recent Development
Table 77. YMC Engineering Company Information
Table 78. YMC Engineering Description and Business Overview
Table 79. YMC Engineering Flow Chemistry Reactors Sales (Units), Revenue (US$ Million), Price (US$/Unit) and Gross Margin (2018-2023)
Table 80. YMC Engineering Flow Chemistry Reactors Product
Table 81. YMC Engineering Recent Development
Table 82. AM Technology Company Information
Table 83. AM Technology Description and Business Overview
Table 84. AM Technology Flow Chemistry Reactors Sales (Units), Revenue (US$ Million), Price (US$/Unit) and Gross Margin (2018-2023)
Table 85. AM Technology Flow Chemistry Reactors Product
Table 86. AM Technology Recent Development
Table 87. HEL Group Company Information
Table 88. HEL Group Description and Business Overview
Table 89. HEL Group Flow Chemistry Reactors Sales (Units), Revenue (US$ Million), Price (US$/Unit) and Gross Margin (2018-2023)
Table 90. HEL Group Flow Chemistry Reactors Product
Table 91. HEL Group Recent Development
Table 92. FutureChemistry Company Information
Table 93. FutureChemistry Description and Business Overview
Table 94. FutureChemistry Flow Chemistry Reactors Sales (Units), Revenue (US$ Million), Price (US$/Unit) and Gross Margin (2018-2023)
Table 95. FutureChemistry Flow Chemistry Reactors Product
Table 96. FutureChemistry Recent Development
Table 97. Yanzheng Company Information
Table 98. Yanzheng Description and Business Overview
Table 99. Yanzheng Flow Chemistry Reactors Sales (Units), Revenue (US$ Million), Price (US$/Unit) and Gross Margin (2018-2023)
Table 100. Yanzheng Flow Chemistry Reactors Product
Table 101. Yanzheng Recent Development
Table 102. Key Raw Materials Lists
Table 103. Raw Materials Key Suppliers Lists
Table 104. Flow Chemistry Reactors Customers List
Table 105. Flow Chemistry Reactors Distributors List
Table 106. Research Programs/Design for This Report
Table 107. Key Data Information from Secondary Sources
Table 108. Key Data Information from Primary Sources
List of Figures
Figure 1. Flow Chemistry Reactors Product Picture
Figure 2. Global Flow Chemistry Reactors Revenue, (US$ Million), 2018 VS 2022 VS 2029
Figure 3. Global Flow Chemistry Reactors Market Size 2018-2029 (US$ Million)
Figure 4. Global Flow Chemistry Reactors Sales 2018-2029 (Units)
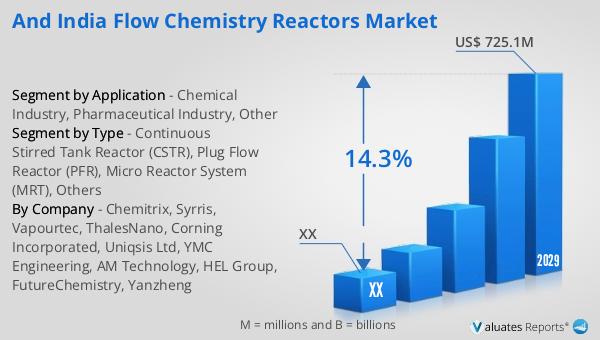
Figure 5. India Flow Chemistry Reactors Revenue, (US$ Million), 2018 VS 2022 VS 2029
Figure 6. India Flow Chemistry Reactors Market Size 2018-2029 (US$ Million)
Figure 7. India Flow Chemistry Reactors Sales 2018-2029 (Units)
Figure 8. India Flow Chemistry Reactors Market Share in Global, in Value (US$ Million) 2018-2029
Figure 9. India Flow Chemistry Reactors Market Share in Global, in Volume (Units) 2018-2029
Figure 10. Flow Chemistry Reactors Report Years Considered
Figure 11. Product Picture of Continuous Stirred Tank Reactor (CSTR)
Figure 12. Product Picture of Plug Flow Reactor (PFR)
Figure 13. Product Picture of Micro Reactor System (MRT)
Figure 14. Product Picture of Others
Figure 15. Global Flow Chemistry Reactors Market Share by Type in 2022 & 2029
Figure 16. Global Flow Chemistry Reactors Sales in Value by Type (2018-2029) & (US$ Million)
Figure 17. Global Flow Chemistry Reactors Sales Market Share in Value by Type (2018-2029)
Figure 18. Global Flow Chemistry Reactors Sales by Type (2018-2029) & (Units)
Figure 19. Global Flow Chemistry Reactors Sales Market Share in Volume by Type (2018-2029)
Figure 20. Global Flow Chemistry Reactors Price by Type (2018-2029) & (US$/Unit)
Figure 21. India Flow Chemistry Reactors Market Share by Type in 2022 & 2029
Figure 22. India Flow Chemistry Reactors Sales in Value by Type (2018-2029) & (US$ Million)
Figure 23. India Flow Chemistry Reactors Sales Market Share in Value by Type (2018-2029)
Figure 24. India Flow Chemistry Reactors Sales by Type (2018-2029) & (Units)
Figure 25. India Flow Chemistry Reactors Sales Market Share in Volume by Type (2018-2029)
Figure 26. India Flow Chemistry Reactors Price by Type (2018-2029) & (US$/Unit)
Figure 27. Product Picture of Chemical Industry
Figure 28. Product Picture of Pharmaceutical Industry
Figure 29. Product Picture of Other
Figure 30. Global Flow Chemistry Reactors Market Share by Application in 2022 & 2029
Figure 31. Global Flow Chemistry Reactors Sales in Value by Application (2018-2029) & (US$ Million)
Figure 32. Global Flow Chemistry Reactors Sales Market Share in Value by Application (2018-2029)
Figure 33. Global Flow Chemistry Reactors Sales by Application (2018-2029) & (Units)
Figure 34. Global Flow Chemistry Reactors Sales Market Share in Volume by Application (2018-2029)
Figure 35. Global Flow Chemistry Reactors Price by Application (2018-2029) & (US$/Unit)
Figure 36. India Flow Chemistry Reactors Market Share by Application in 2022 & 2029
Figure 37. India Flow Chemistry Reactors Sales in Value by Application (2018-2029) & (US$ Million)
Figure 38. India Flow Chemistry Reactors Sales Market Share in Value by Application (2018-2029)
Figure 39. India Flow Chemistry Reactors Sales by Application (2018-2029) & (Units)
Figure 40. India Flow Chemistry Reactors Sales Market Share in Volume by Application (2018-2029)
Figure 41. India Flow Chemistry Reactors Price by Application (2018-2029) & (US$/Unit)
Figure 42. Americas Flow Chemistry Reactors Sales in Volume Growth Rate 2018-2029 (Units)
Figure 43. Americas Flow Chemistry Reactors Sales in Value Growth Rate 2018-2029 (US$ Million)
Figure 44. Americas Flow Chemistry Reactors Sales by Type (2018-2029) & (Units)
Figure 45. Americas Flow Chemistry Reactors Sales Market Share in Volume by Type (2018-2029)
Figure 46. Americas Flow Chemistry Reactors Sales by Application (2018-2029) & (Units)
Figure 47. Americas Flow Chemistry Reactors Sales Market Share in Volume by Application (2018-2029)
Figure 48. United States Flow Chemistry Reactors Sales in Value Growth Rate (2018-2029) & (US$ Million)
Figure 49. Canada Flow Chemistry Reactors Sales in Value Growth Rate (2018-2029) & (US$ Million)
Figure 50. Mexico Flow Chemistry Reactors Sales in Value Growth Rate (2018-2029) & (US$ Million)
Figure 51. Brazil Flow Chemistry Reactors Sales in Value Growth Rate (2018-2029) & (US$ Million)
Figure 52. EMEA Flow Chemistry Reactors Sales in Volume Growth Rate 2018-2029 (Units)
Figure 53. EMEA Flow Chemistry Reactors Sales in Value Growth Rate 2018-2029 (US$ Million)
Figure 54. EMEA Flow Chemistry Reactors Sales by Type (2018-2029) & (Units)
Figure 55. EMEA Flow Chemistry Reactors Sales Market Share in Volume by Type (2018-2029)
Figure 56. EMEA Flow Chemistry Reactors Sales by Application (2018-2029) & (Units)
Figure 57. EMEA Flow Chemistry Reactors Sales Market Share in Volume by Application (2018-2029)
Figure 58. Europe Flow Chemistry Reactors Sales in Value Growth Rate (2018-2029) & (US$ Million)
Figure 59. Middle East Flow Chemistry Reactors Sales in Value Growth Rate (2018-2029) & (US$ Million)
Figure 60. Africa Flow Chemistry Reactors Sales in Value Growth Rate (2018-2029) & (US$ Million)
Figure 61. China Flow Chemistry Reactors Sales in Volume Growth Rate 2018-2029 (Units)
Figure 62. China Flow Chemistry Reactors Sales in Value Growth Rate 2018-2029 (US$ Million)
Figure 63. China Flow Chemistry Reactors Sales by Type (2018-2029) & (Units)
Figure 64. China Flow Chemistry Reactors Sales Market Share in Volume by Type (2018-2029)
Figure 65. China Flow Chemistry Reactors Sales by Application (2018-2029) & (Units)
Figure 66. China Flow Chemistry Reactors Sales Market Share in Volume by Application (2018-2029)
Figure 67. APAC Flow Chemistry Reactors Sales in Volume Growth Rate 2018-2029 (Units)
Figure 68. APAC Flow Chemistry Reactors Sales in Value Growth Rate 2018-2029 (US$ Million)
Figure 69. APAC Flow Chemistry Reactors Sales by Type (2018-2029) & (Units)
Figure 70. APAC Flow Chemistry Reactors Sales Market Share in Volume by Type (2018-2029)
Figure 71. APAC Flow Chemistry Reactors Sales by Application (2018-2029) & (Units)
Figure 72. APAC Flow Chemistry Reactors Sales Market Share in Volume by Application (2018-2029)
Figure 73. Japan Flow Chemistry Reactors Sales in Value Growth Rate (2018-2029) & (US$ Million)
Figure 74. South Korea Flow Chemistry Reactors Sales in Value Growth Rate (2018-2029) & (US$ Million)
Figure 75. China Taiwan Flow Chemistry Reactors Sales in Value Growth Rate (2018-2029) & (US$ Million)
Figure 76. Southeast Asia Flow Chemistry Reactors Sales in Value Growth Rate (2018-2029) & (US$ Million)
Figure 77. India Flow Chemistry Reactors Sales in Value Growth Rate (2018-2029) & (US$ Million)
Figure 78. Flow Chemistry Reactors Value Chain
Figure 79. Flow Chemistry Reactors Production Process
Figure 80. Channels of Distribution
Figure 81. Distributors Profiles
Figure 82. Bottom-up and Top-down Approaches for This Report
Figure 83. Data Triangulation
Figure 84. Key Executives Interviewed