List of Tables
Table 1. Global PCB Testing Services Market Size Growth Rate by Type (US$ Million): 2020 VS 2024 VS 2031
Table 2. Key Players of In-Circuit Testing (ICT)
Table 3. Key Players of Flying Probe Testing
Table 4. Key Players of Automated Optical Inspection (AOI)
Table 5. Key Players of X-ray Inspection (AXI)
Table 6. Key Players of Boundary Scan Testing
Table 7. Key Players of Others
Table 8. Global PCB Testing Services Market Size Growth Rate by Product Stage (US$ Million): 2020 VS 2024 VS 2031
Table 9. Key Players of Research and Development Phase
Table 10. Key Players of Certification Phase
Table 11. Key Players of Production Phase
Table 12. Key Players of After-sales Phase
Table 13. Global PCB Testing Services Market Size Growth Rate by Test Content (US$ Million): 2020 VS 2024 VS 2031
Table 14. Key Players of Electrical Performance
Table 15. Key Players of Environmental Reliability
Table 16. Key Players of Physical/Chemical Properties
Table 17. Key Players of Failure Analysis
Table 18. Global PCB Testing Services Market Size Growth by Application (US$ Million): 2020 VS 2024 VS 2031
Table 19. Global PCB Testing Services Market Size by Region (US$ Million): 2020 VS 2024 VS 2031
Table 20. Global PCB Testing Services Market Size by Region (2020-2025) & (US$ Million)
Table 21. Global PCB Testing Services Market Share by Region (2020-2025)
Table 22. Global PCB Testing Services Forecasted Market Size by Region (2026-2031) & (US$ Million)
Table 23. Global PCB Testing Services Market Share by Region (2026-2031)
Table 24. PCB Testing Services Market Trends
Table 25. PCB Testing Services Market Drivers
Table 26. PCB Testing Services Market Challenges
Table 27. PCB Testing Services Market Restraints
Table 28. Global PCB Testing Services Revenue by Players (2020-2025) & (US$ Million)
Table 29. Global PCB Testing Services Market Share by Players (2020-2025)
Table 30. Global Top PCB Testing Services Players by Company Type (Tier 1, Tier 2, and Tier 3) & (based on the Revenue in PCB Testing Services as of 2024)
Table 31. Ranking of Global Top PCB Testing Services Companies by Revenue (US$ Million) in 2024
Table 32. Global 5 Largest Players Market Share by PCB Testing Services Revenue (CR5 and HHI) & (2020-2025)
Table 33. Global Key Players of PCB Testing Services, Headquarters and Area Served
Table 34. Global Key Players of PCB Testing Services, Product and Application
Table 35. Global Key Players of PCB Testing Services, Date of Enter into This Industry
Table 36. Mergers & Acquisitions, Expansion Plans
Table 37. Global PCB Testing Services Market Size by Type (2020-2025) & (US$ Million)
Table 38. Global PCB Testing Services Revenue Market Share by Type (2020-2025)
Table 39. Global PCB Testing Services Forecasted Market Size by Type (2026-2031) & (US$ Million)
Table 40. Global PCB Testing Services Revenue Market Share by Type (2026-2031)
Table 41. Global PCB Testing Services Market Size by Application (2020-2025) & (US$ Million)
Table 42. Global PCB Testing Services Revenue Market Share by Application (2020-2025)
Table 43. Global PCB Testing Services Forecasted Market Size by Application (2026-2031) & (US$ Million)
Table 44. Global PCB Testing Services Revenue Market Share by Application (2026-2031)
Table 45. North America PCB Testing Services Market Size Growth Rate by Country (US$ Million): 2020 VS 2024 VS 2031
Table 46. North America PCB Testing Services Market Size by Country (2020-2025) & (US$ Million)
Table 47. North America PCB Testing Services Market Size by Country (2026-2031) & (US$ Million)
Table 48. Europe PCB Testing Services Market Size Growth Rate by Country (US$ Million): 2020 VS 2024 VS 2031
Table 49. Europe PCB Testing Services Market Size by Country (2020-2025) & (US$ Million)
Table 50. Europe PCB Testing Services Market Size by Country (2026-2031) & (US$ Million)
Table 51. Asia-Pacific PCB Testing Services Market Size Growth Rate by Region (US$ Million): 2020 VS 2024 VS 2031
Table 52. Asia-Pacific PCB Testing Services Market Size by Region (2020-2025) & (US$ Million)
Table 53. Asia-Pacific PCB Testing Services Market Size by Region (2026-2031) & (US$ Million)
Table 54. Latin America PCB Testing Services Market Size Growth Rate by Country (US$ Million): 2020 VS 2024 VS 2031
Table 55. Latin America PCB Testing Services Market Size by Country (2020-2025) & (US$ Million)
Table 56. Latin America PCB Testing Services Market Size by Country (2026-2031) & (US$ Million)
Table 57. Middle East & Africa PCB Testing Services Market Size Growth Rate by Country (US$ Million): 2020 VS 2024 VS 2031
Table 58. Middle East & Africa PCB Testing Services Market Size by Country (2020-2025) & (US$ Million)
Table 59. Middle East & Africa PCB Testing Services Market Size by Country (2026-2031) & (US$ Million)
Table 60. SGS SA Company Details
Table 61. SGS SA Business Overview
Table 62. SGS SA PCB Testing Services Product
Table 63. SGS SA Revenue in PCB Testing Services Business (2020-2025) & (US$ Million)
Table 64. SGS SA Recent Development
Table 65. Leadsintec Company Details
Table 66. Leadsintec Business Overview
Table 67. Leadsintec PCB Testing Services Product
Table 68. Leadsintec Revenue in PCB Testing Services Business (2020-2025) & (US$ Million)
Table 69. Leadsintec Recent Development
Table 70. FS Technology Company Details
Table 71. FS Technology Business Overview
Table 72. FS Technology PCB Testing Services Product
Table 73. FS Technology Revenue in PCB Testing Services Business (2020-2025) & (US$ Million)
Table 74. FS Technology Recent Development
Table 75. Rigiflex Technology Company Details
Table 76. Rigiflex Technology Business Overview
Table 77. Rigiflex Technology PCB Testing Services Product
Table 78. Rigiflex Technology Revenue in PCB Testing Services Business (2020-2025) & (US$ Million)
Table 79. Rigiflex Technology Recent Development
Table 80. Creative Hi-Tech Company Details
Table 81. Creative Hi-Tech Business Overview
Table 82. Creative Hi-Tech PCB Testing Services Product
Table 83. Creative Hi-Tech Revenue in PCB Testing Services Business (2020-2025) & (US$ Million)
Table 84. Creative Hi-Tech Recent Development
Table 85. UL Solutions Company Details
Table 86. UL Solutions Business Overview
Table 87. UL Solutions PCB Testing Services Product
Table 88. UL Solutions Revenue in PCB Testing Services Business (2020-2025) & (US$ Million)
Table 89. UL Solutions Recent Development
Table 90. VSE Company Details
Table 91. VSE Business Overview
Table 92. VSE PCB Testing Services Product
Table 93. VSE Revenue in PCB Testing Services Business (2020-2025) & (US$ Million)
Table 94. VSE Recent Development
Table 95. SySPCB Company Details
Table 96. SySPCB Business Overview
Table 97. SySPCB PCB Testing Services Product
Table 98. SySPCB Revenue in PCB Testing Services Business (2020-2025) & (US$ Million)
Table 99. SySPCB Recent Development
Table 100. Safiral Company Details
Table 101. Safiral Business Overview
Table 102. Safiral PCB Testing Services Product
Table 103. Safiral Revenue in PCB Testing Services Business (2020-2025) & (US$ Million)
Table 104. Safiral Recent Development
Table 105. NPI Services Company Details
Table 106. NPI Services Business Overview
Table 107. NPI Services PCB Testing Services Product
Table 108. NPI Services Revenue in PCB Testing Services Business (2020-2025) & (US$ Million)
Table 109. NPI Services Recent Development
Table 110. EMSG Company Details
Table 111. EMSG Business Overview
Table 112. EMSG PCB Testing Services Product
Table 113. EMSG Revenue in PCB Testing Services Business (2020-2025) & (US$ Million)
Table 114. EMSG Recent Development
Table 115. Sonic Manufacturing Company Details
Table 116. Sonic Manufacturing Business Overview
Table 117. Sonic Manufacturing PCB Testing Services Product
Table 118. Sonic Manufacturing Revenue in PCB Testing Services Business (2020-2025) & (US$ Million)
Table 119. Sonic Manufacturing Recent Development
Table 120. Cascade Systems Technology Company Details
Table 121. Cascade Systems Technology Business Overview
Table 122. Cascade Systems Technology PCB Testing Services Product
Table 123. Cascade Systems Technology Revenue in PCB Testing Services Business (2020-2025) & (US$ Million)
Table 124. Cascade Systems Technology Recent Development
Table 125. Rush PCB Company Details
Table 126. Rush PCB Business Overview
Table 127. Rush PCB PCB Testing Services Product
Table 128. Rush PCB Revenue in PCB Testing Services Business (2020-2025) & (US$ Million)
Table 129. Rush PCB Recent Development
Table 130. Plasma Ruggedized Solutions Company Details
Table 131. Plasma Ruggedized Solutions Business Overview
Table 132. Plasma Ruggedized Solutions PCB Testing Services Product
Table 133. Plasma Ruggedized Solutions Revenue in PCB Testing Services Business (2020-2025) & (US$ Million)
Table 134. Plasma Ruggedized Solutions Recent Development
Table 135. Uvfab Company Details
Table 136. Uvfab Business Overview
Table 137. Uvfab PCB Testing Services Product
Table 138. Uvfab Revenue in PCB Testing Services Business (2020-2025) & (US$ Million)
Table 139. Uvfab Recent Development
Table 140. LSTPCB Company Details
Table 141. LSTPCB Business Overview
Table 142. LSTPCB PCB Testing Services Product
Table 143. LSTPCB Revenue in PCB Testing Services Business (2020-2025) & (US$ Million)
Table 144. LSTPCB Recent Development
Table 145. Suntronic Inc Company Details
Table 146. Suntronic Inc Business Overview
Table 147. Suntronic Inc PCB Testing Services Product
Table 148. Suntronic Inc Revenue in PCB Testing Services Business (2020-2025) & (US$ Million)
Table 149. Suntronic Inc Recent Development
Table 150. Research Programs/Design for This Report
Table 151. Key Data Information from Secondary Sources
Table 152. Key Data Information from Primary Sources
Table 153. Authors List of This Report
List of Figures
Figure 1. PCB Testing Services Picture
Figure 2. Global PCB Testing Services Market Size Comparison by Type (2020-2031) & (US$ Million)
Figure 3. Global PCB Testing Services Market Share by Type: 2024 VS 2031
Figure 4. In-Circuit Testing (ICT) Features
Figure 5. Flying Probe Testing Features
Figure 6. Automated Optical Inspection (AOI) Features
Figure 7. X-ray Inspection (AXI) Features
Figure 8. Boundary Scan Testing Features
Figure 9. Others Features
Figure 10. Global PCB Testing Services Market Size Comparison by Product Stage (2020-2031) & (US$ Million)
Figure 11. Research and Development Phase Features
Figure 12. Certification Phase Features
Figure 13. Production Phase Features
Figure 14. After-sales Phase Features
Figure 15. Global PCB Testing Services Market Size Comparison by Test Content (2020-2031) & (US$ Million)
Figure 16. Electrical Performance Features
Figure 17. Environmental Reliability Features
Figure 18. Physical/Chemical Properties Features
Figure 19. Failure Analysis Features
Figure 20. Global PCB Testing Services Market Size by Application (2020-2031) & (US$ Million)
Figure 21. Global PCB Testing Services Market Share by Application: 2024 VS 2031
Figure 22. Single-sided PCB Case Studies
Figure 23. Double-sided PCB Case Studies
Figure 24. Multilayer PCB Case Studies
Figure 25. PCB Testing Services Report Years Considered
Figure 26. Global PCB Testing Services Market Size (US$ Million), Year-over-Year: 2020-2031
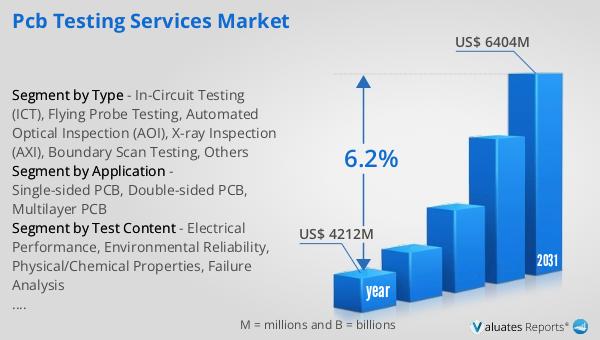
Figure 27. Global PCB Testing Services Market Size, (US$ Million), 2020 VS 2024 VS 2031
Figure 28. Global PCB Testing Services Market Share by Region: 2024 VS 2031
Figure 29. Global PCB Testing Services Market Share by Players in 2024
Figure 30. Global PCB Testing Services Market Share by Company Type (Tier 1, Tier 2, and Tier 3)
Figure 31. The Top 10 and 5 Players Market Share by PCB Testing Services Revenue in 2024
Figure 32. North America PCB Testing Services Market Size YoY Growth (2020-2031) & (US$ Million)
Figure 33. North America PCB Testing Services Market Share by Country (2020-2031)
Figure 34. United States PCB Testing Services Market Size YoY Growth (2020-2031) & (US$ Million)
Figure 35. Canada PCB Testing Services Market Size YoY Growth (2020-2031) & (US$ Million)
Figure 36. Europe PCB Testing Services Market Size YoY Growth (2020-2031) & (US$ Million)
Figure 37. Europe PCB Testing Services Market Share by Country (2020-2031)
Figure 38. Germany PCB Testing Services Market Size YoY Growth (2020-2031) & (US$ Million)
Figure 39. France PCB Testing Services Market Size YoY Growth (2020-2031) & (US$ Million)
Figure 40. U.K. PCB Testing Services Market Size YoY Growth (2020-2031) & (US$ Million)
Figure 41. Italy PCB Testing Services Market Size YoY Growth (2020-2031) & (US$ Million)
Figure 42. Russia PCB Testing Services Market Size YoY Growth (2020-2031) & (US$ Million)
Figure 43. Ireland PCB Testing Services Market Size YoY Growth (2020-2031) & (US$ Million)
Figure 44. Asia-Pacific PCB Testing Services Market Size YoY Growth (2020-2031) & (US$ Million)
Figure 45. Asia-Pacific PCB Testing Services Market Share by Region (2020-2031)
Figure 46. China PCB Testing Services Market Size YoY Growth (2020-2031) & (US$ Million)
Figure 47. Japan PCB Testing Services Market Size YoY Growth (2020-2031) & (US$ Million)
Figure 48. South Korea PCB Testing Services Market Size YoY Growth (2020-2031) & (US$ Million)
Figure 49. Southeast Asia PCB Testing Services Market Size YoY Growth (2020-2031) & (US$ Million)
Figure 50. India PCB Testing Services Market Size YoY Growth (2020-2031) & (US$ Million)
Figure 51. Australia & New Zealand PCB Testing Services Market Size YoY Growth (2020-2031) & (US$ Million)
Figure 52. Latin America PCB Testing Services Market Size YoY Growth (2020-2031) & (US$ Million)
Figure 53. Latin America PCB Testing Services Market Share by Country (2020-2031)
Figure 54. Mexico PCB Testing Services Market Size YoY Growth (2020-2031) & (US$ Million)
Figure 55. Brazil PCB Testing Services Market Size YoY Growth (2020-2031) & (US$ Million)
Figure 56. Middle East & Africa PCB Testing Services Market Size YoY Growth (2020-2031) & (US$ Million)
Figure 57. Middle East & Africa PCB Testing Services Market Share by Country (2020-2031)
Figure 58. Israel PCB Testing Services Market Size YoY Growth (2020-2031) & (US$ Million)
Figure 59. Saudi Arabia PCB Testing Services Market Size YoY Growth (2020-2031) & (US$ Million)
Figure 60. UAE PCB Testing Services Market Size YoY Growth (2020-2031) & (US$ Million)
Figure 61. SGS SA Revenue Growth Rate in PCB Testing Services Business (2020-2025)
Figure 62. Leadsintec Revenue Growth Rate in PCB Testing Services Business (2020-2025)
Figure 63. FS Technology Revenue Growth Rate in PCB Testing Services Business (2020-2025)
Figure 64. Rigiflex Technology Revenue Growth Rate in PCB Testing Services Business (2020-2025)
Figure 65. Creative Hi-Tech Revenue Growth Rate in PCB Testing Services Business (2020-2025)
Figure 66. UL Solutions Revenue Growth Rate in PCB Testing Services Business (2020-2025)
Figure 67. VSE Revenue Growth Rate in PCB Testing Services Business (2020-2025)
Figure 68. SySPCB Revenue Growth Rate in PCB Testing Services Business (2020-2025)
Figure 69. Safiral Revenue Growth Rate in PCB Testing Services Business (2020-2025)
Figure 70. NPI Services Revenue Growth Rate in PCB Testing Services Business (2020-2025)
Figure 71. EMSG Revenue Growth Rate in PCB Testing Services Business (2020-2025)
Figure 72. Sonic Manufacturing Revenue Growth Rate in PCB Testing Services Business (2020-2025)
Figure 73. Cascade Systems Technology Revenue Growth Rate in PCB Testing Services Business (2020-2025)
Figure 74. Rush PCB Revenue Growth Rate in PCB Testing Services Business (2020-2025)
Figure 75. Plasma Ruggedized Solutions Revenue Growth Rate in PCB Testing Services Business (2020-2025)
Figure 76. Uvfab Revenue Growth Rate in PCB Testing Services Business (2020-2025)
Figure 77. LSTPCB Revenue Growth Rate in PCB Testing Services Business (2020-2025)
Figure 78. Suntronic Inc Revenue Growth Rate in PCB Testing Services Business (2020-2025)
Figure 79. Bottom-up and Top-down Approaches for This Report
Figure 80. Data Triangulation
Figure 81. Key Executives Interviewed