List of Tables
Table 1. Batter Premixes Market Trends
Table 2. Batter Premixes Market Drivers & Opportunity
Table 3. Batter Premixes Market Challenges
Table 4. Batter Premixes Market Restraints
Table 5. Global Batter Premixes Revenue by Company (2019-2024) & (US$ Million)
Table 6. Global Batter Premixes Revenue Market Share by Company (2019-2024)
Table 7. Global Batter Premixes Sales Volume by Company (2019-2024) & (K MT)
Table 8. Global Batter Premixes Sales Volume Market Share by Company (2019-2024)
Table 9. Global Market Batter Premixes Price by Company (2019-2024) & (USD/MT)
Table 10. Key Manufacturers Batter Premixes Manufacturing Base Distribution and Headquarters
Table 11. Key Manufacturers Batter Premixes Product Type
Table 12. Key Manufacturers Time to Begin Mass Production of Batter Premixes
Table 13. Global Batter Premixes Manufacturers Market Concentration Ratio (CR5 and HHI)
Table 14. Global Top Manufacturers Market Share by Company Type (Tier 1, Tier 2, and Tier 3) & (based on the Revenue in Batter Premixes as of 2023)
Table 15. Mergers & Acquisitions, Expansion Plans
Table 16. Global Batter Premixes Sales Value by Type: 2019 VS 2023 VS 2030 (US$ Million)
Table 17. Global Batter Premixes Sales Value by Type (2019-2024) & (US$ Million)
Table 18. Global Batter Premixes Sales Value by Type (2025-2030) & (US$ Million)
Table 19. Global Batter Premixes Sales Market Share in Value by Type (2019-2024) & (%)
Table 20. Global Batter Premixes Sales Market Share in Value by Type (2025-2030) & (%)
Table 21. Global Batter Premixes Sales Volume by Type: 2019 VS 2023 VS 2030 (K MT)
Table 22. Global Batter Premixes Sales Volume by Type (2019-2024) & (K MT)
Table 23. Global Batter Premixes Sales Volume by Type (2025-2030) & (K MT)
Table 24. Global Batter Premixes Sales Market Share in Volume by Type (2019-2024) & (%)
Table 25. Global Batter Premixes Sales Market Share in Volume by Type (2025-2030) & (%)
Table 26. Global Batter Premixes Price by Type (2019-2024) & (USD/MT)
Table 27. Global Batter Premixes Price by Type (2025-2030) & (USD/MT)
Table 28. Global Batter Premixes Sales Value by Application: 2019 VS 2023 VS 2030 (US$ Million)
Table 29. Global Batter Premixes Sales Value by Application (2019-2024) & (US$ Million)
Table 30. Global Batter Premixes Sales Value by Application (2025-2030) & (US$ Million)
Table 31. Global Batter Premixes Sales Market Share in Value by Application (2019-2024) & (%)
Table 32. Global Batter Premixes Sales Market Share in Value by Application (2025-2030) & (%)
Table 33. Global Batter Premixes Sales Volume by Application: 2019 VS 2023 VS 2030 (K MT)
Table 34. Global Batter Premixes Sales Volume by Application (2019-2024) & (K MT)
Table 35. Global Batter Premixes Sales Volume by Application (2025-2030) & (K MT)
Table 36. Global Batter Premixes Sales Market Share in Volume by Application (2019-2024) & (%)
Table 37. Global Batter Premixes Sales Market Share in Volume by Application (2025-2030) & (%)
Table 38. Global Batter Premixes Price by Application (2019-2024) & (USD/MT)
Table 39. Global Batter Premixes Price by Application (2025-2030) & (USD/MT)
Table 40. Global Batter Premixes Sales Value by Region: 2019 VS 2023 VS 2030 (US$ Million)
Table 41. Global Batter Premixes Sales Value by Region (2019-2024) & (US$ Million)
Table 42. Global Batter Premixes Sales Value by Region (2025-2030) & (US$ Million)
Table 43. Global Batter Premixes Sales Value by Region (2019-2024) & (%)
Table 44. Global Batter Premixes Sales Value by Region (2025-2030) & (%)
Table 45. Global Batter Premixes Sales Volume by Region (K MT): 2019 VS 2023 VS 2030
Table 46. Global Batter Premixes Sales Volume by Region (2019-2024) & (K MT)
Table 47. Global Batter Premixes Sales Volume by Region (2025-2030) & (K MT)
Table 48. Global Batter Premixes Sales Volume by Region (2019-2024) & (%)
Table 49. Global Batter Premixes Sales Volume by Region (2025-2030) & (%)
Table 50. Global Batter Premixes Average Price by Region (2019-2024) & (USD/MT)
Table 51. Global Batter Premixes Average Price by Region (2025-2030) & (USD/MT)
Table 52. Key Countries/Regions Batter Premixes Sales Value Growth Trends, (US$ Million): 2019 VS 2023 VS 2030
Table 53. Key Countries/Regions Batter Premixes Sales Value, (2019-2024) & (US$ Million)
Table 54. Key Countries/Regions Batter Premixes Sales Value, (2025-2030) & (US$ Million)
Table 55. Key Countries/Regions Batter Premixes Sales Volume, (2019-2024) & (K MT)
Table 56. Key Countries/Regions Batter Premixes Sales Volume, (2025-2030) & (K MT)
Table 57. CSM Company Information
Table 58. CSM Introduction and Business Overview
Table 59. CSM Batter Premixes Sales (K MT), Revenue (US$ Million), Price (USD/MT) and Gross Margin (2019-2024)
Table 60. CSM Batter Premixes Product Offerings
Table 61. CSM Recent Development
Table 62. Zeelandia Company Information
Table 63. Zeelandia Introduction and Business Overview
Table 64. Zeelandia Batter Premixes Sales (K MT), Revenue (US$ Million), Price (USD/MT) and Gross Margin (2019-2024)
Table 65. Zeelandia Batter Premixes Product Offerings
Table 66. Zeelandia Recent Development
Table 67. Nippon Flour Mills Company Information
Table 68. Nippon Flour Mills Introduction and Business Overview
Table 69. Nippon Flour Mills Batter Premixes Sales (K MT), Revenue (US$ Million), Price (USD/MT) and Gross Margin (2019-2024)
Table 70. Nippon Flour Mills Batter Premixes Product Offerings
Table 71. Nippon Flour Mills Recent Development
Table 72. Puratos Company Information
Table 73. Puratos Introduction and Business Overview
Table 74. Puratos Batter Premixes Sales (K MT), Revenue (US$ Million), Price (USD/MT) and Gross Margin (2019-2024)
Table 75. Puratos Batter Premixes Product Offerings
Table 76. Puratos Recent Development
Table 77. IREKS Company Information
Table 78. IREKS Introduction and Business Overview
Table 79. IREKS Batter Premixes Sales (K MT), Revenue (US$ Million), Price (USD/MT) and Gross Margin (2019-2024)
Table 80. IREKS Batter Premixes Product Offerings
Table 81. IREKS Recent Development
Table 82. Bakel Company Information
Table 83. Bakel Introduction and Business Overview
Table 84. Bakel Batter Premixes Sales (K MT), Revenue (US$ Million), Price (USD/MT) and Gross Margin (2019-2024)
Table 85. Bakel Batter Premixes Product Offerings
Table 86. Bakel Recent Development
Table 87. Nisshin Seifun Company Information
Table 88. Nisshin Seifun Introduction and Business Overview
Table 89. Nisshin Seifun Batter Premixes Sales (K MT), Revenue (US$ Million), Price (USD/MT) and Gross Margin (2019-2024)
Table 90. Nisshin Seifun Batter Premixes Product Offerings
Table 91. Nisshin Seifun Recent Development
Table 92. Orangerie Company Information
Table 93. Orangerie Introduction and Business Overview
Table 94. Orangerie Batter Premixes Sales (K MT), Revenue (US$ Million), Price (USD/MT) and Gross Margin (2019-2024)
Table 95. Orangerie Batter Premixes Product Offerings
Table 96. Orangerie Recent Development
Table 97. Griffith Company Information
Table 98. Griffith Introduction and Business Overview
Table 99. Griffith Batter Premixes Sales (K MT), Revenue (US$ Million), Price (USD/MT) and Gross Margin (2019-2024)
Table 100. Griffith Batter Premixes Product Offerings
Table 101. Griffith Recent Development
Table 102. McCormick Company Information
Table 103. McCormick Introduction and Business Overview
Table 104. McCormick Batter Premixes Sales (K MT), Revenue (US$ Million), Price (USD/MT) and Gross Margin (2019-2024)
Table 105. McCormick Batter Premixes Product Offerings
Table 106. McCormick Recent Development
Table 107. Kerry Company Information
Table 108. Kerry Introduction and Business Overview
Table 109. Kerry Batter Premixes Sales (K MT), Revenue (US$ Million), Price (USD/MT) and Gross Margin (2019-2024)
Table 110. Kerry Batter Premixes Product Offerings
Table 111. Kerry Recent Development
Table 112. Prima Flour Company Information
Table 113. Prima Flour Introduction and Business Overview
Table 114. Prima Flour Batter Premixes Sales (K MT), Revenue (US$ Million), Price (USD/MT) and Gross Margin (2019-2024)
Table 115. Prima Flour Batter Premixes Product Offerings
Table 116. Prima Flour Recent Development
Table 117. Lam Soon Company Information
Table 118. Lam Soon Introduction and Business Overview
Table 119. Lam Soon Batter Premixes Sales (K MT), Revenue (US$ Million), Price (USD/MT) and Gross Margin (2019-2024)
Table 120. Lam Soon Batter Premixes Product Offerings
Table 121. Lam Soon Recent Development
Table 122. Yihai Kerry Company Information
Table 123. Yihai Kerry Introduction and Business Overview
Table 124. Yihai Kerry Batter Premixes Sales (K MT), Revenue (US$ Million), Price (USD/MT) and Gross Margin (2019-2024)
Table 125. Yihai Kerry Batter Premixes Product Offerings
Table 126. Yihai Kerry Recent Development
Table 127. PT Gandum Mas Kencana Company Information
Table 128. PT Gandum Mas Kencana Introduction and Business Overview
Table 129. PT Gandum Mas Kencana Batter Premixes Sales (K MT), Revenue (US$ Million), Price (USD/MT) and Gross Margin (2019-2024)
Table 130. PT Gandum Mas Kencana Batter Premixes Product Offerings
Table 131. PT Gandum Mas Kencana Recent Development
Table 132. AB Mauri Company Information
Table 133. AB Mauri Introduction and Business Overview
Table 134. AB Mauri Batter Premixes Sales (K MT), Revenue (US$ Million), Price (USD/MT) and Gross Margin (2019-2024)
Table 135. AB Mauri Batter Premixes Product Offerings
Table 136. AB Mauri Recent Development
Table 137. Rikevita Food Company Information
Table 138. Rikevita Food Introduction and Business Overview
Table 139. Rikevita Food Batter Premixes Sales (K MT), Revenue (US$ Million), Price (USD/MT) and Gross Margin (2019-2024)
Table 140. Rikevita Food Batter Premixes Product Offerings
Table 141. Rikevita Food Recent Development
Table 142. Showa Sangyo Company Information
Table 143. Showa Sangyo Introduction and Business Overview
Table 144. Showa Sangyo Batter Premixes Sales (K MT), Revenue (US$ Million), Price (USD/MT) and Gross Margin (2019-2024)
Table 145. Showa Sangyo Batter Premixes Product Offerings
Table 146. Showa Sangyo Recent Development
Table 147. AngelYeast Company Information
Table 148. AngelYeast Introduction and Business Overview
Table 149. AngelYeast Batter Premixes Sales (K MT), Revenue (US$ Million), Price (USD/MT) and Gross Margin (2019-2024)
Table 150. AngelYeast Batter Premixes Product Offerings
Table 151. AngelYeast Recent Development
Table 152. Pondan Pangan Makmur Indonesia (PPMI) Company Information
Table 153. Pondan Pangan Makmur Indonesia (PPMI) Introduction and Business Overview
Table 154. Pondan Pangan Makmur Indonesia (PPMI) Batter Premixes Sales (K MT), Revenue (US$ Million), Price (USD/MT) and Gross Margin (2019-2024)
Table 155. Pondan Pangan Makmur Indonesia (PPMI) Batter Premixes Product Offerings
Table 156. Pondan Pangan Makmur Indonesia (PPMI) Recent Development
Table 157. Key Raw Materials Lists
Table 158. Raw Materials Key Suppliers Lists
Table 159. Batter Premixes Downstream Customers
Table 160. Batter Premixes Distributors List
Table 161. Research Programs/Design for This Report
Table 162. Key Data Information from Secondary Sources
Table 163. Key Data Information from Primary Sources
List of Figures
Figure 1. Batter Premixes Product Picture
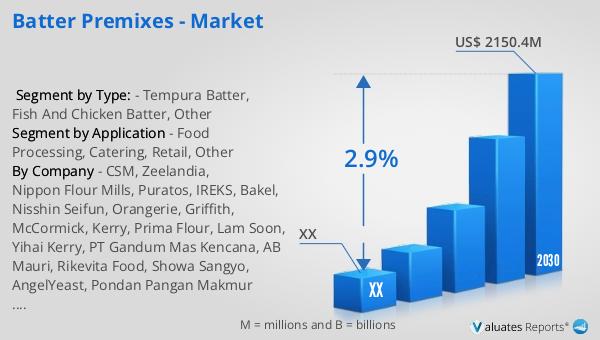
Figure 2. Global Batter Premixes Sales Value, 2019 VS 2023 VS 2030 (US$ Million)
Figure 3. Global Batter Premixes Sales Value (2019-2030) & (US$ Million)
Figure 4. Global Batter Premixes Sales Volume (2019-2030) & (K MT)
Figure 5. Global Batter Premixes Sales Price (2019-2030) & (USD/MT)
Figure 6. Batter Premixes Report Years Considered
Figure 7. Global Batter Premixes Players Revenue Ranking (2023) & (US$ Million)
Figure 8. Global Batter Premixes Players Sales Volume Ranking (2023) & (K MT)
Figure 9. The 5 and 10 Largest Manufacturers in the World: Market Share by Batter Premixes Revenue in 2023
Figure 10. Batter Premixes Market Share by Company Type (Tier 1, Tier 2, and Tier 3): 2019 VS 2023
Figure 11. Tempura Batter Picture
Figure 12. Fish And Chicken Batter Picture
Figure 13. Other Picture
Figure 14. Global Batter Premixes Sales Value by Type (2019 VS 2023 VS 2030) & (US$ Million)
Figure 15. Global Batter Premixes Sales Value Market Share by Type, 2023 & 2030
Figure 16. Global Batter Premixes Sales Volume by Type (2019 VS 2023 VS 2030) & (K MT)
Figure 17. Global Batter Premixes Sales Volume Market Share by Type, 2023 & 2030
Figure 18. Global Batter Premixes Price by Type (2019-2030) & (USD/MT)
Figure 19. Product Picture of Food Processing
Figure 20. Product Picture of Catering
Figure 21. Product Picture of Retail
Figure 22. Product Picture of Other
Figure 23. Global Batter Premixes Sales Value by Application (2019 VS 2023 VS 2030) & (US$ Million)
Figure 24. Global Batter Premixes Sales Value Market Share by Application, 2023 & 2030
Figure 25. Global Batter Premixes Sales Volume by Application (2019 VS 2023 VS 2030) & (K MT)
Figure 26. Global Batter Premixes Sales Volume Market Share by Application, 2023 & 2030
Figure 27. Global Batter Premixes Price by Application (2019-2030) & (USD/MT)
Figure 28. North America Batter Premixes Sales Value (2019-2030) & (US$ Million)
Figure 29. North America Batter Premixes Sales Value by Country (%), 2023 VS 2030
Figure 30. Europe Batter Premixes Sales Value (2019-2030) & (US$ Million)
Figure 31. Europe Batter Premixes Sales Value by Country (%), 2023 VS 2030
Figure 32. Asia Pacific Batter Premixes Sales Value (2019-2030) & (US$ Million)
Figure 33. Asia Pacific Batter Premixes Sales Value by Country (%), 2023 VS 2030
Figure 34. South America Batter Premixes Sales Value (2019-2030) & (US$ Million)
Figure 35. South America Batter Premixes Sales Value by Country (%), 2023 VS 2030
Figure 36. Middle East & Africa Batter Premixes Sales Value (2019-2030) & (US$ Million)
Figure 37. Middle East & Africa Batter Premixes Sales Value by Country (%), 2023 VS 2030
Figure 38. Key Countries/Regions Batter Premixes Sales Value (%), (2019-2030)
Figure 39. Key Countries/Regions Batter Premixes Sales Volume (%), (2019-2030)
Figure 40. United States Batter Premixes Sales Value, (2019-2030) & (US$ Million)
Figure 41. United States Batter Premixes Sales Value by Type (%), 2023 VS 2030
Figure 42. United States Batter Premixes Sales Value by Application (%), 2023 VS 2030
Figure 43. Europe Batter Premixes Sales Value, (2019-2030) & (US$ Million)
Figure 44. Europe Batter Premixes Sales Value by Type (%), 2023 VS 2030
Figure 45. Europe Batter Premixes Sales Value by Application (%), 2023 VS 2030
Figure 46. China Batter Premixes Sales Value, (2019-2030) & (US$ Million)
Figure 47. China Batter Premixes Sales Value by Type (%), 2023 VS 2030
Figure 48. China Batter Premixes Sales Value by Application (%), 2023 VS 2030
Figure 49. Japan Batter Premixes Sales Value, (2019-2030) & (US$ Million)
Figure 50. Japan Batter Premixes Sales Value by Type (%), 2023 VS 2030
Figure 51. Japan Batter Premixes Sales Value by Application (%), 2023 VS 2030
Figure 52. South Korea Batter Premixes Sales Value, (2019-2030) & (US$ Million)
Figure 53. South Korea Batter Premixes Sales Value by Type (%), 2023 VS 2030
Figure 54. South Korea Batter Premixes Sales Value by Application (%), 2023 VS 2030
Figure 55. Southeast Asia Batter Premixes Sales Value, (2019-2030) & (US$ Million)
Figure 56. Southeast Asia Batter Premixes Sales Value by Type (%), 2023 VS 2030
Figure 57. Southeast Asia Batter Premixes Sales Value by Application (%), 2023 VS 2030
Figure 58. India Batter Premixes Sales Value, (2019-2030) & (US$ Million)
Figure 59. India Batter Premixes Sales Value by Type (%), 2023 VS 2030
Figure 60. India Batter Premixes Sales Value by Application (%), 2023 VS 2030
Figure 61. Batter Premixes Industrial Chain
Figure 62. Batter Premixes Manufacturing Cost Structure
Figure 63. Channels of Distribution (Direct Sales, and Distribution)
Figure 64. Bottom-up and Top-down Approaches for This Report
Figure 65. Data Triangulation
Figure 66. Key Executives Interviewed