1 Market Overview
1.1 Synthetic Polymer Waterproofing Membrane Product Introduction
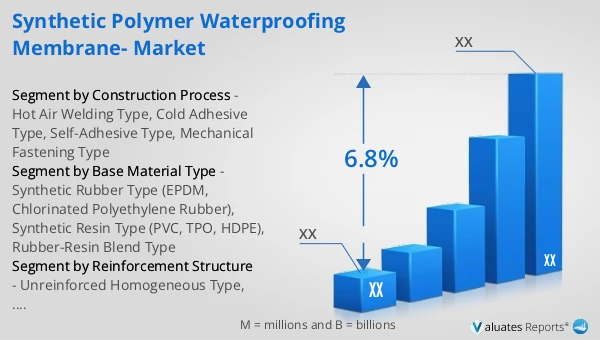
1.2 Global Synthetic Polymer Waterproofing Membrane Market Size Forecast
1.2.1 Global Synthetic Polymer Waterproofing Membrane Sales Value (2021–2032)
1.2.2 Global Synthetic Polymer Waterproofing Membrane Sales Volume (2021–2032)
1.2.3 Global Synthetic Polymer Waterproofing Membrane Sales Price (2021–2032)
1.3 Synthetic Polymer Waterproofing Membrane Market Trends & Drivers
1.3.1 Synthetic Polymer Waterproofing Membrane Industry Trends
1.3.2 Synthetic Polymer Waterproofing Membrane Market Drivers & Opportunities
1.3.3 Synthetic Polymer Waterproofing Membrane Market Challenges
1.3.4 Synthetic Polymer Waterproofing Membrane Market Restraints
1.3.5 Impact of U.S. Tariffs
1.4 Assumptions and Limitations
1.5 Study Objectives
1.6 Years Considered
2 Competitive Analysis by Company
2.1 Global Synthetic Polymer Waterproofing Membrane Players Revenue Ranking (2025)
2.2 Global Synthetic Polymer Waterproofing Membrane Revenue by Company (2021–2026)
2.3 Global Synthetic Polymer Waterproofing Membrane Sales Volume Ranking of Players (2025)
2.4 Global Synthetic Polymer Waterproofing Membrane Sales Volume by Company (2021–2026)
2.5 Global Synthetic Polymer Waterproofing Membrane Average Price by Company (2021–2026)
2.6 Key Manufacturers Synthetic Polymer Waterproofing Membrane Manufacturing Base and Headquarters
2.7 Key Manufacturers Synthetic Polymer Waterproofing Membrane Product Offerings
2.8 Key Manufacturers Start of Mass Production of Synthetic Polymer Waterproofing Membrane
2.9 Synthetic Polymer Waterproofing Membrane Market Competitive Analysis
2.9.1 Synthetic Polymer Waterproofing Membrane Market Concentration Rate (2021–2026)
2.9.2 Global 5 and 10 Largest Manufacturers by Synthetic Polymer Waterproofing Membrane Revenue in 2025
2.9.3 Global Companies by Tier (Tier 1, Tier 2, Tier 3), based on Synthetic Polymer Waterproofing Membrane revenue, 2025
2.10 Mergers & Acquisitions and Expansion
3 Segmentation Synthetic Polymer Waterproofing Membrane Market Classification
3.1 Introduction by Base Material Type
3.1.1 Synthetic Rubber Type (EPDM, Chlorinated Polyethylene Rubber)
3.1.2 Synthetic Resin Type (PVC, TPO, HDPE)
3.1.3 Rubber-Resin Blend Type
3.1.4 Global Synthetic Polymer Waterproofing Membrane Sales Value by Base Material Type
3.1.4.1 Global Synthetic Polymer Waterproofing Membrane Sales Value by Base Material Type (2021 vs 2025 vs 2032)
3.1.4.2 Global Synthetic Polymer Waterproofing Membrane Sales Value, by Base Material Type (2021–2032)
3.1.4.3 Global Synthetic Polymer Waterproofing Membrane Sales Value, by Base Material Type (%), 2021–2032
3.1.5 Global Synthetic Polymer Waterproofing Membrane Sales Volume by Base Material Type
3.1.5.1 Global Synthetic Polymer Waterproofing Membrane Sales Volume by Base Material Type (2021 vs 2025 vs 2032)
3.1.5.2 Global Synthetic Polymer Waterproofing Membrane Sales Volume, by Base Material Type (2021–2032)
3.1.5.3 Global Synthetic Polymer Waterproofing Membrane Sales Volume, by Base Material Type (%), 2021–2032
3.1.6 Global Synthetic Polymer Waterproofing Membrane Average Price by Base Material Type (2021–2032)
3.2 Introduction by Reinforcement Structure
3.2.1 Unreinforced Homogeneous Type
3.2.2 Internal Reinforced Type (Fiberglass Mesh, Polyester Felt)
3.2.3 Composite Backing Type
3.2.4 Global Synthetic Polymer Waterproofing Membrane Sales Value by Reinforcement Structure
3.2.4.1 Global Synthetic Polymer Waterproofing Membrane Sales Value by Reinforcement Structure (2021 vs 2025 vs 2032)
3.2.4.2 Global Synthetic Polymer Waterproofing Membrane Sales Value, by Reinforcement Structure (2021–2032)
3.2.4.3 Global Synthetic Polymer Waterproofing Membrane Sales Value, by Reinforcement Structure (%), 2021–2032
3.2.5 Global Synthetic Polymer Waterproofing Membrane Sales Volume by Reinforcement Structure
3.2.5.1 Global Synthetic Polymer Waterproofing Membrane Sales Volume by Reinforcement Structure (2021 vs 2025 vs 2032)
3.2.5.2 Global Synthetic Polymer Waterproofing Membrane Sales Volume, by Reinforcement Structure (2021–2032)
3.2.5.3 Global Synthetic Polymer Waterproofing Membrane Sales Volume, by Reinforcement Structure (%), 2021–2032
3.2.6 Global Synthetic Polymer Waterproofing Membrane Average Price by Reinforcement Structure (2021–2032)
3.3 Introduction by Construction Process
3.3.1 Hot Air Welding Type
3.3.2 Cold Adhesive Type
3.3.3 Self-Adhesive Type
3.3.4 Mechanical Fastening Type
3.3.5 Global Synthetic Polymer Waterproofing Membrane Sales Value by Construction Process
3.3.5.1 Global Synthetic Polymer Waterproofing Membrane Sales Value by Construction Process (2021 vs 2025 vs 2032)
3.3.5.2 Global Synthetic Polymer Waterproofing Membrane Sales Value, by Construction Process (2021–2032)
3.3.5.3 Global Synthetic Polymer Waterproofing Membrane Sales Value, by Construction Process (%), 2021–2032
3.3.6 Global Synthetic Polymer Waterproofing Membrane Sales Volume by Construction Process
3.3.6.1 Global Synthetic Polymer Waterproofing Membrane Sales Volume by Construction Process (2021 vs 2025 vs 2032)
3.3.6.2 Global Synthetic Polymer Waterproofing Membrane Sales Volume, by Construction Process (2021–2032)
3.3.6.3 Global Synthetic Polymer Waterproofing Membrane Sales Volume, by Construction Process (%), 2021–2032
3.3.7 Global Synthetic Polymer Waterproofing Membrane Average Price by Construction Process (2021–2032)
4 Segmentation by Application
4.1 Introduction by Application
4.1.1 Residential Building
4.1.2 Commercial & Public Building
4.1.3 Industrial Plant
4.1.4 Infrastructure Engineering
4.1.5 Others
4.2 Global Synthetic Polymer Waterproofing Membrane Sales Value by Application
4.2.1 Global Synthetic Polymer Waterproofing Membrane Sales Value by Application (2021 vs 2025 vs 2032)
4.2.2 Global Synthetic Polymer Waterproofing Membrane Sales Value, by Application (2021–2032)
4.2.3 Global Synthetic Polymer Waterproofing Membrane Sales Value, by Application (%), 2021–2032
4.3 Global Synthetic Polymer Waterproofing Membrane Sales Volume by Application
4.3.1 Global Synthetic Polymer Waterproofing Membrane Sales Volume by Application (2021 vs 2025 vs 2032)
4.3.2 Global Synthetic Polymer Waterproofing Membrane Sales Volume, by Application (2021–2032)
4.3.3 Global Synthetic Polymer Waterproofing Membrane Sales Volume, by Application (%), 2021–2032
4.4 Global Synthetic Polymer Waterproofing Membrane Average Price by Application (2021–2032)
5 Segmentation by Region
5.1 Global Synthetic Polymer Waterproofing Membrane Sales Value by Region
5.1.1 Global Synthetic Polymer Waterproofing Membrane Sales Value by Region: 2021 vs 2025 vs 2032
5.1.2 Global Synthetic Polymer Waterproofing Membrane Sales Value by Region (2021–2026)
5.1.3 Global Synthetic Polymer Waterproofing Membrane Sales Value by Region (2027–2032)
5.1.4 Global Synthetic Polymer Waterproofing Membrane Sales Value by Region (%), 2021–2032
5.2 Global Synthetic Polymer Waterproofing Membrane Sales Volume by Region
5.2.1 Global Synthetic Polymer Waterproofing Membrane Sales Volume by Region: 2021 vs 2025 vs 2032
5.2.2 Global Synthetic Polymer Waterproofing Membrane Sales Volume by Region (2021–2026)
5.2.3 Global Synthetic Polymer Waterproofing Membrane Sales Volume by Region (2027–2032)
5.2.4 Global Synthetic Polymer Waterproofing Membrane Sales Volume by Region (%), 2021–2032
5.3 Global Synthetic Polymer Waterproofing Membrane Average Price by Region (2021–2032)
5.4 North America
5.4.1 North America Synthetic Polymer Waterproofing Membrane Sales Value, 2021–2032
5.4.2 North America Synthetic Polymer Waterproofing Membrane Sales Value by Country (%), 2025 vs 2032
5.5 Europe
5.5.1 Europe Synthetic Polymer Waterproofing Membrane Sales Value, 2021–2032
5.5.2 Europe Synthetic Polymer Waterproofing Membrane Sales Value by Country (%), 2025 vs 2032
5.6 Asia Pacific
5.6.1 Asia Pacific Synthetic Polymer Waterproofing Membrane Sales Value, 2021–2032
5.6.2 Asia Pacific Synthetic Polymer Waterproofing Membrane Sales Value by Region (%), 2025 vs 2032
5.7 South America
5.7.1 South America Synthetic Polymer Waterproofing Membrane Sales Value, 2021–2032
5.7.2 South America Synthetic Polymer Waterproofing Membrane Sales Value by Country (%), 2025 vs 2032
5.8 Middle East & Africa
5.8.1 Middle East & Africa Synthetic Polymer Waterproofing Membrane Sales Value, 2021–2032
5.8.2 Middle East & Africa Synthetic Polymer Waterproofing Membrane Sales Value by Country (%), 2025 vs 2032
6 Segmentation by Key Countries/Regions
6.1 Key Countries/Regions Synthetic Polymer Waterproofing Membrane Sales Value Growth Trends, 2021 vs 2025 vs 2032
6.2 Key Countries/Regions Synthetic Polymer Waterproofing Membrane Sales Value and Sales Volume
6.2.1 Key Countries/Regions Synthetic Polymer Waterproofing Membrane Sales Value, 2021–2032
6.2.2 Key Countries/Regions Synthetic Polymer Waterproofing Membrane Sales Volume, 2021–2032
6.3 United States
6.3.1 United States Synthetic Polymer Waterproofing Membrane Sales Value, 2021–2032
6.3.2 United States Synthetic Polymer Waterproofing Membrane Sales Value by Base Material Type (%), 2025 vs 2032
6.3.3 United States Synthetic Polymer Waterproofing Membrane Sales Value by Application, 2025 vs 2032
6.4 Europe
6.4.1 Europe Synthetic Polymer Waterproofing Membrane Sales Value, 2021–2032
6.4.2 Europe Synthetic Polymer Waterproofing Membrane Sales Value by Base Material Type (%), 2025 vs 2032
6.4.3 Europe Synthetic Polymer Waterproofing Membrane Sales Value by Application, 2025 vs 2032
6.5 China
6.5.1 China Synthetic Polymer Waterproofing Membrane Sales Value, 2021–2032
6.5.2 China Synthetic Polymer Waterproofing Membrane Sales Value by Base Material Type (%), 2025 vs 2032
6.5.3 China Synthetic Polymer Waterproofing Membrane Sales Value by Application, 2025 vs 2032
6.6 Japan
6.6.1 Japan Synthetic Polymer Waterproofing Membrane Sales Value, 2021–2032
6.6.2 Japan Synthetic Polymer Waterproofing Membrane Sales Value by Base Material Type (%), 2025 vs 2032
6.6.3 Japan Synthetic Polymer Waterproofing Membrane Sales Value by Application, 2025 vs 2032
6.7 South Korea
6.7.1 South Korea Synthetic Polymer Waterproofing Membrane Sales Value, 2021–2032
6.7.2 South Korea Synthetic Polymer Waterproofing Membrane Sales Value by Base Material Type (%), 2025 vs 2032
6.7.3 South Korea Synthetic Polymer Waterproofing Membrane Sales Value by Application, 2025 vs 2032
6.8 Southeast Asia
6.8.1 Southeast Asia Synthetic Polymer Waterproofing Membrane Sales Value, 2021–2032
6.8.2 Southeast Asia Synthetic Polymer Waterproofing Membrane Sales Value by Base Material Type (%), 2025 vs 2032
6.8.3 Southeast Asia Synthetic Polymer Waterproofing Membrane Sales Value by Application, 2025 vs 2032
6.9 India
6.9.1 India Synthetic Polymer Waterproofing Membrane Sales Value, 2021–2032
6.9.2 India Synthetic Polymer Waterproofing Membrane Sales Value by Base Material Type (%), 2025 vs 2032
6.9.3 India Synthetic Polymer Waterproofing Membrane Sales Value by Application, 2025 vs 2032
7 Company Profiles
7.1 Soprema Group
7.1.1 Soprema Group Company Information
7.1.2 Soprema Group Introduction and Business Overview
7.1.3 Soprema Group Synthetic Polymer Waterproofing Membrane Sales, Revenue, Price and Gross Margin (2021–2026)
7.1.4 Soprema Group Synthetic Polymer Waterproofing Membrane Product Offerings
7.1.5 Soprema Group Recent Developments
7.2 Sika
7.2.1 Sika Company Information
7.2.2 Sika Introduction and Business Overview
7.2.3 Sika Synthetic Polymer Waterproofing Membrane Sales, Revenue, Price and Gross Margin (2021–2026)
7.2.4 Sika Synthetic Polymer Waterproofing Membrane Product Offerings
7.2.5 Sika Recent Developments
7.3 Fosroc
7.3.1 Fosroc Company Information
7.3.2 Fosroc Introduction and Business Overview
7.3.3 Fosroc Synthetic Polymer Waterproofing Membrane Sales, Revenue, Price and Gross Margin (2021–2026)
7.3.4 Fosroc Synthetic Polymer Waterproofing Membrane Product Offerings
7.3.5 Fosroc Recent Developments
7.4 Standard Industries
7.4.1 Standard Industries Company Information
7.4.2 Standard Industries Introduction and Business Overview
7.4.3 Standard Industries Synthetic Polymer Waterproofing Membrane Sales, Revenue, Price and Gross Margin (2021–2026)
7.4.4 Standard Industries Synthetic Polymer Waterproofing Membrane Product Offerings
7.4.5 Standard Industries Recent Developments
7.5 TehnoNICOL
7.5.1 TehnoNICOL Company Information
7.5.2 TehnoNICOL Introduction and Business Overview
7.5.3 TehnoNICOL Synthetic Polymer Waterproofing Membrane Sales, Revenue, Price and Gross Margin (2021–2026)
7.5.4 TehnoNICOL Synthetic Polymer Waterproofing Membrane Product Offerings
7.5.5 TehnoNICOL Recent Developments
7.6 Mapei
7.6.1 Mapei Company Information
7.6.2 Mapei Introduction and Business Overview
7.6.3 Mapei Synthetic Polymer Waterproofing Membrane Sales, Revenue, Price and Gross Margin (2021–2026)
7.6.4 Mapei Synthetic Polymer Waterproofing Membrane Product Offerings
7.6.5 Mapei Recent Developments
7.7 Carlisle
7.7.1 Carlisle Company Information
7.7.2 Carlisle Introduction and Business Overview
7.7.3 Carlisle Synthetic Polymer Waterproofing Membrane Sales, Revenue, Price and Gross Margin (2021–2026)
7.7.4 Carlisle Synthetic Polymer Waterproofing Membrane Product Offerings
7.7.5 Carlisle Recent Developments
7.8 Renolit
7.8.1 Renolit Company Information
7.8.2 Renolit Introduction and Business Overview
7.8.3 Renolit Synthetic Polymer Waterproofing Membrane Sales, Revenue, Price and Gross Margin (2021–2026)
7.8.4 Renolit Synthetic Polymer Waterproofing Membrane Product Offerings
7.8.5 Renolit Recent Developments
7.9 Schluter-Systems
7.9.1 Schluter-Systems Company Information
7.9.2 Schluter-Systems Introduction and Business Overview
7.9.3 Schluter-Systems Synthetic Polymer Waterproofing Membrane Sales, Revenue, Price and Gross Margin (2021–2026)
7.9.4 Schluter-Systems Synthetic Polymer Waterproofing Membrane Product Offerings
7.9.5 Schluter-Systems Recent Developments
7.10 Protecto Wrap
7.10.1 Protecto Wrap Company Information
7.10.2 Protecto Wrap Introduction and Business Overview
7.10.3 Protecto Wrap Synthetic Polymer Waterproofing Membrane Sales, Revenue, Price and Gross Margin (2021–2026)
7.10.4 Protecto Wrap Synthetic Polymer Waterproofing Membrane Product Offerings
7.10.5 Protecto Wrap Recent Developments
7.11 Grace
7.11.1 Grace Company Information
7.11.2 Grace Introduction and Business Overview
7.11.3 Grace Synthetic Polymer Waterproofing Membrane Sales, Revenue, Price and Gross Margin (2021–2026)
7.11.4 Grace Synthetic Polymer Waterproofing Membrane Product Offerings
7.11.5 Grace Recent Developments
7.12 Multiplan Yalıtım
7.12.1 Multiplan Yalıtım Company Information
7.12.2 Multiplan Yalıtım Introduction and Business Overview
7.12.3 Multiplan Yalıtım Synthetic Polymer Waterproofing Membrane Sales, Revenue, Price and Gross Margin (2021–2026)
7.12.4 Multiplan Yalıtım Synthetic Polymer Waterproofing Membrane Product Offerings
7.12.5 Multiplan Yalıtım Recent Developments
7.13 Oriental Yuhong
7.13.1 Oriental Yuhong Company Information
7.13.2 Oriental Yuhong Introduction and Business Overview
7.13.3 Oriental Yuhong Synthetic Polymer Waterproofing Membrane Sales, Revenue, Price and Gross Margin (2021–2026)
7.13.4 Oriental Yuhong Synthetic Polymer Waterproofing Membrane Product Offerings
7.13.5 Oriental Yuhong Recent Developments
7.14 CKS
7.14.1 CKS Company Information
7.14.2 CKS Introduction and Business Overview
7.14.3 CKS Synthetic Polymer Waterproofing Membrane Sales, Revenue, Price and Gross Margin (2021–2026)
7.14.4 CKS Synthetic Polymer Waterproofing Membrane Product Offerings
7.14.5 CKS Recent Developments
7.15 Hongyuan Waterproof
7.15.1 Hongyuan Waterproof Company Information
7.15.2 Hongyuan Waterproof Introduction and Business Overview
7.15.3 Hongyuan Waterproof Synthetic Polymer Waterproofing Membrane Sales, Revenue, Price and Gross Margin (2021–2026)
7.15.4 Hongyuan Waterproof Synthetic Polymer Waterproofing Membrane Product Offerings
7.15.5 Hongyuan Waterproof Recent Developments
7.16 Tangshan Desheng
7.16.1 Tangshan Desheng Company Information
7.16.2 Tangshan Desheng Introduction and Business Overview
7.16.3 Tangshan Desheng Synthetic Polymer Waterproofing Membrane Sales, Revenue, Price and Gross Margin (2021–2026)
7.16.4 Tangshan Desheng Synthetic Polymer Waterproofing Membrane Product Offerings
7.16.5 Tangshan Desheng Recent Developments
7.17 Duro-Last
7.17.1 Duro-Last Company Information
7.17.2 Duro-Last Introduction and Business Overview
7.17.3 Duro-Last Synthetic Polymer Waterproofing Membrane Sales, Revenue, Price and Gross Margin (2021–2026)
7.17.4 Duro-Last Synthetic Polymer Waterproofing Membrane Product Offerings
7.17.5 Duro-Last Recent Developments
7.18 Elevate
7.18.1 Elevate Company Information
7.18.2 Elevate Introduction and Business Overview
7.18.3 Elevate Synthetic Polymer Waterproofing Membrane Sales, Revenue, Price and Gross Margin (2021–2026)
7.18.4 Elevate Synthetic Polymer Waterproofing Membrane Product Offerings
7.18.5 Elevate Recent Developments
7.19 TECHNONICOL
7.19.1 TECHNONICOL Company Information
7.19.2 TECHNONICOL Introduction and Business Overview
7.19.3 TECHNONICOL Synthetic Polymer Waterproofing Membrane Sales, Revenue, Price and Gross Margin (2021–2026)
7.19.4 TECHNONICOL Synthetic Polymer Waterproofing Membrane Product Offerings
7.19.5 TECHNONICOL Recent Developments
7.20 Bauder
7.20.1 Bauder Company Information
7.20.2 Bauder Introduction and Business Overview
7.20.3 Bauder Synthetic Polymer Waterproofing Membrane Sales, Revenue, Price and Gross Margin (2021–2026)
7.20.4 Bauder Synthetic Polymer Waterproofing Membrane Product Offerings
7.20.5 Bauder Recent Developments
7.21 Johns Manville
7.21.1 Johns Manville Company Information
7.21.2 Johns Manville Introduction and Business Overview
7.21.3 Johns Manville Synthetic Polymer Waterproofing Membrane Sales, Revenue, Price and Gross Margin (2021–2026)
7.21.4 Johns Manville Synthetic Polymer Waterproofing Membrane Product Offerings
7.21.5 Johns Manville Recent Developments
8 Industry Chain Analysis
8.1 Synthetic Polymer Waterproofing Membrane Industrial Chain
8.2 Synthetic Polymer Waterproofing Membrane Upstream Analysis
8.2.1 Key Raw Materials
8.2.2 Key Suppliers of Raw Materials
8.2.3 Manufacturing Cost Structure
8.3 Midstream Analysis
8.4 Downstream Analysis (Customer Analysis)
8.5 Sales Model and Sales Channelss
8.5.1 Synthetic Polymer Waterproofing Membrane Sales Model
8.5.2 Sales Channels
8.5.3 Synthetic Polymer Waterproofing Membrane Distributors
9 Research Findings and Conclusion
10 Appendix
10.1 Research Methodology
10.1.1 Methodology/Research Approach
10.1.1.1 Research Programs/Design
10.1.1.2 Market Size Estimation
10.1.1.3 Market Breakdown and Data Triangulation
10.1.2 Data Source
10.1.2.1 Secondary Sources
10.1.2.2 Primary Sources
10.2 Author Details
10.3 Disclaimer