List of Tables
Table 1. Global Smart Waste Management Solutions with IoT Sensors Market Size Growth Rate by Type (US$ Million): 2020 VS 2024 VS 2031
Table 2. Key Players of IoT Sensors
Table 3. Key Players of Software and Service
Table 4. Key Players of Other Hardware Devices
Table 5. Global Smart Waste Management Solutions with IoT Sensors Market Size Growth Rate by Sensor Type (US$ Million): 2020 VS 2024 VS 2031
Table 6. Key Players of Ultrasonic Sensors
Table 7. Key Players of Non-ultrasonic Type
Table 8. Global Smart Waste Management Solutions with IoT Sensors Market Size Growth Rate by Power & Energy Mode (US$ Million): 2020 VS 2024 VS 2031
Table 9. Key Players of Battery-powered
Table 10. Key Players of Solar-powered
Table 11. Key Players of Others
Table 12. Global Smart Waste Management Solutions with IoT Sensors Market Size Growth by Application (US$ Million): 2020 VS 2024 VS 2031
Table 13. Global Smart Waste Management Solutions with IoT Sensors Market Size by Region (US$ Million): 2020 VS 2024 VS 2031
Table 14. Global Smart Waste Management Solutions with IoT Sensors Market Size by Region (2020-2025) & (US$ Million)
Table 15. Global Smart Waste Management Solutions with IoT Sensors Market Share by Region (2020-2025)
Table 16. Global Smart Waste Management Solutions with IoT Sensors Forecasted Market Size by Region (2026-2031) & (US$ Million)
Table 17. Global Smart Waste Management Solutions with IoT Sensors Market Share by Region (2026-2031)
Table 18. Smart Waste Management Solutions with IoT Sensors Market Trends
Table 19. Smart Waste Management Solutions with IoT Sensors Market Drivers
Table 20. Smart Waste Management Solutions with IoT Sensors Market Challenges
Table 21. Smart Waste Management Solutions with IoT Sensors Market Restraints
Table 22. Global Smart Waste Management Solutions with IoT Sensors Revenue by Players (2020-2025) & (US$ Million)
Table 23. Global Smart Waste Management Solutions with IoT Sensors Market Share by Players (2020-2025)
Table 24. Global Top Smart Waste Management Solutions with IoT Sensors Players by Company Type (Tier 1, Tier 2, and Tier 3) & (based on the Revenue in Smart Waste Management Solutions with IoT Sensors as of 2024)
Table 25. Ranking of Global Top Smart Waste Management Solutions with IoT Sensors Companies by Revenue (US$ Million) in 2024
Table 26. Global 5 Largest Players Market Share by Smart Waste Management Solutions with IoT Sensors Revenue (CR5 and HHI) & (2020-2025)
Table 27. Global Key Players of Smart Waste Management Solutions with IoT Sensors, Headquarters and Area Served
Table 28. Global Key Players of Smart Waste Management Solutions with IoT Sensors, Product and Application
Table 29. Global Key Players of Smart Waste Management Solutions with IoT Sensors, Date of Enter into This Industry
Table 30. Mergers & Acquisitions, Expansion Plans
Table 31. Global Smart Waste Management Solutions with IoT Sensors Market Size by Type (2020-2025) & (US$ Million)
Table 32. Global Smart Waste Management Solutions with IoT Sensors Revenue Market Share by Type (2020-2025)
Table 33. Global Smart Waste Management Solutions with IoT Sensors Forecasted Market Size by Type (2026-2031) & (US$ Million)
Table 34. Global Smart Waste Management Solutions with IoT Sensors Revenue Market Share by Type (2026-2031)
Table 35. Global Smart Waste Management Solutions with IoT Sensors Market Size by Application (2020-2025) & (US$ Million)
Table 36. Global Smart Waste Management Solutions with IoT Sensors Revenue Market Share by Application (2020-2025)
Table 37. Global Smart Waste Management Solutions with IoT Sensors Forecasted Market Size by Application (2026-2031) & (US$ Million)
Table 38. Global Smart Waste Management Solutions with IoT Sensors Revenue Market Share by Application (2026-2031)
Table 39. North America Smart Waste Management Solutions with IoT Sensors Market Size Growth Rate by Country (US$ Million): 2020 VS 2024 VS 2031
Table 40. North America Smart Waste Management Solutions with IoT Sensors Market Size by Country (2020-2025) & (US$ Million)
Table 41. North America Smart Waste Management Solutions with IoT Sensors Market Size by Country (2026-2031) & (US$ Million)
Table 42. Europe Smart Waste Management Solutions with IoT Sensors Market Size Growth Rate by Country (US$ Million): 2020 VS 2024 VS 2031
Table 43. Europe Smart Waste Management Solutions with IoT Sensors Market Size by Country (2020-2025) & (US$ Million)
Table 44. Europe Smart Waste Management Solutions with IoT Sensors Market Size by Country (2026-2031) & (US$ Million)
Table 45. Asia-Pacific Smart Waste Management Solutions with IoT Sensors Market Size Growth Rate by Region (US$ Million): 2020 VS 2024 VS 2031
Table 46. Asia-Pacific Smart Waste Management Solutions with IoT Sensors Market Size by Region (2020-2025) & (US$ Million)
Table 47. Asia-Pacific Smart Waste Management Solutions with IoT Sensors Market Size by Region (2026-2031) & (US$ Million)
Table 48. Latin America Smart Waste Management Solutions with IoT Sensors Market Size Growth Rate by Country (US$ Million): 2020 VS 2024 VS 2031
Table 49. Latin America Smart Waste Management Solutions with IoT Sensors Market Size by Country (2020-2025) & (US$ Million)
Table 50. Latin America Smart Waste Management Solutions with IoT Sensors Market Size by Country (2026-2031) & (US$ Million)
Table 51. Middle East & Africa Smart Waste Management Solutions with IoT Sensors Market Size Growth Rate by Country (US$ Million): 2020 VS 2024 VS 2031
Table 52. Middle East & Africa Smart Waste Management Solutions with IoT Sensors Market Size by Country (2020-2025) & (US$ Million)
Table 53. Middle East & Africa Smart Waste Management Solutions with IoT Sensors Market Size by Country (2026-2031) & (US$ Million)
Table 54. Waste Vision Company Details
Table 55. Waste Vision Business Overview
Table 56. Waste Vision Smart Waste Management Solutions with IoT Sensors Product
Table 57. Waste Vision Revenue in Smart Waste Management Solutions with IoT Sensors Business (2020-2025) & (US$ Million)
Table 58. Waste Vision Recent Development
Table 59. RecycleSmart Company Details
Table 60. RecycleSmart Business Overview
Table 61. RecycleSmart Smart Waste Management Solutions with IoT Sensors Product
Table 62. RecycleSmart Revenue in Smart Waste Management Solutions with IoT Sensors Business (2020-2025) & (US$ Million)
Table 63. RecycleSmart Recent Development
Table 64. Bell Company Details
Table 65. Bell Business Overview
Table 66. Bell Smart Waste Management Solutions with IoT Sensors Product
Table 67. Bell Revenue in Smart Waste Management Solutions with IoT Sensors Business (2020-2025) & (US$ Million)
Table 68. Bell Recent Development
Table 69. Bigbelly Company Details
Table 70. Bigbelly Business Overview
Table 71. Bigbelly Smart Waste Management Solutions with IoT Sensors Product
Table 72. Bigbelly Revenue in Smart Waste Management Solutions with IoT Sensors Business (2020-2025) & (US$ Million)
Table 73. Bigbelly Recent Development
Table 74. Evreka Company Details
Table 75. Evreka Business Overview
Table 76. Evreka Smart Waste Management Solutions with IoT Sensors Product
Table 77. Evreka Revenue in Smart Waste Management Solutions with IoT Sensors Business (2020-2025) & (US$ Million)
Table 78. Evreka Recent Development
Table 79. Waste Solutions Company Details
Table 80. Waste Solutions Business Overview
Table 81. Waste Solutions Smart Waste Management Solutions with IoT Sensors Product
Table 82. Waste Solutions Revenue in Smart Waste Management Solutions with IoT Sensors Business (2020-2025) & (US$ Million)
Table 83. Waste Solutions Recent Development
Table 84. Enevo Company Details
Table 85. Enevo Business Overview
Table 86. Enevo Smart Waste Management Solutions with IoT Sensors Product
Table 87. Enevo Revenue in Smart Waste Management Solutions with IoT Sensors Business (2020-2025) & (US$ Million)
Table 88. Enevo Recent Development
Table 89. Ecube Labs Company Details
Table 90. Ecube Labs Business Overview
Table 91. Ecube Labs Smart Waste Management Solutions with IoT Sensors Product
Table 92. Ecube Labs Revenue in Smart Waste Management Solutions with IoT Sensors Business (2020-2025) & (US$ Million)
Table 93. Ecube Labs Recent Development
Table 94. Sigrenea Company Details
Table 95. Sigrenea Business Overview
Table 96. Sigrenea Smart Waste Management Solutions with IoT Sensors Product
Table 97. Sigrenea Revenue in Smart Waste Management Solutions with IoT Sensors Business (2020-2025) & (US$ Million)
Table 98. Sigrenea Recent Development
Table 99. Wellness TechGroup Company Details
Table 100. Wellness TechGroup Business Overview
Table 101. Wellness TechGroup Smart Waste Management Solutions with IoT Sensors Product
Table 102. Wellness TechGroup Revenue in Smart Waste Management Solutions with IoT Sensors Business (2020-2025) & (US$ Million)
Table 103. Wellness TechGroup Recent Development
Table 104. Waste Harmonics Company Details
Table 105. Waste Harmonics Business Overview
Table 106. Waste Harmonics Smart Waste Management Solutions with IoT Sensors Product
Table 107. Waste Harmonics Revenue in Smart Waste Management Solutions with IoT Sensors Business (2020-2025) & (US$ Million)
Table 108. Waste Harmonics Recent Development
Table 109. Compology Company Details
Table 110. Compology Business Overview
Table 111. Compology Smart Waste Management Solutions with IoT Sensors Product
Table 112. Compology Revenue in Smart Waste Management Solutions with IoT Sensors Business (2020-2025) & (US$ Million)
Table 113. Compology Recent Development
Table 114. Tekelek Company Details
Table 115. Tekelek Business Overview
Table 116. Tekelek Smart Waste Management Solutions with IoT Sensors Product
Table 117. Tekelek Revenue in Smart Waste Management Solutions with IoT Sensors Business (2020-2025) & (US$ Million)
Table 118. Tekelek Recent Development
Table 119. BH Technologies Company Details
Table 120. BH Technologies Business Overview
Table 121. BH Technologies Smart Waste Management Solutions with IoT Sensors Product
Table 122. BH Technologies Revenue in Smart Waste Management Solutions with IoT Sensors Business (2020-2025) & (US$ Million)
Table 123. BH Technologies Recent Development
Table 124. Mr. Fill Company Details
Table 125. Mr. Fill Business Overview
Table 126. Mr. Fill Smart Waste Management Solutions with IoT Sensors Product
Table 127. Mr. Fill Revenue in Smart Waste Management Solutions with IoT Sensors Business (2020-2025) & (US$ Million)
Table 128. Mr. Fill Recent Development
Table 129. Superfy Company Details
Table 130. Superfy Business Overview
Table 131. Superfy Smart Waste Management Solutions with IoT Sensors Product
Table 132. Superfy Revenue in Smart Waste Management Solutions with IoT Sensors Business (2020-2025) & (US$ Million)
Table 133. Superfy Recent Development
Table 134. BrighterBins Company Details
Table 135. BrighterBins Business Overview
Table 136. BrighterBins Smart Waste Management Solutions with IoT Sensors Product
Table 137. BrighterBins Revenue in Smart Waste Management Solutions with IoT Sensors Business (2020-2025) & (US$ Million)
Table 138. BrighterBins Recent Development
Table 139. RealPage (Thoma Bravo) Company Details
Table 140. RealPage (Thoma Bravo) Business Overview
Table 141. RealPage (Thoma Bravo) Smart Waste Management Solutions with IoT Sensors Product
Table 142. RealPage (Thoma Bravo) Revenue in Smart Waste Management Solutions with IoT Sensors Business (2020-2025) & (US$ Million)
Table 143. RealPage (Thoma Bravo) Recent Development
Table 144. Sensoneo Company Details
Table 145. Sensoneo Business Overview
Table 146. Sensoneo Smart Waste Management Solutions with IoT Sensors Product
Table 147. Sensoneo Revenue in Smart Waste Management Solutions with IoT Sensors Business (2020-2025) & (US$ Million)
Table 148. Sensoneo Recent Development
Table 149. TST Sistemas Company Details
Table 150. TST Sistemas Business Overview
Table 151. TST Sistemas Smart Waste Management Solutions with IoT Sensors Product
Table 152. TST Sistemas Revenue in Smart Waste Management Solutions with IoT Sensors Business (2020-2025) & (US$ Million)
Table 153. TST Sistemas Recent Development
Table 154. Libelium Company Details
Table 155. Libelium Business Overview
Table 156. Libelium Smart Waste Management Solutions with IoT Sensors Product
Table 157. Libelium Revenue in Smart Waste Management Solutions with IoT Sensors Business (2020-2025) & (US$ Million)
Table 158. Libelium Recent Development
Table 159. Abel Sensors Company Details
Table 160. Abel Sensors Business Overview
Table 161. Abel Sensors Smart Waste Management Solutions with IoT Sensors Product
Table 162. Abel Sensors Revenue in Smart Waste Management Solutions with IoT Sensors Business (2020-2025) & (US$ Million)
Table 163. Abel Sensors Recent Development
Table 164. Faststream Company Details
Table 165. Faststream Business Overview
Table 166. Faststream Smart Waste Management Solutions with IoT Sensors Product
Table 167. Faststream Revenue in Smart Waste Management Solutions with IoT Sensors Business (2020-2025) & (US$ Million)
Table 168. Faststream Recent Development
Table 169. EcoMobile Company Details
Table 170. EcoMobile Business Overview
Table 171. EcoMobile Smart Waste Management Solutions with IoT Sensors Product
Table 172. EcoMobile Revenue in Smart Waste Management Solutions with IoT Sensors Business (2020-2025) & (US$ Million)
Table 173. EcoMobile Recent Development
Table 174. Research Programs/Design for This Report
Table 175. Key Data Information from Secondary Sources
Table 176. Key Data Information from Primary Sources
Table 177. Authors List of This Report
List of Figures
Figure 1. Smart Waste Management Solutions with IoT Sensors Picture
Figure 2. Global Smart Waste Management Solutions with IoT Sensors Market Size Comparison by Type (2020-2031) & (US$ Million)
Figure 3. Global Smart Waste Management Solutions with IoT Sensors Market Share by Type: 2024 VS 2031
Figure 4. IoT Sensors Features
Figure 5. Software and Service Features
Figure 6. Other Hardware Devices Features
Figure 7. Global Smart Waste Management Solutions with IoT Sensors Market Size Comparison by Sensor Type (2020-2031) & (US$ Million)
Figure 8. Ultrasonic Sensors Features
Figure 9. Non-ultrasonic Type Features
Figure 10. Global Smart Waste Management Solutions with IoT Sensors Market Size Comparison by Power & Energy Mode (2020-2031) & (US$ Million)
Figure 11. Battery-powered Features
Figure 12. Solar-powered Features
Figure 13. Others Features
Figure 14. Global Smart Waste Management Solutions with IoT Sensors Market Size by Application (2020-2031) & (US$ Million)
Figure 15. Global Smart Waste Management Solutions with IoT Sensors Market Share by Application: 2024 VS 2031
Figure 16. Municipal Waste Collection Case Studies
Figure 17. Commercial & Office Complexes Case Studies
Figure 18. Industrial Facilities Case Studies
Figure 19. Healthcare & Laboratory Case Studies
Figure 20. Residential & Campus Areas Case Studies
Figure 21. Smart Waste Management Solutions with IoT Sensors Report Years Considered
Figure 22. Global Smart Waste Management Solutions with IoT Sensors Market Size (US$ Million), Year-over-Year: 2020-2031
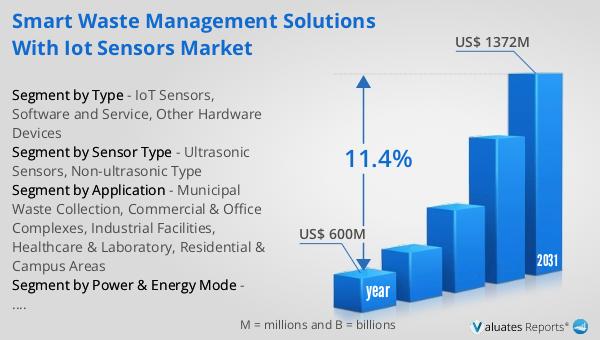
Figure 23. Global Smart Waste Management Solutions with IoT Sensors Market Size, (US$ Million), 2020 VS 2024 VS 2031
Figure 24. Global Smart Waste Management Solutions with IoT Sensors Market Share by Region: 2024 VS 2031
Figure 25. Global Smart Waste Management Solutions with IoT Sensors Market Share by Players in 2024
Figure 26. Global Smart Waste Management Solutions with IoT Sensors Market Share by Company Type (Tier 1, Tier 2, and Tier 3)
Figure 27. The Top 10 and 5 Players Market Share by Smart Waste Management Solutions with IoT Sensors Revenue in 2024
Figure 28. North America Smart Waste Management Solutions with IoT Sensors Market Size YoY Growth (2020-2031) & (US$ Million)
Figure 29. North America Smart Waste Management Solutions with IoT Sensors Market Share by Country (2020-2031)
Figure 30. United States Smart Waste Management Solutions with IoT Sensors Market Size YoY Growth (2020-2031) & (US$ Million)
Figure 31. Canada Smart Waste Management Solutions with IoT Sensors Market Size YoY Growth (2020-2031) & (US$ Million)
Figure 32. Europe Smart Waste Management Solutions with IoT Sensors Market Size YoY Growth (2020-2031) & (US$ Million)
Figure 33. Europe Smart Waste Management Solutions with IoT Sensors Market Share by Country (2020-2031)
Figure 34. Germany Smart Waste Management Solutions with IoT Sensors Market Size YoY Growth (2020-2031) & (US$ Million)
Figure 35. France Smart Waste Management Solutions with IoT Sensors Market Size YoY Growth (2020-2031) & (US$ Million)
Figure 36. U.K. Smart Waste Management Solutions with IoT Sensors Market Size YoY Growth (2020-2031) & (US$ Million)
Figure 37. Italy Smart Waste Management Solutions with IoT Sensors Market Size YoY Growth (2020-2031) & (US$ Million)
Figure 38. Russia Smart Waste Management Solutions with IoT Sensors Market Size YoY Growth (2020-2031) & (US$ Million)
Figure 39. Ireland Smart Waste Management Solutions with IoT Sensors Market Size YoY Growth (2020-2031) & (US$ Million)
Figure 40. Asia-Pacific Smart Waste Management Solutions with IoT Sensors Market Size YoY Growth (2020-2031) & (US$ Million)
Figure 41. Asia-Pacific Smart Waste Management Solutions with IoT Sensors Market Share by Region (2020-2031)
Figure 42. China Smart Waste Management Solutions with IoT Sensors Market Size YoY Growth (2020-2031) & (US$ Million)
Figure 43. Japan Smart Waste Management Solutions with IoT Sensors Market Size YoY Growth (2020-2031) & (US$ Million)
Figure 44. South Korea Smart Waste Management Solutions with IoT Sensors Market Size YoY Growth (2020-2031) & (US$ Million)
Figure 45. Southeast Asia Smart Waste Management Solutions with IoT Sensors Market Size YoY Growth (2020-2031) & (US$ Million)
Figure 46. India Smart Waste Management Solutions with IoT Sensors Market Size YoY Growth (2020-2031) & (US$ Million)
Figure 47. Australia & New Zealand Smart Waste Management Solutions with IoT Sensors Market Size YoY Growth (2020-2031) & (US$ Million)
Figure 48. Latin America Smart Waste Management Solutions with IoT Sensors Market Size YoY Growth (2020-2031) & (US$ Million)
Figure 49. Latin America Smart Waste Management Solutions with IoT Sensors Market Share by Country (2020-2031)
Figure 50. Mexico Smart Waste Management Solutions with IoT Sensors Market Size YoY Growth (2020-2031) & (US$ Million)
Figure 51. Brazil Smart Waste Management Solutions with IoT Sensors Market Size YoY Growth (2020-2031) & (US$ Million)
Figure 52. Middle East & Africa Smart Waste Management Solutions with IoT Sensors Market Size YoY Growth (2020-2031) & (US$ Million)
Figure 53. Middle East & Africa Smart Waste Management Solutions with IoT Sensors Market Share by Country (2020-2031)
Figure 54. Israel Smart Waste Management Solutions with IoT Sensors Market Size YoY Growth (2020-2031) & (US$ Million)
Figure 55. Saudi Arabia Smart Waste Management Solutions with IoT Sensors Market Size YoY Growth (2020-2031) & (US$ Million)
Figure 56. UAE Smart Waste Management Solutions with IoT Sensors Market Size YoY Growth (2020-2031) & (US$ Million)
Figure 57. Waste Vision Revenue Growth Rate in Smart Waste Management Solutions with IoT Sensors Business (2020-2025)
Figure 58. RecycleSmart Revenue Growth Rate in Smart Waste Management Solutions with IoT Sensors Business (2020-2025)
Figure 59. Bell Revenue Growth Rate in Smart Waste Management Solutions with IoT Sensors Business (2020-2025)
Figure 60. Bigbelly Revenue Growth Rate in Smart Waste Management Solutions with IoT Sensors Business (2020-2025)
Figure 61. Evreka Revenue Growth Rate in Smart Waste Management Solutions with IoT Sensors Business (2020-2025)
Figure 62. Waste Solutions Revenue Growth Rate in Smart Waste Management Solutions with IoT Sensors Business (2020-2025)
Figure 63. Enevo Revenue Growth Rate in Smart Waste Management Solutions with IoT Sensors Business (2020-2025)
Figure 64. Ecube Labs Revenue Growth Rate in Smart Waste Management Solutions with IoT Sensors Business (2020-2025)
Figure 65. Sigrenea Revenue Growth Rate in Smart Waste Management Solutions with IoT Sensors Business (2020-2025)
Figure 66. Wellness TechGroup Revenue Growth Rate in Smart Waste Management Solutions with IoT Sensors Business (2020-2025)
Figure 67. Waste Harmonics Revenue Growth Rate in Smart Waste Management Solutions with IoT Sensors Business (2020-2025)
Figure 68. Compology Revenue Growth Rate in Smart Waste Management Solutions with IoT Sensors Business (2020-2025)
Figure 69. Tekelek Revenue Growth Rate in Smart Waste Management Solutions with IoT Sensors Business (2020-2025)
Figure 70. BH Technologies Revenue Growth Rate in Smart Waste Management Solutions with IoT Sensors Business (2020-2025)
Figure 71. Mr. Fill Revenue Growth Rate in Smart Waste Management Solutions with IoT Sensors Business (2020-2025)
Figure 72. Superfy Revenue Growth Rate in Smart Waste Management Solutions with IoT Sensors Business (2020-2025)
Figure 73. BrighterBins Revenue Growth Rate in Smart Waste Management Solutions with IoT Sensors Business (2020-2025)
Figure 74. RealPage (Thoma Bravo) Revenue Growth Rate in Smart Waste Management Solutions with IoT Sensors Business (2020-2025)
Figure 75. Sensoneo Revenue Growth Rate in Smart Waste Management Solutions with IoT Sensors Business (2020-2025)
Figure 76. TST Sistemas Revenue Growth Rate in Smart Waste Management Solutions with IoT Sensors Business (2020-2025)
Figure 77. Libelium Revenue Growth Rate in Smart Waste Management Solutions with IoT Sensors Business (2020-2025)
Figure 78. Abel Sensors Revenue Growth Rate in Smart Waste Management Solutions with IoT Sensors Business (2020-2025)
Figure 79. Faststream Revenue Growth Rate in Smart Waste Management Solutions with IoT Sensors Business (2020-2025)
Figure 80. EcoMobile Revenue Growth Rate in Smart Waste Management Solutions with IoT Sensors Business (2020-2025)
Figure 81. Bottom-up and Top-down Approaches for This Report
Figure 82. Data Triangulation
Figure 83. Key Executives Interviewed