List of Tables
Table 1. Global Commercial Vehicle Automotive Thermal System Market Size Growth Rate by Type (US$ Million): 2020 VS 2024 VS 2031
Table 2. Key Players of Powertrain System
Table 3. Key Players of Passenger Cabin Thermal Management System
Table 4. Key Players of Others
Table 5. Global Commercial Vehicle Automotive Thermal System Market Size Growth Rate by Sales Channel (US$ Million): 2020 VS 2024 VS 2031
Table 6. Key Players of OEM
Table 7. Key Players of Aftermarket
Table 8. Global Commercial Vehicle Automotive Thermal System Market Size Growth Rate by Vehicle Power Source (US$ Million): 2020 VS 2024 VS 2031
Table 9. Key Players of Internal Combustion Engines
Table 10. Key Players of New Energy Vehicles
Table 11. Global Commercial Vehicle Automotive Thermal System Market Size Growth by Application (US$ Million): 2020 VS 2024 VS 2031
Table 12. Global Commercial Vehicle Automotive Thermal System Market Size by Region (US$ Million): 2020 VS 2024 VS 2031
Table 13. Global Commercial Vehicle Automotive Thermal System Market Size by Region (2020-2025) & (US$ Million)
Table 14. Global Commercial Vehicle Automotive Thermal System Market Share by Region (2020-2025)
Table 15. Global Commercial Vehicle Automotive Thermal System Forecasted Market Size by Region (2026-2031) & (US$ Million)
Table 16. Global Commercial Vehicle Automotive Thermal System Market Share by Region (2026-2031)
Table 17. Commercial Vehicle Automotive Thermal System Market Trends
Table 18. Commercial Vehicle Automotive Thermal System Market Drivers
Table 19. Commercial Vehicle Automotive Thermal System Market Challenges
Table 20. Commercial Vehicle Automotive Thermal System Market Restraints
Table 21. Global Commercial Vehicle Automotive Thermal System Revenue by Players (2020-2025) & (US$ Million)
Table 22. Global Commercial Vehicle Automotive Thermal System Market Share by Players (2020-2025)
Table 23. Global Top Commercial Vehicle Automotive Thermal System Players by Company Type (Tier 1, Tier 2, and Tier 3) & (based on the Revenue in Commercial Vehicle Automotive Thermal System as of 2024)
Table 24. Ranking of Global Top Commercial Vehicle Automotive Thermal System Companies by Revenue (US$ Million) in 2024
Table 25. Global 5 Largest Players Market Share by Commercial Vehicle Automotive Thermal System Revenue (CR5 and HHI) & (2020-2025)
Table 26. Global Key Players of Commercial Vehicle Automotive Thermal System, Headquarters and Area Served
Table 27. Global Key Players of Commercial Vehicle Automotive Thermal System, Product and Application
Table 28. Global Key Players of Commercial Vehicle Automotive Thermal System, Date of Enter into This Industry
Table 29. Mergers & Acquisitions, Expansion Plans
Table 30. Global Commercial Vehicle Automotive Thermal System Market Size by Type (2020-2025) & (US$ Million)
Table 31. Global Commercial Vehicle Automotive Thermal System Revenue Market Share by Type (2020-2025)
Table 32. Global Commercial Vehicle Automotive Thermal System Forecasted Market Size by Type (2026-2031) & (US$ Million)
Table 33. Global Commercial Vehicle Automotive Thermal System Revenue Market Share by Type (2026-2031)
Table 34. Global Commercial Vehicle Automotive Thermal System Market Size by Application (2020-2025) & (US$ Million)
Table 35. Global Commercial Vehicle Automotive Thermal System Revenue Market Share by Application (2020-2025)
Table 36. Global Commercial Vehicle Automotive Thermal System Forecasted Market Size by Application (2026-2031) & (US$ Million)
Table 37. Global Commercial Vehicle Automotive Thermal System Revenue Market Share by Application (2026-2031)
Table 38. North America Commercial Vehicle Automotive Thermal System Market Size Growth Rate by Country (US$ Million): 2020 VS 2024 VS 2031
Table 39. North America Commercial Vehicle Automotive Thermal System Market Size by Country (2020-2025) & (US$ Million)
Table 40. North America Commercial Vehicle Automotive Thermal System Market Size by Country (2026-2031) & (US$ Million)
Table 41. Europe Commercial Vehicle Automotive Thermal System Market Size Growth Rate by Country (US$ Million): 2020 VS 2024 VS 2031
Table 42. Europe Commercial Vehicle Automotive Thermal System Market Size by Country (2020-2025) & (US$ Million)
Table 43. Europe Commercial Vehicle Automotive Thermal System Market Size by Country (2026-2031) & (US$ Million)
Table 44. Asia-Pacific Commercial Vehicle Automotive Thermal System Market Size Growth Rate by Region (US$ Million): 2020 VS 2024 VS 2031
Table 45. Asia-Pacific Commercial Vehicle Automotive Thermal System Market Size by Region (2020-2025) & (US$ Million)
Table 46. Asia-Pacific Commercial Vehicle Automotive Thermal System Market Size by Region (2026-2031) & (US$ Million)
Table 47. Latin America Commercial Vehicle Automotive Thermal System Market Size Growth Rate by Country (US$ Million): 2020 VS 2024 VS 2031
Table 48. Latin America Commercial Vehicle Automotive Thermal System Market Size by Country (2020-2025) & (US$ Million)
Table 49. Latin America Commercial Vehicle Automotive Thermal System Market Size by Country (2026-2031) & (US$ Million)
Table 50. Middle East & Africa Commercial Vehicle Automotive Thermal System Market Size Growth Rate by Country (US$ Million): 2020 VS 2024 VS 2031
Table 51. Middle East & Africa Commercial Vehicle Automotive Thermal System Market Size by Country (2020-2025) & (US$ Million)
Table 52. Middle East & Africa Commercial Vehicle Automotive Thermal System Market Size by Country (2026-2031) & (US$ Million)
Table 53. DENSO Company Details
Table 54. DENSO Business Overview
Table 55. DENSO Commercial Vehicle Automotive Thermal System Product
Table 56. DENSO Revenue in Commercial Vehicle Automotive Thermal System Business (2020-2025) & (US$ Million)
Table 57. DENSO Recent Development
Table 58. Hanon Systems Company Details
Table 59. Hanon Systems Business Overview
Table 60. Hanon Systems Commercial Vehicle Automotive Thermal System Product
Table 61. Hanon Systems Revenue in Commercial Vehicle Automotive Thermal System Business (2020-2025) & (US$ Million)
Table 62. Hanon Systems Recent Development
Table 63. Valeo Company Details
Table 64. Valeo Business Overview
Table 65. Valeo Commercial Vehicle Automotive Thermal System Product
Table 66. Valeo Revenue in Commercial Vehicle Automotive Thermal System Business (2020-2025) & (US$ Million)
Table 67. Valeo Recent Development
Table 68. MAHLE GmbH Company Details
Table 69. MAHLE GmbH Business Overview
Table 70. MAHLE GmbH Commercial Vehicle Automotive Thermal System Product
Table 71. MAHLE GmbH Revenue in Commercial Vehicle Automotive Thermal System Business (2020-2025) & (US$ Million)
Table 72. MAHLE GmbH Recent Development
Table 73. Sanhua Intelligent Controls Company Details
Table 74. Sanhua Intelligent Controls Business Overview
Table 75. Sanhua Intelligent Controls Commercial Vehicle Automotive Thermal System Product
Table 76. Sanhua Intelligent Controls Revenue in Commercial Vehicle Automotive Thermal System Business (2020-2025) & (US$ Million)
Table 77. Sanhua Intelligent Controls Recent Development
Table 78. Sanden Company Details
Table 79. Sanden Business Overview
Table 80. Sanden Commercial Vehicle Automotive Thermal System Product
Table 81. Sanden Revenue in Commercial Vehicle Automotive Thermal System Business (2020-2025) & (US$ Million)
Table 82. Sanden Recent Development
Table 83. Aotecar Company Details
Table 84. Aotecar Business Overview
Table 85. Aotecar Commercial Vehicle Automotive Thermal System Product
Table 86. Aotecar Revenue in Commercial Vehicle Automotive Thermal System Business (2020-2025) & (US$ Million)
Table 87. Aotecar Recent Development
Table 88. Yinlun Machinery Company Details
Table 89. Yinlun Machinery Business Overview
Table 90. Yinlun Machinery Commercial Vehicle Automotive Thermal System Product
Table 91. Yinlun Machinery Revenue in Commercial Vehicle Automotive Thermal System Business (2020-2025) & (US$ Million)
Table 92. Yinlun Machinery Recent Development
Table 93. HASCO Company Details
Table 94. HASCO Business Overview
Table 95. HASCO Commercial Vehicle Automotive Thermal System Product
Table 96. HASCO Revenue in Commercial Vehicle Automotive Thermal System Business (2020-2025) & (US$ Million)
Table 97. HASCO Recent Development
Table 98. Bosch Company Details
Table 99. Bosch Business Overview
Table 100. Bosch Commercial Vehicle Automotive Thermal System Product
Table 101. Bosch Revenue in Commercial Vehicle Automotive Thermal System Business (2020-2025) & (US$ Million)
Table 102. Bosch Recent Development
Table 103. Johnson Electric Company Details
Table 104. Johnson Electric Business Overview
Table 105. Johnson Electric Commercial Vehicle Automotive Thermal System Product
Table 106. Johnson Electric Revenue in Commercial Vehicle Automotive Thermal System Business (2020-2025) & (US$ Million)
Table 107. Johnson Electric Recent Development
Table 108. Highly Group Company Details
Table 109. Highly Group Business Overview
Table 110. Highly Group Commercial Vehicle Automotive Thermal System Product
Table 111. Highly Group Revenue in Commercial Vehicle Automotive Thermal System Business (2020-2025) & (US$ Million)
Table 112. Highly Group Recent Development
Table 113. BorgWarner Company Details
Table 114. BorgWarner Business Overview
Table 115. BorgWarner Commercial Vehicle Automotive Thermal System Product
Table 116. BorgWarner Revenue in Commercial Vehicle Automotive Thermal System Business (2020-2025) & (US$ Million)
Table 117. BorgWarner Recent Development
Table 118. Zhongding Group Company Details
Table 119. Zhongding Group Business Overview
Table 120. Zhongding Group Commercial Vehicle Automotive Thermal System Product
Table 121. Zhongding Group Revenue in Commercial Vehicle Automotive Thermal System Business (2020-2025) & (US$ Million)
Table 122. Zhongding Group Recent Development
Table 123. Dana Incorporated Company Details
Table 124. Dana Incorporated Business Overview
Table 125. Dana Incorporated Commercial Vehicle Automotive Thermal System Product
Table 126. Dana Incorporated Revenue in Commercial Vehicle Automotive Thermal System Business (2020-2025) & (US$ Million)
Table 127. Dana Incorporated Recent Development
Table 128. Songz Automobile Air Conditioning Company Details
Table 129. Songz Automobile Air Conditioning Business Overview
Table 130. Songz Automobile Air Conditioning Commercial Vehicle Automotive Thermal System Product
Table 131. Songz Automobile Air Conditioning Revenue in Commercial Vehicle Automotive Thermal System Business (2020-2025) & (US$ Million)
Table 132. Songz Automobile Air Conditioning Recent Development
Table 133. Modine Company Details
Table 134. Modine Business Overview
Table 135. Modine Commercial Vehicle Automotive Thermal System Product
Table 136. Modine Revenue in Commercial Vehicle Automotive Thermal System Business (2020-2025) & (US$ Million)
Table 137. Modine Recent Development
Table 138. Feilong Auto Components Company Details
Table 139. Feilong Auto Components Business Overview
Table 140. Feilong Auto Components Commercial Vehicle Automotive Thermal System Product
Table 141. Feilong Auto Components Revenue in Commercial Vehicle Automotive Thermal System Business (2020-2025) & (US$ Million)
Table 142. Feilong Auto Components Recent Development
Table 143. Tenglong Auto Parts Company Details
Table 144. Tenglong Auto Parts Business Overview
Table 145. Tenglong Auto Parts Commercial Vehicle Automotive Thermal System Product
Table 146. Tenglong Auto Parts Revenue in Commercial Vehicle Automotive Thermal System Business (2020-2025) & (US$ Million)
Table 147. Tenglong Auto Parts Recent Development
Table 148. Tuopu Group Company Details
Table 149. Tuopu Group Business Overview
Table 150. Tuopu Group Commercial Vehicle Automotive Thermal System Product
Table 151. Tuopu Group Revenue in Commercial Vehicle Automotive Thermal System Business (2020-2025) & (US$ Million)
Table 152. Tuopu Group Recent Development
Table 153. Research Programs/Design for This Report
Table 154. Key Data Information from Secondary Sources
Table 155. Key Data Information from Primary Sources
Table 156. Authors List of This Report
List of Figures
Figure 1. Commercial Vehicle Automotive Thermal System Picture
Figure 2. Global Commercial Vehicle Automotive Thermal System Market Size Comparison by Type (2020-2031) & (US$ Million)
Figure 3. Global Commercial Vehicle Automotive Thermal System Market Share by Type: 2024 VS 2031
Figure 4. Powertrain System Features
Figure 5. Passenger Cabin Thermal Management System Features
Figure 6. Others Features
Figure 7. Global Commercial Vehicle Automotive Thermal System Market Size Comparison by Sales Channel (2020-2031) & (US$ Million)
Figure 8. OEM Features
Figure 9. Aftermarket Features
Figure 10. Global Commercial Vehicle Automotive Thermal System Market Size Comparison by Vehicle Power Source (2020-2031) & (US$ Million)
Figure 11. Internal Combustion Engines Features
Figure 12. New Energy Vehicles Features
Figure 13. Global Commercial Vehicle Automotive Thermal System Market Size by Application (2020-2031) & (US$ Million)
Figure 14. Global Commercial Vehicle Automotive Thermal System Market Share by Application: 2024 VS 2031
Figure 15. Medium and Heavy Vehicles Case Studies
Figure 16. Light Commercial Vehicle Case Studies
Figure 17. Commercial Vehicle Automotive Thermal System Report Years Considered
Figure 18. Global Commercial Vehicle Automotive Thermal System Market Size (US$ Million), Year-over-Year: 2020-2031
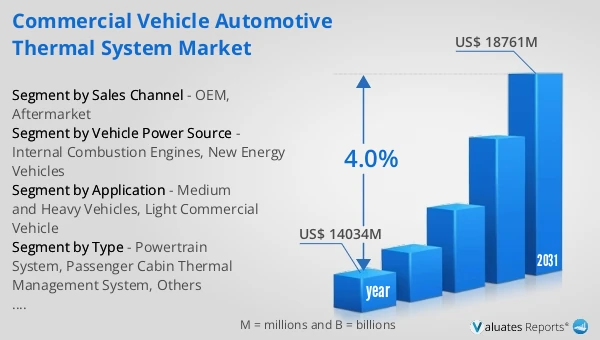
Figure 19. Global Commercial Vehicle Automotive Thermal System Market Size, (US$ Million), 2020 VS 2024 VS 2031
Figure 20. Global Commercial Vehicle Automotive Thermal System Market Share by Region: 2024 VS 2031
Figure 21. Global Commercial Vehicle Automotive Thermal System Market Share by Players in 2024
Figure 22. Global Commercial Vehicle Automotive Thermal System Market Share by Company Type (Tier 1, Tier 2, and Tier 3)
Figure 23. The Top 10 and 5 Players Market Share by Commercial Vehicle Automotive Thermal System Revenue in 2024
Figure 24. North America Commercial Vehicle Automotive Thermal System Market Size YoY Growth (2020-2031) & (US$ Million)
Figure 25. North America Commercial Vehicle Automotive Thermal System Market Share by Country (2020-2031)
Figure 26. United States Commercial Vehicle Automotive Thermal System Market Size YoY Growth (2020-2031) & (US$ Million)
Figure 27. Canada Commercial Vehicle Automotive Thermal System Market Size YoY Growth (2020-2031) & (US$ Million)
Figure 28. Europe Commercial Vehicle Automotive Thermal System Market Size YoY Growth (2020-2031) & (US$ Million)
Figure 29. Europe Commercial Vehicle Automotive Thermal System Market Share by Country (2020-2031)
Figure 30. Germany Commercial Vehicle Automotive Thermal System Market Size YoY Growth (2020-2031) & (US$ Million)
Figure 31. France Commercial Vehicle Automotive Thermal System Market Size YoY Growth (2020-2031) & (US$ Million)
Figure 32. U.K. Commercial Vehicle Automotive Thermal System Market Size YoY Growth (2020-2031) & (US$ Million)
Figure 33. Italy Commercial Vehicle Automotive Thermal System Market Size YoY Growth (2020-2031) & (US$ Million)
Figure 34. Russia Commercial Vehicle Automotive Thermal System Market Size YoY Growth (2020-2031) & (US$ Million)
Figure 35. Ireland Commercial Vehicle Automotive Thermal System Market Size YoY Growth (2020-2031) & (US$ Million)
Figure 36. Asia-Pacific Commercial Vehicle Automotive Thermal System Market Size YoY Growth (2020-2031) & (US$ Million)
Figure 37. Asia-Pacific Commercial Vehicle Automotive Thermal System Market Share by Region (2020-2031)
Figure 38. China Commercial Vehicle Automotive Thermal System Market Size YoY Growth (2020-2031) & (US$ Million)
Figure 39. Japan Commercial Vehicle Automotive Thermal System Market Size YoY Growth (2020-2031) & (US$ Million)
Figure 40. South Korea Commercial Vehicle Automotive Thermal System Market Size YoY Growth (2020-2031) & (US$ Million)
Figure 41. Southeast Asia Commercial Vehicle Automotive Thermal System Market Size YoY Growth (2020-2031) & (US$ Million)
Figure 42. India Commercial Vehicle Automotive Thermal System Market Size YoY Growth (2020-2031) & (US$ Million)
Figure 43. Australia & New Zealand Commercial Vehicle Automotive Thermal System Market Size YoY Growth (2020-2031) & (US$ Million)
Figure 44. Latin America Commercial Vehicle Automotive Thermal System Market Size YoY Growth (2020-2031) & (US$ Million)
Figure 45. Latin America Commercial Vehicle Automotive Thermal System Market Share by Country (2020-2031)
Figure 46. Mexico Commercial Vehicle Automotive Thermal System Market Size YoY Growth (2020-2031) & (US$ Million)
Figure 47. Brazil Commercial Vehicle Automotive Thermal System Market Size YoY Growth (2020-2031) & (US$ Million)
Figure 48. Middle East & Africa Commercial Vehicle Automotive Thermal System Market Size YoY Growth (2020-2031) & (US$ Million)
Figure 49. Middle East & Africa Commercial Vehicle Automotive Thermal System Market Share by Country (2020-2031)
Figure 50. Israel Commercial Vehicle Automotive Thermal System Market Size YoY Growth (2020-2031) & (US$ Million)
Figure 51. Saudi Arabia Commercial Vehicle Automotive Thermal System Market Size YoY Growth (2020-2031) & (US$ Million)
Figure 52. UAE Commercial Vehicle Automotive Thermal System Market Size YoY Growth (2020-2031) & (US$ Million)
Figure 53. DENSO Revenue Growth Rate in Commercial Vehicle Automotive Thermal System Business (2020-2025)
Figure 54. Hanon Systems Revenue Growth Rate in Commercial Vehicle Automotive Thermal System Business (2020-2025)
Figure 55. Valeo Revenue Growth Rate in Commercial Vehicle Automotive Thermal System Business (2020-2025)
Figure 56. MAHLE GmbH Revenue Growth Rate in Commercial Vehicle Automotive Thermal System Business (2020-2025)
Figure 57. Sanhua Intelligent Controls Revenue Growth Rate in Commercial Vehicle Automotive Thermal System Business (2020-2025)
Figure 58. Sanden Revenue Growth Rate in Commercial Vehicle Automotive Thermal System Business (2020-2025)
Figure 59. Aotecar Revenue Growth Rate in Commercial Vehicle Automotive Thermal System Business (2020-2025)
Figure 60. Yinlun Machinery Revenue Growth Rate in Commercial Vehicle Automotive Thermal System Business (2020-2025)
Figure 61. HASCO Revenue Growth Rate in Commercial Vehicle Automotive Thermal System Business (2020-2025)
Figure 62. Bosch Revenue Growth Rate in Commercial Vehicle Automotive Thermal System Business (2020-2025)
Figure 63. Johnson Electric Revenue Growth Rate in Commercial Vehicle Automotive Thermal System Business (2020-2025)
Figure 64. Highly Group Revenue Growth Rate in Commercial Vehicle Automotive Thermal System Business (2020-2025)
Figure 65. BorgWarner Revenue Growth Rate in Commercial Vehicle Automotive Thermal System Business (2020-2025)
Figure 66. Zhongding Group Revenue Growth Rate in Commercial Vehicle Automotive Thermal System Business (2020-2025)
Figure 67. Dana Incorporated Revenue Growth Rate in Commercial Vehicle Automotive Thermal System Business (2020-2025)
Figure 68. Songz Automobile Air Conditioning Revenue Growth Rate in Commercial Vehicle Automotive Thermal System Business (2020-2025)
Figure 69. Modine Revenue Growth Rate in Commercial Vehicle Automotive Thermal System Business (2020-2025)
Figure 70. Feilong Auto Components Revenue Growth Rate in Commercial Vehicle Automotive Thermal System Business (2020-2025)
Figure 71. Tenglong Auto Parts Revenue Growth Rate in Commercial Vehicle Automotive Thermal System Business (2020-2025)
Figure 72. Tuopu Group Revenue Growth Rate in Commercial Vehicle Automotive Thermal System Business (2020-2025)
Figure 73. Bottom-up and Top-down Approaches for This Report
Figure 74. Data Triangulation
Figure 75. Key Executives Interviewed