FEATURED COMPANIES
Hamilton
PerkinElmer Inc
Thermo Fisher Scientific
Eppendorf
Hudson Robotics
Corning Inc
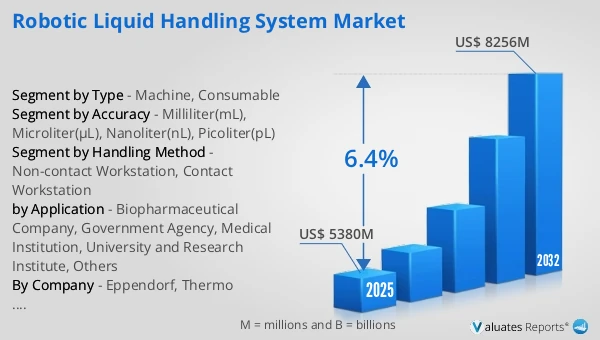
Robotic Liquid Handling System Market Size
The global Robotic Liquid Handling System market was valued at US$ 5380 million in 2025 and is anticipated to reach US$ 8256 million by 2032, at a CAGR of 6.4% from 2026 to 2032.
Robotic Liquid Handling System Market
The 2025 U.S. tariff policies introduce profound uncertainty into the global economic landscape. This report critically examines the implications of recent tariff adjustments and international strategic countermeasures on Robotic Liquid Handling System competitive dynamics, regional economic interdependencies, and supply chain reconfigurations.
In 2025, global Robotic Liquid Handling System production reached approximately 3627.1 k sets with an average global market price of around k US$105 per set. Single-line annual production capacity averages 5000 sets with a gross margin of approximately 32-35%. The upstream of the Robotic Liquid Handling System industry includes core components such as precision machinery, control systems, and sensors, which are primarily concentrated in the fields of precision machinery manufacturing and automation; the downstream applications cover biopharmaceutical companies, government agencies, medical institutions, universities, and research institutions, among which biopharmaceutical companies and medical institutions account for the highest consumption, approximately 60%; with the deepening of life science research and the increasing number of clinical trials, the demand for Robotic Liquid Handling Systems is continuously growing, and the business opportunities lie in technological innovation and the provision of customized solutions.
The Robotic Liquid Handling System is an advanced technological solution designed to automate the precise manipulation of liquids in a variety of applications. It encompasses a suite of components that include robotic arms, sensors, and control software, which collectively enable the system to perform tasks such as pipetting, dispensing, and mixing with high accuracy and consistency. The system is engineered to improve efficiency, reduce human error, and enhance safety in environments where the handling of liquids is critical, such as in laboratories, pharmaceutical manufacturing, and biotechnology research.
The future of the Robotic Liquid Handling System industry is poised to witness a surge in technological innovation, leading to more precise, flexible, and efficient systems. Customized solutions will cater to diverse industry needs, while the integration of AI and ML will enhance system adaptability and performance. A trend towards integration with other lab equipment and production processes will streamline workflows, and safety measures will be further enhanced to protect both personnel and equipment. With the advent of remote monitoring and maintenance through IoT and cloud computing, system availability and reliability will improve. Environmental sustainability and cost-effectiveness will also play significant roles, as will the compliance with global and regional regulations, driving the industry towards a more advanced and universally accessible landscape.
This report delivers a comprehensive overview of the global Robotic Liquid Handling System market, with both quantitative and qualitative analyses, to help readers develop growth strategies, assess the competitive landscape, evaluate their position in the current market, and make informed business decisions regarding Robotic Liquid Handling System. The Robotic Liquid Handling System market size, estimates, and forecasts are provided in terms of sales volume (Units) and revenue (US$ millions), with 2025 as the base year and historical and forecast data for 2021–2032.
The report segments the global Robotic Liquid Handling System market comprehensively. Regional market sizes by Type, by Application, by Accuracy, and by company are also provided. For deeper insight, the report profiles the competitive landscape, key competitors, and their respective market rankings, and discusses technological trends and new product developments.
This report will assist Robotic Liquid Handling System manufacturers, new entrants, and companies across the industry value chain with information on revenues, sales volume, and average prices for the overall market and its sub-segments, by company, by Type, by Application, and by region.
Market Segmentation
Scope of Robotic Liquid Handling System Market Report
| Report Metric |
Details |
| Report Name |
Robotic Liquid Handling System Market |
| Accounted market size in 2025 |
US$ 5380 in million |
| Forecasted market size in 2032 |
US$ 8256 million |
| CAGR |
6.4% |
| Base Year |
2025 |
| Forecasted years |
2026 - 2032 |
| Segment by Type |
|
| Segment by Accuracy |
- Milliliter(mL)
- Microliter(μL)
- Nanoliter(nL)
- Picoliter(pL)
|
| Segment by Handling Method |
- Non-contact Workstation
- Contact Workstation
|
| by Application |
- Biopharmaceutical Company
- Government Agency
- Medical Institution
- University and Research Institute
- Others
|
| Consumption by Region |
- North America (United States, Canada)
- Europe (Germany, France, UK, Italy, Russia)
- Asia-Pacific (China, Japan, South Korea, Taiwan)
- Southeast Asia (India)
- Latin America (Mexico, Brazil)
|
| By Company |
Eppendorf, Thermo Fisher Scientific, PerkinElmer, Agilent, Labcyte, Tecan, Corning, Aurora Biomed, Analytik Jena, BRAND GMBH, Hudson Robotics, BICO, Revvity, Beckman Coulter, Hamilton, Formulatrix, SPT Labtech, Tiangen Biotech (Beijing), Beijing AMTK Technology Development, Ashmar Scientific (Shanghai), Nanjing Vazyme Biotech, Suzhou PRCXI Biotechnology, NAYO Biotechnology (Shanghai) |
| Forecast units |
USD million in value |
| Report coverage |
Revenue and volume forecast, company share, competitive landscape, growth factors and trends |
Chapter Outline
- Chapter 1: Defines the scope of the report and presents an executive summary of market segments (by Type, by Application, by Accuracy, etc.), including the size of each segment and its future growth potential. It offers a high-level view of the current market and its likely evolution in the short, medium, and long term.
- Chapter 2: Provides a detailed analysis of the competitive landscape for Robotic Liquid Handling System manufacturers, covering pricing, sales and revenue shares, latest development plans, and mergers and acquisitions.
- Chapter 3: Examines Robotic Liquid Handling System sales and revenue at the regional and country levels. It quantifies market size and growth potential for each region and its key countries, and outlines market development, outlook, addressable space, and national market size.
- Chapter 4: Analyzes segments by Type, detailing the size and growth potential of each segment to help readers identify “blue ocean” opportunities.
- Chapter 5: Analyzes market segments by Application, covering the size and growth potential of each segment to help readers identify “blue ocean” opportunities in downstream markets.
- Chapter 6: Profiles key players, presenting core information on leading companies, including product sales, revenue, pricing, gross margin, product portfolio/introductions, and recent developments.
- Chapter 7: Reviews the industry value chain, including upstream and downstream segments.
- Chapter 8: Discusses market dynamics and recent developments, including drivers, restraints, challenges and risks for manufacturers, U.S. Tariffs and relevant policy analysis.
- Chapter 9: Summarizes the key findings and conclusions of the report.
FAQ for this report
How fast is Robotic Liquid Handling System Market growing?
Ans: The Robotic Liquid Handling System Market witnessing a CAGR of 6.4% during the forecast period 2026-2032.
What is the Robotic Liquid Handling System Market size in 2032?
Ans: The Robotic Liquid Handling System Market size in 2032 will be US$ 8256 million.
Who are the main players in the Robotic Liquid Handling System Market report?
Ans: The main players in the Robotic Liquid Handling System Market are Eppendorf, Thermo Fisher Scientific, PerkinElmer, Agilent, Labcyte, Tecan, Corning, Aurora Biomed, Analytik Jena, BRAND GMBH, Hudson Robotics, BICO, Revvity, Beckman Coulter, Hamilton, Formulatrix, SPT Labtech, Tiangen Biotech (Beijing), Beijing AMTK Technology Development, Ashmar Scientific (Shanghai), Nanjing Vazyme Biotech, Suzhou PRCXI Biotechnology, NAYO Biotechnology (Shanghai)
What are the Application segmentation covered in the Robotic Liquid Handling System Market report?
Ans: The Applications covered in the Robotic Liquid Handling System Market report are Biopharmaceutical Company, Government Agency, Medical Institution, University and Research Institute, Others
What are the Type segmentation covered in the Robotic Liquid Handling System Market report?
Ans: The Types covered in the Robotic Liquid Handling System Market report are Machine, Consumable

