List of Tables
Table 1. Molecular Biology Experimental Instruments Market Trends
Table 2. Molecular Biology Experimental Instruments Market Drivers & Opportunity
Table 3. Molecular Biology Experimental Instruments Market Challenges
Table 4. Molecular Biology Experimental Instruments Market Restraints
Table 5. Global Molecular Biology Experimental Instruments Revenue by Company (2020-2025) & (US$ Million)
Table 6. Global Molecular Biology Experimental Instruments Revenue Market Share by Company (2020-2025)
Table 7. Key Companies Molecular Biology Experimental Instruments Manufacturing Base Distribution and Headquarters
Table 8. Key Companies Molecular Biology Experimental Instruments Product Type
Table 9. Key Companies Time to Begin Mass Production of Molecular Biology Experimental Instruments
Table 10. Global Molecular Biology Experimental Instruments Companies Market Concentration Ratio (CR5 and HHI)
Table 11. Global Top Companies Market Share by Company Type (Tier 1, Tier 2, and Tier 3) & (based on the Revenue in Molecular Biology Experimental Instruments as of 2024)
Table 12. Mergers & Acquisitions, Expansion Plans
Table 13. Global Molecular Biology Experimental Instruments Sales Value by Type: 2020 VS 2024 VS 2031 (US$ Million)
Table 14. Global Molecular Biology Experimental Instruments Sales Value by Type (2020-2025) & (US$ Million)
Table 15. Global Molecular Biology Experimental Instruments Sales Value by Type (2026-2031) & (US$ Million)
Table 16. Global Molecular Biology Experimental Instruments Sales Market Share in Value by Type (2020-2025)
Table 17. Global Molecular Biology Experimental Instruments Sales Market Share in Value by Type (2026-2031)
Table 18. Global Molecular Biology Experimental Instruments Sales Value by Application: 2020 VS 2024 VS 2031 (US$ Million)
Table 19. Global Molecular Biology Experimental Instruments Sales Value by Application (2020-2025) & (US$ Million)
Table 20. Global Molecular Biology Experimental Instruments Sales Value by Application (2026-2031) & (US$ Million)
Table 21. Global Molecular Biology Experimental Instruments Sales Market Share in Value by Application (2020-2025)
Table 22. Global Molecular Biology Experimental Instruments Sales Market Share in Value by Application (2026-2031)
Table 23. Global Molecular Biology Experimental Instruments Sales Value by Region, (2020 VS 2024 VS 2031) & (US$ Million)
Table 24. Global Molecular Biology Experimental Instruments Sales Value by Region (2020-2025) & (US$ Million)
Table 25. Global Molecular Biology Experimental Instruments Sales Value by Region (2026-2031) & (US$ Million)
Table 26. Global Molecular Biology Experimental Instruments Sales Value by Region (2020-2025) & (%)
Table 27. Global Molecular Biology Experimental Instruments Sales Value by Region (2026-2031) & (%)
Table 28. Key Countries/Regions Molecular Biology Experimental Instruments Sales Value Growth Trends, (US$ Million): 2020 VS 2024 VS 2031
Table 29. Key Countries/Regions Molecular Biology Experimental Instruments Sales Value, (2020-2025) & (US$ Million)
Table 30. Key Countries/Regions Molecular Biology Experimental Instruments Sales Value, (2026-2031) & (US$ Million)
Table 31. Seegene Basic Information List
Table 32. Seegene Description and Business Overview
Table 33. Seegene Molecular Biology Experimental Instruments Products, Services and Solutions
Table 34. Revenue (US$ Million) in Molecular Biology Experimental Instruments Business of Seegene (2020-2025)
Table 35. Seegene Recent Developments
Table 36. SPACEGEN Basic Information List
Table 37. SPACEGEN Description and Business Overview
Table 38. SPACEGEN Molecular Biology Experimental Instruments Products, Services and Solutions
Table 39. Revenue (US$ Million) in Molecular Biology Experimental Instruments Business of SPACEGEN (2020-2025)
Table 40. SPACEGEN Recent Developments
Table 41. VITASSAY HEALTHCARE S.L. Basic Information List
Table 42. VITASSAY HEALTHCARE S.L. Description and Business Overview
Table 43. VITASSAY HEALTHCARE S.L. Molecular Biology Experimental Instruments Products, Services and Solutions
Table 44. Revenue (US$ Million) in Molecular Biology Experimental Instruments Business of VITASSAY HEALTHCARE S.L. (2020-2025)
Table 45. VITASSAY HEALTHCARE S.L. Recent Developments
Table 46. Yaneng Bioscience (Shenzhen) Co., Ltd. Basic Information List
Table 47. Yaneng Bioscience (Shenzhen) Co., Ltd. Description and Business Overview
Table 48. Yaneng Bioscience (Shenzhen) Co., Ltd. Molecular Biology Experimental Instruments Products, Services and Solutions
Table 49. Revenue (US$ Million) in Molecular Biology Experimental Instruments Business of Yaneng Bioscience (Shenzhen) Co., Ltd. (2020-2025)
Table 50. Yaneng Bioscience (Shenzhen) Co., Ltd. Recent Developments
Table 51. Zhejiang Orient Gene Basic Information List
Table 52. Zhejiang Orient Gene Description and Business Overview
Table 53. Zhejiang Orient Gene Molecular Biology Experimental Instruments Products, Services and Solutions
Table 54. Revenue (US$ Million) in Molecular Biology Experimental Instruments Business of Zhejiang Orient Gene (2020-2025)
Table 55. Zhejiang Orient Gene Recent Developments
Table 56. ELITech Group Basic Information List
Table 57. ELITech Group Description and Business Overview
Table 58. ELITech Group Molecular Biology Experimental Instruments Products, Services and Solutions
Table 59. Revenue (US$ Million) in Molecular Biology Experimental Instruments Business of ELITech Group (2020-2025)
Table 60. ELITech Group Recent Developments
Table 61. Fujirebio Basic Information List
Table 62. Fujirebio Description and Business Overview
Table 63. Fujirebio Molecular Biology Experimental Instruments Products, Services and Solutions
Table 64. Revenue (US$ Million) in Molecular Biology Experimental Instruments Business of Fujirebio (2020-2025)
Table 65. Fujirebio Recent Developments
Table 66. Jiangsu Bioperfectus Technologies Co., Ltd. Basic Information List
Table 67. Jiangsu Bioperfectus Technologies Co., Ltd. Description and Business Overview
Table 68. Jiangsu Bioperfectus Technologies Co., Ltd. Molecular Biology Experimental Instruments Products, Services and Solutions
Table 69. Revenue (US$ Million) in Molecular Biology Experimental Instruments Business of Jiangsu Bioperfectus Technologies Co., Ltd. (2020-2025)
Table 70. Jiangsu Bioperfectus Technologies Co., Ltd. Recent Developments
Table 71. Jiangsu Macro & Micro-Test Med-Tech Co., Ltd. Basic Information List
Table 72. Jiangsu Macro & Micro-Test Med-Tech Co., Ltd. Description and Business Overview
Table 73. Jiangsu Macro & Micro-Test Med-Tech Co., Ltd. Molecular Biology Experimental Instruments Products, Services and Solutions
Table 74. Revenue (US$ Million) in Molecular Biology Experimental Instruments Business of Jiangsu Macro & Micro-Test Med-Tech Co., Ltd. (2020-2025)
Table 75. Jiangsu Macro & Micro-Test Med-Tech Co., Ltd. Recent Developments
Table 76. Altona Diagnostics GmbH Basic Information List
Table 77. Altona Diagnostics GmbH Description and Business Overview
Table 78. Altona Diagnostics GmbH Molecular Biology Experimental Instruments Products, Services and Solutions
Table 79. Revenue (US$ Million) in Molecular Biology Experimental Instruments Business of Altona Diagnostics GmbH (2020-2025)
Table 80. Altona Diagnostics GmbH Recent Developments
Table 81. NZYTech Basic Information List
Table 82. NZYTech Description and Business Overview
Table 83. NZYTech Molecular Biology Experimental Instruments Products, Services and Solutions
Table 84. Revenue (US$ Million) in Molecular Biology Experimental Instruments Business of NZYTech (2020-2025)
Table 85. NZYTech Recent Developments
Table 86. ATTOPLEX Basic Information List
Table 87. ATTOPLEX Description and Business Overview
Table 88. ATTOPLEX Molecular Biology Experimental Instruments Products, Services and Solutions
Table 89. Revenue (US$ Million) in Molecular Biology Experimental Instruments Business of ATTOPLEX (2020-2025)
Table 90. ATTOPLEX Recent Developments
Table 91. OSANG Healthcare Basic Information List
Table 92. OSANG Healthcare Description and Business Overview
Table 93. OSANG Healthcare Molecular Biology Experimental Instruments Products, Services and Solutions
Table 94. Revenue (US$ Million) in Molecular Biology Experimental Instruments Business of OSANG Healthcare (2020-2025)
Table 95. OSANG Healthcare Recent Developments
Table 96. Panagene Inc. Basic Information List
Table 97. Panagene Inc. Description and Business Overview
Table 98. Panagene Inc. Molecular Biology Experimental Instruments Products, Services and Solutions
Table 99. Revenue (US$ Million) in Molecular Biology Experimental Instruments Business of Panagene Inc. (2020-2025)
Table 100. Panagene Inc. Recent Developments
Table 101. PCRmax Basic Information List
Table 102. PCRmax Description and Business Overview
Table 103. PCRmax Molecular Biology Experimental Instruments Products, Services and Solutions
Table 104. Revenue (US$ Million) in Molecular Biology Experimental Instruments Business of PCRmax (2020-2025)
Table 105. PCRmax Recent Developments
Table 106. R-Biopharm AG Basic Information List
Table 107. R-Biopharm AG Description and Business Overview
Table 108. R-Biopharm AG Molecular Biology Experimental Instruments Products, Services and Solutions
Table 109. Revenue (US$ Million) in Molecular Biology Experimental Instruments Business of R-Biopharm AG (2020-2025)
Table 110. R-Biopharm AG Recent Developments
Table 111. AB Analitica Basic Information List
Table 112. AB Analitica Description and Business Overview
Table 113. AB Analitica Molecular Biology Experimental Instruments Products, Services and Solutions
Table 114. Revenue (US$ Million) in Molecular Biology Experimental Instruments Business of AB Analitica (2020-2025)
Table 115. AB Analitica Recent Developments
Table 116. Celnovte Biotechnology Co., Ltd. Basic Information List
Table 117. Celnovte Biotechnology Co., Ltd. Description and Business Overview
Table 118. Celnovte Biotechnology Co., Ltd. Molecular Biology Experimental Instruments Products, Services and Solutions
Table 119. Revenue (US$ Million) in Molecular Biology Experimental Instruments Business of Celnovte Biotechnology Co., Ltd. (2020-2025)
Table 120. Celnovte Biotechnology Co., Ltd. Recent Developments
Table 121. Elisabeth Pharmacon Spol Basic Information List
Table 122. Elisabeth Pharmacon Spol Description and Business Overview
Table 123. Elisabeth Pharmacon Spol Molecular Biology Experimental Instruments Products, Services and Solutions
Table 124. Revenue (US$ Million) in Molecular Biology Experimental Instruments Business of Elisabeth Pharmacon Spol (2020-2025)
Table 125. Elisabeth Pharmacon Spol Recent Developments
Table 126. Jiangsu Mole Bioscience CO., LTD. Basic Information List
Table 127. Jiangsu Mole Bioscience CO., LTD. Description and Business Overview
Table 128. Jiangsu Mole Bioscience CO., LTD. Molecular Biology Experimental Instruments Products, Services and Solutions
Table 129. Revenue (US$ Million) in Molecular Biology Experimental Instruments Business of Jiangsu Mole Bioscience CO., LTD. (2020-2025)
Table 130. Jiangsu Mole Bioscience CO., LTD. Recent Developments
Table 131. Medical Innovation Ventures Basic Information List
Table 132. Medical Innovation Ventures Description and Business Overview
Table 133. Medical Innovation Ventures Molecular Biology Experimental Instruments Products, Services and Solutions
Table 134. Revenue (US$ Million) in Molecular Biology Experimental Instruments Business of Medical Innovation Ventures (2020-2025)
Table 135. Medical Innovation Ventures Recent Developments
Table 136. Randox Laboratories Basic Information List
Table 137. Randox Laboratories Description and Business Overview
Table 138. Randox Laboratories Molecular Biology Experimental Instruments Products, Services and Solutions
Table 139. Revenue (US$ Million) in Molecular Biology Experimental Instruments Business of Randox Laboratories (2020-2025)
Table 140. Randox Laboratories Recent Developments
Table 141. Key Raw Materials Lists
Table 142. Raw Materials Key Suppliers Lists
Table 143. Molecular Biology Experimental Instruments Downstream Customers
Table 144. Molecular Biology Experimental Instruments Distributors List
Table 145. Research Programs/Design for This Report
Table 146. Key Data Information from Secondary Sources
Table 147. Key Data Information from Primary Sources
Table 148. Business Unit and Senior & Team Lead Analysts
List of Figures
Figure 1. Molecular Biology Experimental Instruments Product Picture
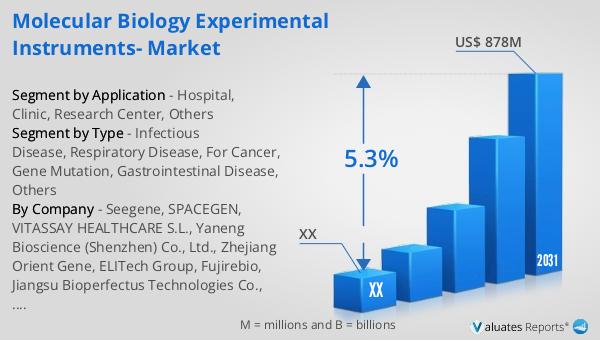
Figure 2. Global Molecular Biology Experimental Instruments Sales Value, 2020 VS 2024 VS 2031 (US$ Million)
Figure 3. Global Molecular Biology Experimental Instruments Sales Value (2020-2031) & (US$ Million)
Figure 4. Molecular Biology Experimental Instruments Report Years Considered
Figure 5. Global Molecular Biology Experimental Instruments Players Revenue Ranking (2024) & (US$ Million)
Figure 6. The 5 and 10 Largest Companies in the World: Market Share by Molecular Biology Experimental Instruments Revenue in 2024
Figure 7. Molecular Biology Experimental Instruments Market Share by Company Type (Tier 1, Tier 2, and Tier 3): 2020 VS 2024
Figure 8. Infectious Disease Picture
Figure 9. Respiratory Disease Picture
Figure 10. For Cancer Picture
Figure 11. Gene Mutation Picture
Figure 12. Gastrointestinal Disease Picture
Figure 13. Others Picture
Figure 14. Global Molecular Biology Experimental Instruments Sales Value by Type (2020 VS 2024 VS 2031) & (US$ Million)
Figure 15. Global Molecular Biology Experimental Instruments Sales Value Market Share by Type, 2024 & 2031
Figure 16. Product Picture of Hospital
Figure 17. Product Picture of Clinic
Figure 18. Product Picture of Research Center
Figure 19. Product Picture of Others
Figure 20. Global Molecular Biology Experimental Instruments Sales Value by Application (2020 VS 2024 VS 2031) & (US$ Million)
Figure 21. Global Molecular Biology Experimental Instruments Sales Value Market Share by Application, 2024 & 2031
Figure 22. North America Molecular Biology Experimental Instruments Sales Value (2020-2031) & (US$ Million)
Figure 23. North America Molecular Biology Experimental Instruments Sales Value by Country (%), 2024 VS 2031
Figure 24. Europe Molecular Biology Experimental Instruments Sales Value, (2020-2031) & (US$ Million)
Figure 25. Europe Molecular Biology Experimental Instruments Sales Value by Country (%), 2024 VS 2031
Figure 26. Asia Pacific Molecular Biology Experimental Instruments Sales Value, (2020-2031) & (US$ Million)
Figure 27. Asia Pacific Molecular Biology Experimental Instruments Sales Value by Region (%), 2024 VS 2031
Figure 28. South America Molecular Biology Experimental Instruments Sales Value, (2020-2031) & (US$ Million)
Figure 29. South America Molecular Biology Experimental Instruments Sales Value by Country (%), 2024 VS 2031
Figure 30. Middle East & Africa Molecular Biology Experimental Instruments Sales Value, (2020-2031) & (US$ Million)
Figure 31. Middle East & Africa Molecular Biology Experimental Instruments Sales Value by Country (%), 2024 VS 2031
Figure 32. Key Countries/Regions Molecular Biology Experimental Instruments Sales Value (%), (2020-2031)
Figure 33. United States Molecular Biology Experimental Instruments Sales Value, (2020-2031) & (US$ Million)
Figure 34. United States Molecular Biology Experimental Instruments Sales Value by Type (%), 2024 VS 2031
Figure 35. United States Molecular Biology Experimental Instruments Sales Value by Application (%), 2024 VS 2031
Figure 36. Europe Molecular Biology Experimental Instruments Sales Value, (2020-2031) & (US$ Million)
Figure 37. Europe Molecular Biology Experimental Instruments Sales Value by Type (%), 2024 VS 2031
Figure 38. Europe Molecular Biology Experimental Instruments Sales Value by Application (%), 2024 VS 2031
Figure 39. China Molecular Biology Experimental Instruments Sales Value, (2020-2031) & (US$ Million)
Figure 40. China Molecular Biology Experimental Instruments Sales Value by Type (%), 2024 VS 2031
Figure 41. China Molecular Biology Experimental Instruments Sales Value by Application (%), 2024 VS 2031
Figure 42. Japan Molecular Biology Experimental Instruments Sales Value, (2020-2031) & (US$ Million)
Figure 43. Japan Molecular Biology Experimental Instruments Sales Value by Type (%), 2024 VS 2031
Figure 44. Japan Molecular Biology Experimental Instruments Sales Value by Application (%), 2024 VS 2031
Figure 45. South Korea Molecular Biology Experimental Instruments Sales Value, (2020-2031) & (US$ Million)
Figure 46. South Korea Molecular Biology Experimental Instruments Sales Value by Type (%), 2024 VS 2031
Figure 47. South Korea Molecular Biology Experimental Instruments Sales Value by Application (%), 2024 VS 2031
Figure 48. Southeast Asia Molecular Biology Experimental Instruments Sales Value, (2020-2031) & (US$ Million)
Figure 49. Southeast Asia Molecular Biology Experimental Instruments Sales Value by Type (%), 2024 VS 2031
Figure 50. Southeast Asia Molecular Biology Experimental Instruments Sales Value by Application (%), 2024 VS 2031
Figure 51. India Molecular Biology Experimental Instruments Sales Value, (2020-2031) & (US$ Million)
Figure 52. India Molecular Biology Experimental Instruments Sales Value by Type (%), 2024 VS 2031
Figure 53. India Molecular Biology Experimental Instruments Sales Value by Application (%), 2024 VS 2031
Figure 54. Molecular Biology Experimental Instruments Industrial Chain
Figure 55. Molecular Biology Experimental Instruments Manufacturing Cost Structure
Figure 56. Channels of Distribution (Direct Sales, and Distribution)
Figure 57. Bottom-up and Top-down Approaches for This Report
Figure 58. Data Triangulation
Figure 59. Key Executives Interviewed