
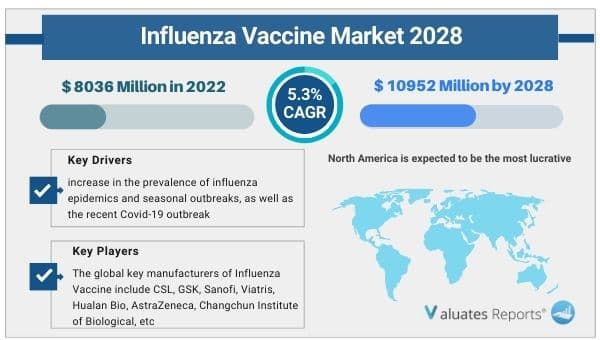
Due to the COVID-19 pandemic, the global Influenza Vaccine market size is estimated to be worth USD 8036 Million in 2022 and is forecast to a readjusted size of USD 10952 Million by 2028 with a CAGR of 5.3% during the review period.
Influenza vaccines, also known as flu shots, are vaccines that protect against influenza. A new version of the vaccine is developed twice a year as the influenza virus rapidly changes. Most provide modest to high protection against influenza; however, each year this varies. Evidence in adults over 65 years old is poor. They decrease the number of missed days of work by a half day on average. Vaccinating children may protect those around them.
The global key manufacturers of Influenza Vaccine include CSL, GSK, Sanofi, Viatris, Hualan Bio, AstraZeneca, Changchun Institute of Biological, etc. In 2021, the global top five players have a share approximately 85.04% in terms of revenue.
North America is the largest market of Influenza Vaccine, with a share over 55%. As for the types of products, it can be divided into Trivalent Influenza Vaccine and Quadrivalent Influenza Vaccine. The most common product is Quadrivalent Influenza Vaccine, with a share over 95%. In terms of applications, it is widely used in For Children (6 months to 3 years) and For Adults and Children over 3 years. The most application is in Adults and Children over 3 years, with a share over 73%.
This report focuses on Influenza Vaccine volume and value at the global level, regional level and company level. From a global perspective, this report represents overall Influenza Vaccine market size by analysing historical data and future prospect. Regionally, this report focuses on several key regions: North America, Europe, Asia-Pacific, Latin America and Middle East & Africa.
The research report includes specific segments by region (country), by company, by Type and by Application. This study provides information about the sales and revenue during the historic and forecasted period of 2016 to 2027. Understanding the segments helps in identifying the importance of different factors that aid the market growth.
|
Report Metric |
Details |
|
Report Name |
Influenza Vaccine Market |
|
Market size value in 2022 |
USD 8036 Million |
|
Revenue forecast in 2028 |
USD 10952 Million |
|
Growth Rate |
5.3% |
|
Base year considered |
2022 |
|
Forecast Period |
2023-2028 |
|
By Type |
Trivalent Influenza Vaccine, Quadrivalent Influenza Vaccine |
|
By Application |
For Children (6 months to 3 years), For Adults and Children over 3 years |
|
Report Coverage |
Revenue & volume forecast, company share, competitive landscape, growth factors, and trends |
|
Segments Covered |
By Type, Application, and Region |
|
Geographic Regions Covered |
North America, Europe, Asia Pacific, Latin America, Middle East & Africa |
Ans. Due to the COVID-19 pandemic, the global Influenza Vaccine market size is estimated to be worth US$ 8036 million in 2022 and is forecast to a readjusted size of US$ 10952 million by 2028 with a CAGR of 5.3% during the review period.
Ans. The global key manufacturers of Influenza Vaccine include CSL, GSK, Sanofi, Viatris, Hualan Bio, AstraZeneca, Changchun Institute of Biological, etc. In 2021, the global top five players have a share approximately 85.04% in terms of revenue.
Ans. Yes, the report includes a COVID-19 impact analysis. Also, it is further extended into every individual segment of the report.
1 STUDY COVERAGE 1
1.1 Influenza Vaccine Product Introduction 1
1.2 Market by Type 1
1.2.1 Global Influenza Vaccine Market Size Growth Rate by Type, 2017 VS 2021 VS 2028 1
1.2.2 Trivalent Influenza Vaccine 3
1.2.3 Quadrivalent Influenza Vaccine 4
1.3 Market by Application 5
1.3.1 Global Influenza Vaccine Market Size Growth Rate by Application, 2017 VS 2021 VS 2028 5
1.3.2 For Children (6 months to 3 years) 7
1.3.3 For Adults and Children over 3 years 8
1.4 Study Objectives 8
1.5 Years Considered 9
2 EXECUTIVE SUMMARY 10
2.1 Global Influenza Vaccine Sales Estimates and Forecasts 2017-2028 10
2.2 Global Influenza Vaccine Revenue Estimates and Forecasts 2017-2028 11
2.3 Global Influenza Vaccine Revenue by Region: 2017 VS 2021 VS 2028 12
2.4 Global Influenza Vaccine Sales by Region 14
2.4.1 Global Influenza Vaccine Sales by Region (2017-2022) 14
2.4.2 Global Sales Influenza Vaccine by Region (2023-2028) 15
2.5 Global Influenza Vaccine Revenue by Region 16
2.5.1 Global Influenza Vaccine Revenue by Region (2017-2022) 16
2.5.2 Global Influenza Vaccine Revenue by Region (2023-2028) 17
2.6 North America 18
2.7 Europe 19
2.8 Asia-Pacific 20
2.9 South America 21
2.10 Middle East & Africa 22
3 COMPETITION BY MANUFACTURERS 23
3.1 Global Influenza Vaccine Sales by Manufacturers 23
3.1.1 Global Influenza Vaccine Sales by Manufacturers (2020-2022) 23
3.1.2 Global Influenza Vaccine Sales Market Share by Manufacturers (2020-2022) 24
3.1.3 Global Top Largest Manufacturers of Influenza Vaccine in 2021 24
3.2 Global Influenza Vaccine Revenue by Manufacturers 25
3.2.1 Global Influenza Vaccine Revenue by Manufacturers (2020-2022) 25
3.2.2 Global Influenza Vaccine Revenue Market Share by Manufacturers (2020-2022) 26
3.2.3 Global Top Companies by Influenza Vaccine Revenue in 2021 27
3.3 Global Influenza Vaccine Sales Price by Manufacturers (2020-2022) 27
3.4 Analysis of Competitive Landscape 28
3.4.1 Manufacturers Market Concentration Ratio (CR5 and HHI) 28
3.4.2 Global Influenza Vaccine by Company Type (Tier 1, Tier 2, and Tier 3) 29
3.4.3 Global Influenza Vaccine Manufacturers Geographical Distribution 30
3.5 Mergers & Acquisitions, Expansion Plans 31
4 MARKET SIZE BY TYPE 35
4.1 Global Influenza Vaccine Sales by Type 35
4.1.1 Global Influenza Vaccine Historical Sales by Type (2017-2022) 35
4.1.2 Global Influenza Vaccine Forecasted Sales by Type (2023-2028) 35
4.1.3 Global Influenza Vaccine Sales Market Share by Type (2017-2028) 35
4.2 Global Influenza Vaccine Revenue by Type 36
4.2.1 Global Influenza Vaccine Historical Revenue by Type (2017-2022) 36
4.2.2 Global Influenza Vaccine Forecasted Revenue by Type (2023-2028) 37
4.2.3 Global Influenza Vaccine Revenue Market Share by Type (2017-2028) 37
4.3 Global Influenza Vaccine Price by Type 38
4.3.1 Global Influenza Vaccine Price by Type (2017-2022) 38
4.3.2 Global Influenza Vaccine Price Forecast by Type (2023-2028) 38
5 MARKET SIZE BY APPLICATION 39
5.1 Global Influenza Vaccine Sales by Application 39
5.1.1 Global Influenza Vaccine Historical Sales by Application (2017-2022) 39
5.1.2 Global Influenza Vaccine Forecasted Sales by Application (2023-2028) 39
5.1.3 Global Influenza Vaccine Sales Market Share by Application (2017-2028) 39
5.2 Global Influenza Vaccine Revenue by Application 40
5.2.1 Global Influenza Vaccine Historical Revenue by Application (2017-2022) 40
5.2.2 Global Influenza Vaccine Forecasted Revenue by Application (2023-2028) 41
5.2.3 Global Influenza Vaccine Revenue Market Share by Application (2017-2028) 41
5.3 Global Influenza Vaccine Price by Application 42
5.3.1 Global Influenza Vaccine Price by Application (2017-2022) 42
5.3.2 Global Influenza Vaccine Price Forecast by Application (2023-2028) 42
6 NORTH AMERICA 43
6.1 North America Influenza Vaccine Market Size by Type 43
6.1.1 North America Influenza Vaccine Sales by Type (2017-2028) 43
6.1.2 North America Influenza Vaccine Revenue by Type (2017-2028) 44
6.2 North America Influenza Vaccine Market Size by Application 45
6.3 North America Influenza Vaccine Sales by Country 46
6.3.1 North America Influenza Vaccine Sales by Country (2017-2028) 46
6.3.2 North America Influenza Vaccine Revenue by Country (2017-2028) 47
6.3.3 U.S. 48
6.3.4 Canada 48
6.3.5 Mexico 49
7 EUROPE 50
7.1 Europe Influenza Vaccine Market Size by Type 50
7.1.1 Europe Influenza Vaccine Sales by Type (2017-2028) 50
7.1.2 Europe Influenza Vaccine Revenue by Type (2017-2028) 51
7.2 Europe Influenza Vaccine Market Size by Application 52
7.3 Europe Influenza Vaccine Market Size by Country 53
7.3.1 Europe Influenza Vaccine Sales by Country (2017-2028) 53
7.3.2 Europe Influenza Vaccine Revenue by Country (2017-2028) 54
7.3.3 Germany 55
7.3.4 France 56
7.3.5 U.K. 56
7.3.6 Italy 57
7.3.7 Russia 57
8 ASIA PACIFIC 58
8.1 Asia Pacific Influenza Vaccine Market Size by Type 58
8.1.1 Asia Pacific Influenza Vaccine Sales by Type (2017-2028) 58
8.1.2 Asia Pacific Influenza Vaccine Revenue by Type (2017-2028) 59
8.2 Asia Pacific Influenza Vaccine Market Size by Application 60
8.3 Asia Pacific Influenza Vaccine Market Size by Region 61
8.3.1 Asia Pacific Influenza Vaccine Sales by Region (2017-2028) 61
8.3.2 Asia Pacific Influenza Vaccine Revenue by Region (2017-2028) 62
8.3.3 China 64
8.3.4 Japan 64
8.3.5 South Korea 65
8.3.6 India 65
8.3.7 Australia 66
8.3.8 Southeast Asia 66
9 SOUTH AMERICA 67
9.1 South America Influenza Vaccine Market Size by Type 67
9.1.1 South America Influenza Vaccine Sales by Type (2017-2028) 67
9.1.2 South America Influenza Vaccine Revenue by Type (2017-2028) 68
9.2 South America Influenza Vaccine Market Size by Application 69
9.3 South America Influenza Vaccine Market Size by Country 70
9.3.1 South America Influenza Vaccine Sales by Country (2017-2028) 70
9.3.2 South America Influenza Vaccine Revenue by Country (2017-2028) 71
9.3.3 Brazil 72
10 MIDDLE EAST AND AFRICA 73
10.1 Middle East and Africa Influenza Vaccine Market Size by Type 73
10.1.1 Middle East and Africa Influenza Vaccine Sales by Type (2017-2028) 73
10.1.2 Middle East and Africa Influenza Vaccine Revenue by Type (2017-2028) 74
10.2 Middle East and Africa Influenza Vaccine Market Size by Application 75
10.3 Middle East and Africa Influenza Vaccine Market Size by Country 76
10.3.1 Middle East and Africa Influenza Vaccine Sales by Country (2017-2028) 76
10.3.2 Middle East and Africa Influenza Vaccine Revenue by Country (2017-2028) 77
10.3.3 Middle East 79
10.3.4 Africa 79
11 CORPORATE PROFILE 80
11.1 Sanofi 80
11.1.1 Sanofi Corporation Information 80
11.1.2 Sanofi Overview 80
11.1.3 Sanofi Influenza Vaccine Sales, Price, Revenue and Gross Margin (2020-2022) 81
11.1.4 Sanofi Influenza Vaccine Product Introduction 81
11.1.5 Sanofi Recent Developments 83
11.2 CSL 84
11.2.1 CSL Corporation Information 84
11.2.2 CSL Overview 84
11.2.3 CSL Influenza Vaccine Sales, Price, Revenue and Gross Margin (2020-2022) 85
11.2.4 CSL Influenza Vaccine Product Introduction 86
11.2.5 CSL Recent Developments 86
11.3 GSK 88
11.3.1 GSK Corporation Information 88
11.3.2 GSK Overview 89
11.3.3 GSK Influenza Vaccine Sales, Price, Revenue and Gross Margin (2020-2022) 89
11.3.4 GSK Influenza Vaccine Product Introduction 90
11.4 Viatris 91
11.4.1 Viatris Corporation Information 91
11.4.2 Viatris Overview 92
11.4.3 Viatris Influenza Vaccine Sales, Price, Revenue and Gross Margin (2020-2022) 92
11.4.4 Viatris Influenza Vaccine Product Introduction 93
11.4.5 Viatris Recent Developments 93
11.5 AstraZeneca 94
11.5.1 AstraZeneca Corporation Information 94
11.5.2 AstraZeneca Overview 95
11.5.3 AstraZeneca Influenza Vaccine Sales, Price, Revenue and Gross Margin (2020-2022) 95
11.5.4 AstraZeneca Influenza Vaccine Product Introduction 96
11.5.5 AstraZeneca Recent Developments 97
11.6 Hualan Bio 97
11.6.1 Hualan Bio Corporation Information 97
11.6.2 Hualan Bio Overview 98
11.6.3 Hualan Bio Influenza Vaccine Sales, Price, Revenue and Gross Margin (2020-2022) 99
11.6.4 Hualan Bio Influenza Vaccine Product Introduction 99
11.7 Changchun Institute of Biological 100
11.7.1 Changchun Institute of Biological Corporation Information 100
11.7.2 Changchun Institute of Biological Overview 101
11.7.3 Changchun Institute of Biological Influenza Vaccine Sales, Price, Revenue and Gross Margin (2020-2022) 102
11.7.4 Changchun Institute of Biological Influenza Vaccine Product Introduction 102
11.7.5 Changchun Institute of Biological Recent Developments 103
11.8 Sinovac 103
11.8.1 Sinovac Corporation Information 103
11.8.2 Sinovac Overview 104
11.8.3 Sinovac Influenza Vaccine Sales, Price, Revenue and Gross Margin (2020-2022) 104
11.8.4 Sinovac Influenza Vaccine Product Introduction 104
11.8.5 Sinovac Recent Developments 106
11.9 BCHT 106
11.9.1 BCHT Corporation Information 106
11.9.2 BCHT Overview 107
11.9.3 BCHT Influenza Vaccine Sales, Price, Revenue and Gross Margin (2020-2022) 108
11.9.4 BCHT Influenza Vaccine Product Introduction 108
11.9.5 BCHT Recent Developments 109
11.10 Jiangsu GDK 110
11.10.1 Jiangsu GDK Corporation Information 110
11.10.2 Jiangsu GDK Overview 111
11.10.3 Jiangsu GDK Influenza Vaccine Sales, Price, Revenue and Gross Margin (2020-2022) 112
11.10.4 Jiangsu GDK Influenza Vaccine Product Introduction 112
11.11 KM Biologics 113
11.11.1 KM Biologics Corporation Information 113
11.11.2 KM Biologics Overview 113
11.11.3 KM Biologics Influenza Vaccine Sales, Price, Revenue and Gross Margin (2020-2022) 115
11.11.4 KM Biologics Influenza Vaccine Product Introduction 115
11.11.5 KM Biologics Recent Developments 116
12 INDUSTRY CHAIN AND SALES CHANNELS ANALYSIS 118
12.1 Influenza Vaccine Industry Chain Analysis 118
12.2 Influenza Vaccine Key Raw Materials 119
12.2.1 Key Raw Materials 119
12.2.2 Raw Materials Key Suppliers 119
12.3 Influenza Vaccine Production Mode & Process 121
12.4 Influenza Vaccine Sales and Marketing 122
12.4.1 Influenza Vaccine Sales Channels 122
12.4.2 Influenza Vaccine Distributors 123
12.5 Influenza Vaccine Customers 125
13 INFLUENZA VACCINE MARKET DYNAMICS 129
13.1.1 Influenza Vaccine Industry Trends 129
13.1.2 Influenza Vaccine Market Drivers 130
13.1.3 Influenza Vaccine Market Challenges 131
13.1.4 Influenza Vaccine Market Restraints 131
14 KEY FINDINGS IN THE GLOBAL INFLUENZA VACCINE STUDY 132
15 APPENDIX 134
15.1 Research Methodology 134
15.1.1 Methodology/Research Approach 134
15.1.2 Data Source 137
15.2 Author Details 140
15.3 Disclaimer 140
Table 1. Global Influenza Vaccine Market Size Growth Rate by Type, 2017 VS 2021 VS 2028 (US$ Million) 2
Table 2. Major Manufacturers of Quadrivalent Influenza Vaccine 5
Table 3. Global Influenza Vaccine Market Size Growth Rate by Application, 2017 VS 2021 VS 2028 (US$ Million) 5
Table 4. Global Influenza Vaccine Revenue by Region: 2017 VS 2021 VS 2028 (US$ Million) 12
Table 5. Global Influenza Vaccine Sales by Region (2017-2022) & (M Doses) 14
Table 6. Global Influenza Vaccine Sales Market Share by Region (2017-2022) 14
Table 7. Global Influenza Vaccine Sales by Region (2023-2028) & (M Doses) 15
Table 8. Global Influenza Vaccine Sales Market Share by Region (2023-2028) 15
Table 9. Global Influenza Vaccine Revenue by Region (2017-2022) & (US$ Million) 16
Table 10. Global Influenza Vaccine Revenue Market Share by Region (2017-2022) 17
Table 11. Global Influenza Vaccine Revenue by Region (2023-2028) & (US$ Million) 17
Table 12. Global Influenza Vaccine Revenue Market Share by Region (2023-2028) 17
Table 13. Global Influenza Vaccine Sales by Manufacturers (2020-2022) & (M Doses) 23
Table 14. Global Influenza Vaccine Sales Share by Manufacturers (2020-2022) 24
Table 15. Global Influenza Vaccine Revenue by Manufacturers (2020-2022) & (US$ Million) 26
Table 16. Global Influenza Vaccine Revenue Market Share by Manufacturers (2020-2022) 26
Table 17. Influenza Vaccine Price by Manufacturers (2020-2022) & (USD/Doses) 28
Table 18. Global Influenza Vaccine Manufacturers Market Concentration Ratio (CR5 and HHI) 29
Table 19. Global Influenza Vaccine by Company Type (Tier 1, Tier 2, and Tier 3) & (based on the Revenue in Influenza Vaccine as of 2021) 29
Table 20. Influenza Vaccine Manufacturing Base Distribution and Headquarters 30
Table 21. Manufacturers Influenza Vaccine Product Offered 30
Table 22. Founded Date of Influenza Vaccine Manufacturers 31
Table 23. Mergers & Acquisitions, Expansion Plans 31
Table 24. Global Influenza Vaccine Sales by Type (2017-2022) & (M Doses) 35
Table 25. Global Influenza Vaccine Sales by Type (2023-2028) & (M Doses) 35
Table 26. Global Influenza Vaccine Sales Share by Type (2017-2022) 35
Table 27. Global Influenza Vaccine Sales Share by Type (2023-2028) 36
Table 28. Global Influenza Vaccine Revenue by Type (2017-2022) & (US$ Million) 36
Table 29. Global Influenza Vaccine Revenue by Type (2023-2028) & (US$ Million) 37
Table 30. Global Influenza Vaccine Revenue Share by Type (2017-2022) 37
Table 31. Global Influenza Vaccine Revenue Share by Type (2023-2028) 37
Table 32. Influenza Vaccine Price by Type (2017-2022) & (USD/Doses) 38
Table 33. Global Influenza Vaccine Price Forecast by Type (2023-2028) & (USD/Doses) 38
Table 34. Global Influenza Vaccine Sales by Application (2017-2022) & (M Doses) 39
Table 35. Global Influenza Vaccine Sales by Application (2023-2028) & (M Doses) 39
Table 36. Global Influenza Vaccine Sales Share by Application (2017-2022) 39
Table 37. Global Influenza Vaccine Sales Share by Application (2023-2028) 40
Table 38. Global Influenza Vaccine Revenue by Application (2017-2022) & (US$ Million) 40
Table 39. Global Influenza Vaccine Revenue by Application (2023-2028) & (US$ Million) 41
Table 40. Global Influenza Vaccine Revenue Share by Application (2017-2022) 41
Table 41. Global Influenza Vaccine Revenue Share by Application (2023-2028) 41
Table 42. Influenza Vaccine Price by Application (2017-2022) & (USD/Doses) 42
Table 43. Global Influenza Vaccine Price Forecast by Application (2023-2028) & (USD/Doses) 42
Table 44. North America Influenza Vaccine Sales by Type (2017-2022) & (M Doses) 43
Table 45. North America Influenza Vaccine Sales by Type (2023-2028) & (M Doses) 43
Table 46. North America Influenza Vaccine Revenue by Type (2017-2022) & (US$ Million) 44
Table 47. North America Influenza Vaccine Revenue by Type (2023-2028) & (US$ Million) 44
Table 48. North America Influenza Vaccine Sales by Application (2017-2022) & (M Doses) 45
Table 49. North America Influenza Vaccine Sales by Application (2023-2028) & (M Doses) 45
Table 50. North America Influenza Vaccine Sales by Country (2017-2022) & (M Doses) 46
Table 51. North America Influenza Vaccine Sales by Country (2023-2028) & (M Doses) 46
Table 52. North America Influenza Vaccine Revenue by Country (2017-2022) & (US$ Million) 47
Table 53. North America Influenza Vaccine Revenue by Country (2023-2028) & (US$ Million) 47
Table 54. Europe Influenza Vaccine Sales by Type (2017-2022) & (M Doses) 50
Table 55. Europe Influenza Vaccine Sales by Type (2023-2028) & (M Doses) 50
Table 56. Europe Influenza Vaccine Revenue by Type (2017-2022) & (US$ Million) 51
Table 57. Europe Influenza Vaccine Revenue by Type (2023-2028) & (US$ Million) 51
Table 58. Europe Influenza Vaccine Sales by Application (2017-2022) & (M Doses) 52
Table 59. Europe Influenza Vaccine Sales by Application (2023-2028) & (M Doses) 52
Table 60. Europe Influenza Vaccine Sales by Country (2017-2022) & (M Doses) 53
Table 61. Europe Influenza Vaccine Sales by Country (2023-2028) & (M Doses) 53
Table 62. Europe Influenza Vaccine Revenue by Country (2017-2022) & (US$ Million) 54
Table 63. Europe Influenza Vaccine Revenue by Country (2023-2028) & (US$ Million) 54
Table 64. Asia Pacific Influenza Vaccine Sales by Type (2017-2022) & (M Doses) 58
Table 65. Asia Pacific Influenza Vaccine Sales by Type (2023-2028) & (M Doses) 58
Table 66. Asia Pacific Influenza Vaccine Revenue by Type (2017-2022) & (US$ Million) 59
Table 67. Asia Pacific Influenza Vaccine Revenue by Type (2023-2028) & (US$ Million) 59
Table 68. Asia Pacific Influenza Vaccine Sales by Application (2017-2022) & (M Doses) 60
Table 69. Asia Pacific Influenza Vaccine Sales by Application (2023-2028) & (M Doses) 60
Table 70. Asia Pacific Influenza Vaccine Sales by Region (2017-2022) & (M Doses) 61
Table 71. Asia Pacific Influenza Vaccine Sales by Region (2023-2028) & (M Doses) 61
Table 72. Asia Pacific Influenza Vaccine Revenue by Region (2017-2022) & (US$ Million) 62
Table 73. Asia Pacific Influenza Vaccine Revenue by Region (2023-2028) & (US$ Million) 63
Table 74. South America Influenza Vaccine Sales by Type (2017-2022) & (M Doses) 67
Table 75. South America Influenza Vaccine Sales by Type (2023-2028) & (M Doses) 67
Table 76. South America Influenza Vaccine Revenue by Type (2017-2022) & (US$ Million) 68
Table 77. South America Influenza Vaccine Revenue by Type (2023-2028) & (US$ Million) 68
Table 78. South America Influenza Vaccine Sales by Application (2017-2022) & (M Doses) 69
Table 79. South America Influenza Vaccine Sales by Application (2023-2028) & (M Doses) 69
Table 80. South America Influenza Vaccine Sales by Country (2017-2022) & (M Doses) 70
Table 81. South America Influenza Vaccine Sales by Country (2023-2028) & (M Doses) 70
Table 82. South America Influenza Vaccine Revenue by Country (2017-2022) & (US$ Million) 71
Table 83. South America Influenza Vaccine Revenue by Country (2023-2028) & (US$ Million) 71
Table 84. Middle East and Africa Influenza Vaccine Sales by Type (2017-2022) & (M Doses) 73
Table 85. Middle East and Africa Influenza Vaccine Sales by Type (2023-2028) & (M Doses) 73
Table 86. Middle East and Africa Influenza Vaccine Revenue by Type (2017-2022) & (US$ Million) 74
Table 87. Middle East and Africa Influenza Vaccine Revenue by Type (2023-2028) & (US$ Million) 74
Table 88. Middle East and Africa Influenza Vaccine Sales by Application (2017-2022) & (M Doses) 75
Table 89. Middle East and Africa Influenza Vaccine Sales by Application (2023-2028) & (M Doses) 75
Table 90. Middle East and Africa Influenza Vaccine Sales by Country (2017-2022) & (M Doses) 76
Table 91. Middle East and Africa Influenza Vaccine Sales by Country (2023-2028) & (M Doses) 77
Table 92. Middle East and Africa Influenza Vaccine Revenue by Country (2017-2022) & (US$ Million) 77
Table 93. Middle East and Africa Influenza Vaccine Revenue by Country (2023-2028) & (US$ Million) 78
Table 94. Sanofi Corporation Information 80
Table 95. Sanofi Description and Major Businesses 80
Table 96. Sanofi Influenza Vaccine Sales (M Doses), Revenue (US$ Million), Price (USD/Doses) and Gross Margin (2020-2022) 81
Table 97. Sanofi Influenza Vaccine Product Introduction 81
Table 98. Sanofi Recent Developments 83
Table 99. CSL Corporation Information 84
Table 100. CSL Description and Major Businesses 84
Table 101. CSL Influenza Vaccine Sales (M Doses), Revenue (US$ Million), Price (USD/Doses) and Gross Margin (2020-2022) 85
Table 102. CSL Influenza Vaccine Product Introduction 86
Table 103. CSL Recent Developments 86
Table 104. GSK Corporation Information 88
Table 105. GSK Description and Major Businesses 89
Table 106. GSK Influenza Vaccine Sales (M Doses), Revenue (US$ Million), Price (USD/Doses) and Gross Margin (2020-2022) 89
Table 107. GSK Influenza Vaccine Product Introduction 90
Table 108. Viatris Corporation Information 91
Table 109. Viatris Description and Major Businesses 92
Table 110. Viatris Influenza Vaccine Sales (M Doses), Revenue (US$ Million), Price (USD/Doses) and Gross Margin (2020-2022) 92
Table 111. Viatris Influenza Vaccine Product Introduction 93
Table 112. Viatris Recent Developments 93
Table 113. AstraZeneca Corporation Information 94
Table 114. AstraZeneca Description and Major Businesses 95
Table 115. AstraZeneca Influenza Vaccine Sales (M Doses), Revenue (US$ Million), Price (USD/Doses) and Gross Margin (2020-2022) 95
Table 116. AstraZeneca Influenza Vaccine Product Introduction 96
Table 117. AstraZeneca Recent Developments 97
Table 118. Hualan Bio Corporation Information 97
Table 119. Hualan Bio Description and Major Businesses 98
Table 120. Hualan Bio Influenza Vaccine Sales (M Doses), Revenue (US$ Million), Price (USD/Doses) and Gross Margin (2020-2022) 99
Table 121. Hualan Bio Influenza Vaccine Product Introduction 99
Table 122. Changchun Institute of Biological Corporation Information 100
Table 123. Changchun Institute of Biological Description and Major Businesses 101
Table 124. Changchun Institute of Biological Influenza Vaccine Sales (M Doses), Revenue (US$ Million), Price (USD/Doses) and Gross Margin (2020-2022) 102
Table 125. Changchun Institute of Biological Influenza Vaccine Product Introduction 102
Table 126. Changchun Institute of Biological Recent Developments 103
Table 127. Sinovac Corporation Information 103
Table 128. Sinovac Description and Major Businesses 104
Table 129. Sinovac Influenza Vaccine Sales (M Doses), Revenue (US$ Million), Price (USD/Doses) and Gross Margin (2020-2022) 104
Table 130. Sinovac Influenza Vaccine Product Introduction 104
Table 131. Sinovac Recent Developments 106
Table 132. BCHT Corporation Information 106
Table 133. BCHT Description and Major Businesses 107
Table 134. BCHT Influenza Vaccine Sales (M Doses), Revenue (US$ Million), Price (USD/Doses) and Gross Margin (2020-2022) 108
Table 135. BCHT Influenza Vaccine Product Introduction 108
Table 136. BCHT Recent Developments 109
Table 137. Jiangsu GDK Corporation Information 110
Table 138. Jiangsu GDK Description and Major Businesses 111
Table 139. Jiangsu GDK Influenza Vaccine Sales (M Doses), Revenue (US$ Million), Price (USD/Doses) and Gross Margin (2020-2022) 112
Table 140. Jiangsu GDK Influenza Vaccine Product Introduction 112
Table 141. KM Biologics Corporation Information 113
Table 142. KM Biologics Description and Major Businesses 113
Table 143. KM Biologics Influenza Vaccine Sales (M Doses), Revenue (US$ Million), Price (USD/Doses) and Gross Margin (2020-2022) 115
Table 144. KM Biologics Influenza Vaccine Product Introduction 115
Table 145. KM Biologics Recent Developments 116
Table 146. Key Raw Materials Lists 119
Table 147. Raw Materials Key Suppliers Lists 119
Table 148. Influenza Vaccine Distributors List 123
Table 149. Influenza Vaccine Customers List 125
Table 150. Influenza Vaccine Market Trends 129
Table 151. Influenza Vaccine Market Drivers 130
Table 152. Influenza Vaccine Market Challenges 131
Table 153. Influenza Vaccine Market Restraints 131
Table 154. Research Programs/Design for This Report 134
Table 155. Key Data Information from Secondary Sources 137
Table 156. Key Data Information from Primary Sources 138
List of Figures
Figure 1. Influenza Vaccine Product Picture 1
Figure 2. Global Influenza Vaccine Market Size Growth Rate by Type, 2017 VS 2021 VS 2028 (US$ Million) 2
Figure 3. Global Influenza Vaccine Market Share by Type: 2021 3
Figure 4. Global Influenza Vaccine Market Share by Type: 2028 3
Figure 5. Trivalent Influenza Vaccine Product Picture 4
Figure 6. Major Manufacturers of Trivalent Influenza Vaccine 4
Figure 7. Quadrivalent Influenza Vaccine Product Picture 5
Figure 8. Global Influenza Vaccine Market Size Growth Rate by Application, 2017 VS 2021 VS 2028 (US$ Million) 6
Figure 9. Global Influenza Vaccine Market Share by Application: 2021 6
Figure 10. Global Influenza Vaccine Market Share by Application: 2028 7
Figure 11. For Children (6 months to 3 years) 7
Figure 12. For Adults and Children over 3 years 8
Figure 13. Influenza Vaccine Report Years Considered 9
Figure 14. Global Influenza Vaccine Sales 2017-2028 (M Doses) 10
Figure 15. Global Influenza Vaccine Revenue, (US$ Million), 2017 VS 2022 VS 2028 11
Figure 16. Global Influenza Vaccine Revenue 2017-2028 (US$ Million) 12
Figure 17. Global Influenza Vaccine Revenue Market Share by Region in Percentage: 2021 13
Figure 18. Global Influenza Vaccine Revenue Market Share by Region in Percentage: 2028 13
Figure 19. Global Influenza Vaccine Sales Market Share by Region (2017-2022) 15
Figure 20. Global Influenza Vaccine Sales Market Share by Region (2023-2028) 16
Figure 21. North America Influenza Vaccine Sales YoY (2017-2028) & (M Doses) 18
Figure 22. North America Influenza Vaccine Revenue YoY (2017-2028) & (US$ Million) 18
Figure 23. Europe Influenza Vaccine Sales YoY (2017-2028) & (M Doses) 19
Figure 24. Europe Influenza Vaccine Revenue YoY (2017-2028) & (US$ Million) 19
Figure 25. Asia-Pacific Influenza Vaccine Sales YoY (2017-2028) & (M Doses) 20
Figure 26. Asia-Pacific Influenza Vaccine Revenue YoY (2017-2028) & (US$ Million) 20
Figure 27. South America Influenza Vaccine Sales YoY (2017-2028) & (M Doses) 21
Figure 28. South America Influenza Vaccine Revenue YoY (2017-2028) & (US$ Million) 21
Figure 29. Middle East & Africa Influenza Vaccine Sales YoY (2017-2028) & (M Doses) 22
Figure 30. Middle East & Africa Influenza Vaccine Revenue YoY (2017-2028) & (US$ Million) 22
Figure 31. The Influenza Vaccine Market Share of Top Largest Manufacturers Around the World in 2021 25
Figure 32. The Top Largest Manufacturers of Influenza Vaccine in the World: Market Share by Influenza Vaccine Revenue in 2021 27
Figure 33. Global Influenza Vaccine Sales Market Share by Type (2017-2028) 36
Figure 34. Global Influenza Vaccine Revenue Market Share by Type (2017-2028) 38
Figure 35. Global Influenza Vaccine Sales Market Share by Application (2017-2028) 40
Figure 36. Global Influenza Vaccine Revenue Market Share by Application (2017-2028) 42
Figure 37. North America Influenza Vaccine Sales Market Share by Type (2017-2028) 43
Figure 38. North America Influenza Vaccine Revenue Market Share by Type (2017-2028) 44
Figure 39. North America Influenza Vaccine Sales Market Share by Application (2017-2028) 45
Figure 40. North America Influenza Vaccine Sales Share by Country (2017-2028) 46
Figure 41. North America Influenza Vaccine Revenue Share by Country (2017-2028) 47
Figure 42. U.S. Influenza Vaccine Revenue (2017-2028) & (US$ Million) 48
Figure 43. Canada Influenza Vaccine Revenue (2017-2028) & (US$ Million) 48
Figure 44. Mexico Influenza Vaccine Revenue (2017-2028) & (US$ Million) 49
Figure 45. Europe Influenza Vaccine Sales Market Share by Type (2017-2028) 50
Figure 46. Europe Influenza Vaccine Revenue Market Share by Type (2017-2028) 51
Figure 47. Europe Influenza Vaccine Sales Market Share by Application (2017-2028) 52
Figure 48. Europe Influenza Vaccine Sales Share by Country (2017-2028) 54
Figure 49. Europe Influenza Vaccine Revenue Share by Country (2017-2028) 55
Figure 50. Germany Influenza Vaccine Revenue (2017-2028) & (US$ Million) 55
Figure 51. France Influenza Vaccine Revenue (2017-2028) & (US$ Million) 56
Figure 52. U.K. Influenza Vaccine Revenue (2017-2028) & (US$ Million) 56
Figure 53. Italy Influenza Vaccine Revenue (2017-2028) & (US$ Million) 57
Figure 54. Russia Influenza Vaccine Revenue (2017-2028) & (US$ Million) 57
Figure 55. Asia Pacific Influenza Vaccine Sales Market Share by Type (2017-2028) 58
Figure 56. Asia Pacific Influenza Vaccine Revenue Market Share by Type (2017-2028) 59
Figure 57. Asia Pacific Influenza Vaccine Sales Market Share by Application (2017-2028) 60
Figure 58. Asia Pacific Influenza Vaccine Sales Share by Region (2017-2028) 62
Figure 59. Asia Pacific Influenza Vaccine Revenue Share by Region (2017-2028) 63
Figure 60. China Influenza Vaccine Revenue (2017-2028) & (US$ Million) 64
Figure 61. Japan Influenza Vaccine Revenue (2017-2028) & (US$ Million) 64
Figure 62. South Korea Influenza Vaccine Revenue (2017-2028) & (US$ Million) 65
Figure 63. India Influenza Vaccine Revenue (2017-2028) & (US$ Million) 65
Figure 64. Australia Influenza Vaccine Revenue (2017-2028) & (US$ Million) 66
Figure 65. Southeast Asia Influenza Vaccine Revenue (2017-2028) & (US$ Million) 66
Figure 66. South America Influenza Vaccine Sales Market Share by Type (2017-2028) 67
Figure 67. South America Influenza Vaccine Revenue Market Share by Type (2017-2028) 68
Figure 68. South America Influenza Vaccine Sales Market Share by Application (2017-2028) 69
Figure 69. South America Influenza Vaccine Sales Share by Country (2017-2028) 70
Figure 70. South America Influenza Vaccine Revenue Share by Country (2017-2028) 71
Figure 71. Brazil Influenza Vaccine Revenue (2017-2028) & (US$ Million) 72
Figure 72. Middle East and Africa Influenza Vaccine Sales Market Share by Type (2017-2028) 74
Figure 73. Middle East and Africa Influenza Vaccine Revenue Market Share by Type (2017-2028) 75
Figure 74. Middle East and Africa Influenza Vaccine Sales Market Share by Application (2017-2028) 76
Figure 75. Middle East and Africa Influenza Vaccine Sales Share by Country (2017-2028) 77
Figure 76. Middle East and Africa Influenza Vaccine Revenue Share by Country (2017-2028) 78
Figure 77. Middle East Influenza Vaccine Revenue (2017-2028) & (US$ Million) 79
Figure 78. Africa Influenza Vaccine Revenue (2017-2028) & (US$ Million) 79
Figure 79. Influenza Vaccine Value Chain 118
Figure 80. Influenza Vaccine Production Process 121
Figure 81. Channels of Distribution 122
Figure 82. Distributors Profiles 124
Figure 83. Bottom-up and Top-down Approaches for This Report 136
Figure 84. Data Triangulation 137
Figure 85. Key Executives Interviewed 139
$4900
$9800
